
Translate this page into:
Performance indicators in the blood bank of a tertiary care hospital, as advocated by the national accreditation board for hospitals and healthcare providers

*Corresponding author: Suresh Iyyapan, Department of Transfusion Medicine, Saveetha Medical College and Hospitals, Chennai, Tamil Nadu, India. sureshiyyapan.sk@gmail.com
-
Received: ,
Accepted: ,
How to cite this article: Rajkumar A, Iyyapan S, Sukumaran S. Performance indicators in the blood bank of a tertiary care hospital, as advocated by the national accreditation board for hospitals and healthcare providers. J Lab Physicians. doi: 10.25259/JLP_194_2024
Abstract
Objectives
This study aimed to assess the quality indicators (QIs) defined by the National Accreditation Board for Hospitals and Healthcare Providers (NABH) in a blood center of a tertiary care hospital and to implement corrective and preventive actions for achieving the benchmark values of various quality control parameters.
Materials and Methods
A cross-sectional analytical study was designed and carried out at the Department of Transfusion Medicine in a tertiary care medical college and hospital in Chennai. All data were retrieved from records maintained at the blood center from June 2022 to May 2023. Problems were identified, and actions were undertaken to achieve benchmark values.
Statistical analysis
Data collected were entered in Microsoft Excel version 2016 and appropriate calculations were done according to the formulas depicted in NABH key performance indicators (KPIs). Values obtained were compared with benchmark standard data.
Results
Out of the ten KPIs that were studied, more than 75% met the quality standards. Interventions were planned for KPIs that did not meet the benchmark. The observed and post-intervention values for those are transfusion-transmitted infections-syphilis 0.17% and 0.17%, platelet wastage 46.06% and 36.2%, turnaround time for anti-human globulin phase cross-match 66.7 and 45 min, donor deferral rate 14.05% and 11.5%, and percentage of voluntary donors 66.6% and 74%, respectively.
Conclusions
Our study has provided valuable insights into adherence to NABH QIs. Even though adherence to these guidelines is not mandatory, achieving them through thorough analysis helped us to identify areas that require attention and improvement for establishing comprehensive vein-to-vein safety.
Keywords
Benchmark values
Blood center
Key performance indicators
National accreditation board for hospitals and healthcare providers

INTRODUCTION
Blood transfusion services form one of the most fundamental and crucial parts of the health care system. The essence of safe transfusion is emphasized as “right blood, right time, right patient, and right place.”[1] These blood transfusion services must ensure the appropriate administration of blood components, which include both the dosage and specific type of blood components intended for specific clinical conditions of the patient. The blood center (According to latest amendment of Drug and Cosmetic rules 1945 done on 11/3/2020 -G.S.R. 166(E) released by Ministry of Health and Family Welfare, the term blood bank have been replaced by blood center) has to ensure that the transfusion of interest poses minimal risk to the recipients and the transfused blood component has to satisfy the quality criteria as advocated by governing authorities to provide maximal therapeutic benefit to the patients.
Quality management system (QMS) was mainly implemented to achieve zero risk associated with blood transfusion. It involves the structure of an organization, policies, procedures, responsibilities, and resources of the management to establish and maintain good quality.[2] These nationally constituted dedicated bodies have devised certain specific tools to monitor the quality control (QC) of blood transfusion services through certain parameters which are known as key performance indicators (KPIs) or quality indicators (QI).[3] The assessment of these parameters validates the QMS of any blood transfusion center. After assessment, if there are any shortfalls in these parameters from its benchmark values, then corrective and preventive action (CAPA) has to be accomplished to maintain QMS effectively.
Various international organizations and associations perform accreditation programs, namely, the American Association of Blood Bank, the College of American Pathologists, the International Society of Blood Transfusion, and the Joint United Kingdom Blood Transfusion Services Professional Advisory Committee.[4] As the cornerstone of healthcare accreditation in India, the National Accreditation Board for Hospitals and Healthcare Providers (NABH) plays a pivotal role in ensuring the quality and safety of healthcare services across various domains. Within this framework, blood centers stand as critical entities responsible for the collection, processing, and distribution of blood and its components. Recognizing the paramount importance of maintaining high standards in these facilities, NABH conducts assessments focused on KPIs to safeguard the integrity and quality of blood products.[5]
NABH’s assessment process involves a comprehensive evaluation of various KPIs encompassing critical aspects of blood center operations. These KPIs encompass donor safety, blood collection, storage, testing, and distribution processes. The assessment of KPIs serves as a benchmark for blood centers, encouraging continuous improvement in their functional protocol. Our study was undertaken to evaluate the quality standards and practices in our blood center as per the NABH KPIs. The findings of our study can be used to strategize and implement CAPA that could stand as a forerunner for various blood centers across the nation to achieve the benchmark value.
MATERIALS AND METHODS
A retrospective cross-sectional analytical study was conducted in the Department of Transfusion Medicine in a tertiary medical college and hospital in Chennai. All relevant data were retrieved from records maintained at our Blood center and from the Medical Information Archiving Software database of the hospital for a period of 12 months from June 2022 to May 2023. Donor and patient details were kept confidential. Local management’s clearance was taken before data compilation. The various KPIs defined by NABH[6] that were studied include:
Percentage of transfusion-transmitted infections (TTI %)
Percentage of adverse transfusion reactions (ATTR %)
Wastage rate
Turnaround time (TAT) of blood issues
Percentage of component QC failure
Percentage of adverse donor reactions
Percentage of donor deferrals
Percentage of components prepared from whole blood
Percentage of TTI outliers
Percentage of voluntary blood donations
Percentage of quantity not sufficient (QNS) in blood collection
Delay in transfusion time beyond 30 min.
The formula for the calculation of the various KPIs defined by NABH is described in Table 1.
| S. No. | Quality indicator | Formula |
|---|---|---|
| 1 | TTI % | |
| 2 | ATTR % | |
| 3 | Wastage rate | |
| 4 | TAT for cross-match | |
| 5 | Percentage of QC failure | |
| 6 | Adverse donor reaction rate | |
| 7 | Donor deferral rate | |
| 8 | Percentage of components prepared | |
| 9 | Percentage of TTI outliers | |
| 10 | Percentage of voluntary blood donations | |
| 11 | % of QNS collection | |
| 12 | Delay in transfusion beyond 30 min | No. of issues not transfused after 30 min |
TTI: Transfusion-transmitted infections, ATTR: Adverse transfusion reaction rate, TAT: Turn-around time, QNS: Quantity not sufficient, HIV: Human immunodeficiency virus, HBV: Hepatitis B virus, HCV: Hepatitis C virus, QC: Quality control, NABH: National accreditation board for hospitals and healthcare providers, RBC: Red blood cells, SD: Standard deviation
Data collected were entered in Microsoft Excel version 2016 and appropriate calculations were done. Values obtained were compared with benchmark standard data.[7] Root cause analysis of all non-conformance parameters was done. Problems and lacunae were identified, and effective CAPAs were implemented to achieve the benchmark values.
RESULTS
Of the 12 KPIs that were studied, our data strongly supported an achievement of more than 75% of the quality standards. The first five indicators are considered mandatory indicators as per NABH. The ones that did not meet the benchmark were TTI-syphilis, platelet wastage rate, TAT for Anti-human globulin (AHG) phase cross-match, donor deferral rate, and % of voluntary donation. The benchmark and the observed values are represented in Table 2. The interventions for deviated KPIs were planned and executed to achieve benchmark values which are shown in Table 3. Those parameters which have been improved by intervention are shown in Figure 1.
| S. No. | Key performance indicator | Observed value (%) | Benchmark[7] | Remarks |
|---|---|---|---|---|
| 1 | TTI% | 65 (1.54) | <4% | ✓ |
| HIV | 10 (0.25) | 0.28% | ✓ | |
| HBsAg | 24 (0.50) | 3% | ✓ | |
| HCV | 23 (0.55) | 2% | ✓ | |
| Syphilis | 8 (0.17) | 0.11% | ✖ | |
| Malaria | 1 (0.01) | 0.03% | ✓ | |
| 2 | ATTR% | 28 (0.37) | <2% | ✓ |
| 3 | Wastage rate | |||
| PRBC | 10 (0.24) | <1% | ✓ | |
| FFP and cryoprecipitate | 13 (0.25) | <1% | ✓ | |
| Platelets | 1928 (46.06) | <22% | ✖ | |
| 4 | TAT for cross match – AHG phase | 66.7 min | 60 min | ✖ |
| 5 | Component QC failure | 75% | ||
| PRBC | 13.5% | ✓ | ||
| RDP | 22.4% | ✓ | ||
| SDP | 20.2% | ✓ | ||
| FFP | 15.5% | ✓ | ||
| 6 | Adverse donor reaction rate | 5 (0.12%) | <2% | ✓ |
| 7 | Donor deferral rate | 559 (14.05%) | 10-12% | ✖ |
| 8 | Percentage of blood component preparation | 100% | 100% | ✓ |
| 9 | Percentage of TTI outliers | 0% | 0% | ✓ |
| 10 | Percentage of voluntary blood donations | 2819 (66.3%) | 100% | ✖ |
| 11 | % QNS collection | 23 (1.82%) | ||
| 12 | Delay in transfusion beyond 30 min after issue | (25.7 min) 14.5% | <15% | ✓ |
TTI: Transfusion-transmitted infections, ATTR: Adverse transfusion reaction rate, TAT: Turn-around time, QNS: Quantity not sufficient, PRBC: Packed red blood cell, RDP: Random donor platelet, SDP: Single donor platelet, FFP: Fresh frozen plasma, HIV: Human immunodeficiency virus, HBsAg: Hepatitis B surface antigen, HCV: Hepatitis C virus, AHG: Anti-human globulin, QC: Quality control, Tick mark (✓): Benchmark achieved, x mark (✖): Benchmark not achieved
| S. No. | Key performance indicator | Observed value | Intervention | Post-intervention value |
|---|---|---|---|---|
| 1 | TTI- Syphilis | 0.17% | Voluntary donors were mobilized. Stringent donor screening practices were followed. | 0.12% |
| 2 | Wastage rate-platelets | 46.06% | FIFO policy. Out-of-group transfusion for adults was employed. Demand-based platelet collection with double/triple blood bags. Training programs were conducted frequently at regular intervals to prevent wastage during component separation and storage. | 36.2% |
| 3 | TAT for cross-match – AHG phase | 66.7 min | An automated immunohematology analyzer was introduced and hence TAT was reduced | 45 min |
| 4 | Donor deferral rate | 14.05 | Educating the blood donors by pre-donation information materials such as pamphlets, banners, and audiovisuals were incorporated. | 11.5% |
| 5 | Percentage of voluntary blood donations | 66.3% | Regular voluntary blood donation camps were conducted in colleges, religious groups, and industries. | 74% |
TTI: Transfusion transmitted infections, FIFO: First in first out, AHG: Anti-human globulin, TAT: Turn-around time
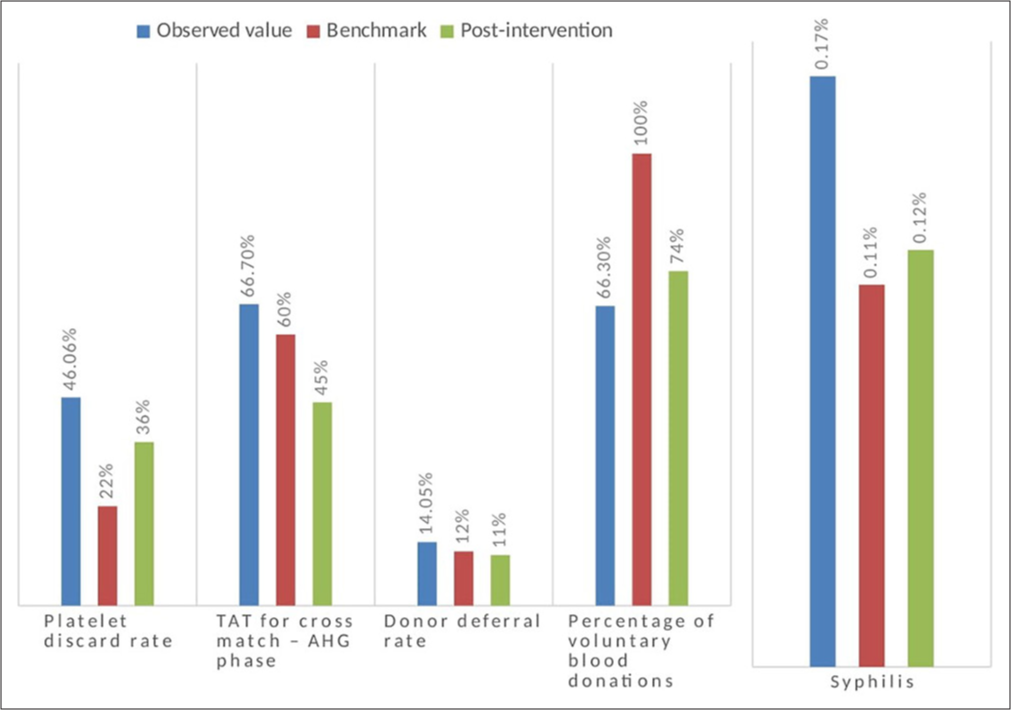
- Comparison of observed value, benchmark, and post-intervention values. AHG: Anti-human globulin
DISCUSSION
KPIs help systematically monitor, evaluate, and enhance service delivery. They act as guideposts to show progress toward objectives and areas for sustainable improvement to achieve the goal. QIs are measurable factors that indicate the prevalent condition or progression of performance over time, reflecting progress toward set quality goals.
A well-designed KPI framework is essential for enhancing performance and accountability within the healthcare sector in any hospital. By establishing baseline requirements, setting performance standards and targets, measuring and reporting improvement, comparing performance across centers in the same geographic locations, benchmarking against peers, and allowing stakeholders to judge performance independently, healthcare organizations can drive positive change and improve overall health outcomes. In our study, based on the KPIs assessed, root cause analysis was done, and CAPA was suggested and successfully implemented as well.
The overall TTI % in our study was 1.54% which is within the benchmark of 4%. Throughout the study period, the highest prevalence was observed with syphilis (0.17%), notably exceeding the benchmark of 0.11%. In a similar study, Gnanaraj et al. also reported a higher prevalence of syphilis.[8] Analyzing the cause of this increase may be attributed to several factors, such as false-positive test results, insufficient awareness among younger donors regarding high-risk behaviors and self-deferral, and a rising incidence of infections in the region.[9]
The ATTR was 0.37%, with no hemolytic transfusion reaction reported, which meets the benchmark value. The most common were allergic reactions and febrile non-hemolytic transfusion reactions. Other studies by Chakravarty et al. and Bhattacharya et al. reported a lower incidence of 0.16% and 0.14%, respectively.[10,11] All transfusion reactions were investigated according to the departmental Standard Operating Procedure and were promptly reported to the hemovigilance program of India. The use of appropriate modified blood components could further reduce this incidence. Continuous education to the medical and paramedical staff is also being carried out at our center to follow proper transfusion guidelines and practices.
Wastage rate includes blood component units that are outdated on the shelf due to expiry, breakage/leakage units, under-collected units, and hemolyzed/lipemic/indeterminate units. It also includes units that were returned after 30 min of issue without transfusion. It does not include wastage due to positive TTI. In our blood center, the wastage rate for packed red blood cells (RBC) was only 0.24% due to the stringent first in, first out policy; fresh frozen plasma was 0.25%, and platelet was 46.06%. Due to their short shelf life, platelets were the most frequently discarded units. This was similar to studies reported by Suresh et al. and Kaur et al., where platelets were the most commonly discarded component.[12,13] However, they reported lower platelet discard rates of 16.3% and 12%, respectively. Among the platelets discarded in our center, 93% were past the due expiry date, 5% were contaminated with RBC, and 2% were due to leakage. This can be explained by the fact that platelet concentrate is used less frequently due to a preference for single-donor platelets over random-donor platelets, which has left an excess of platelet concentrates in the inventory.[14]
TAT is calculated from the minute the request arrives at the blood bank till the blood (cross-matched/reserved) is made available for transfusion. The self-set benchmark for routine AHG phase cross-match in our blood center was 60 min. The mean TAT in our study was found to be 66.7 min. Improper sample collection, like a lysed sample, delays the TAT when a repeat sample needs to be requested. Manual methods of cross-match are also time-consuming. According to Sharma et al., several issues about laboratory staff and human resources management caused the TAT to be delayed.[15]
According to the NABH, 1% of total components is usually tested for QC, out of which 75% should meet the acceptable ranges. Following the same, 1 unit per week for the various components was chosen randomly and checked for QC. Data from the quality register showed that the percentage of QC failure was within the benchmark range. The highest QC failure was among the random donor platelets, where 22.4% did not meet the QC, but this was within the benchmark. The possible reasons could be improper sampling during testing, equipment failure, or technical flaws during component preparation. To improve the QC percentage, technicians were emphasized to strictly follow SOP during component preparation and sampling. Regular calibration and maintenance of the centrifuge were also supervised.
Among the non-mandatory indicators, our blood center had 100% component preparation. When whole blood requests were received, the need for whole blood was analyzed, and physicians were advised about component therapy and its advantages over whole blood. Furthermore, during the study period, there were no TTI outliers, and the same can be attributed to the extensive pre-donation screening.
The adverse donor reaction rate was 0.12%. The most commonly observed one was the vasovagal reaction. This was below the benchmark of 2%. Pre-donation hydration and post-donation counseling are followed routinely. Donor adverse reaction rate in studies by Agnihotri et al. was 2.5% and Varshney et al. was 1.15%.[16,17] In comparison with the above studies, pre-donation and post-donation counseling techniques, as well as donor demographics, may be responsible for this variance.
In our study, we observed an overall donor deferral rate of 14.05%, slightly above the benchmark of 12%. The primary reason for deferral was low hemoglobin levels, followed by recent medication history. Other common reasons included recent vaccinations, high blood pressure, and a history of tattooing. Notably, female donors were more frequently deferred due to low hemoglobin, a trend consistent with findings from previous studies.[18,19]
At our blood center, we aim to achieve 100% voluntary blood donations, with the current voluntary rate standing at 66.3%. The remainder consists of donations from family and friends as replacement donors.
The percentage of QNS collections in our study was 1.82%. QNS occurs when <10% of the standard blood bag volume is collected, rendering the blood unsuitable for transfusion due to insufficient volume relative to the amount of anticoagulant present.[20] Low blood volume can result from various factors, such as slow flow due to small veins during phlebotomy or donor reactions necessitating donation cessation. To mitigate these issues, adjustments to the blood bag’s blood-to-anticoagulant ratio are necessary in cases of suboptimal collections. Regular calibration of automated blood collection monitors is critical to ensure accurate volume measurements. In addition, our phlebotomists have received specialized training in optimal vein selection and proficient phlebotomy techniques to minimize the occurrence of QNS collections.
A delay in transfusion beyond 30 min of the issue was seen in 14.5% of the cases. This was on the borderline of the benchmark standard. In our root cause analysis, we found staff nurses and resident physicians ignorant of the consequences of transfusion time delays. In a similar study, Sapkota et al. noted that the lack of suitable nursing staff, ward staff, or doctors at the time of transfusion to initiate the procedure after crosschecking by two medically registered trained individuals was found to be the cause of the delay in commencing the transfusion.[21] Orientation sessions for staff nurses, interns, and residents were done to raise awareness of starting transfusions by protocol for each component and explain the delay’s repercussions. Surprise visits and frequent audits to cross-check transfusion procedures in various departments were done to identify the departments that were reproachable, and steps were taken to prevent recurrence through training and awareness campaigns.
Limitations and future directions
The short time frame was a major limitation. Being a single-center study, the interventions to meet benchmarks could not be universalized. These interventions can be tried in various centers across the country to look for the feasibility of implementing them in all centers to achieve NABH benchmarks.
CONCLUSIONS
Our study highlights valuable insights toward adherence to NABH QIs. The conduct of the study aided us in identifying areas of excellence and areas that require attention and improvement. Although guidelines are not mandatory for a Blood Center to be operational, conserving standards at individual centers to achieve the highest QC will establish comprehensive safety procedures overall, starting from the donor vein to the patient vein. Commitment to ensure adherence to these parameters is crucial to maintaining the highest standards of quality and safety in blood transfusion practices.
Acknowledgment
We would like to express our gratitude to the blood center technicians for maintaining the registry effectively and helping out during our study.
Author contribution
AR: Manuscript writing, data retrieving, data analysis; SI: Conceptualization, methodology framing, validating the results, review of manuscript, manuscript editing, gave the final approval for publishing; SS: Manuscript editing and proof reading.
Ethical approval
The research/study was approved by the Institutional Review Board at Saveetha Medical College and Hospitals, number SMCH/IRB/2022/May/288, dated May 06, 2022.
Declaration of patient consent
Patient’s consent not required as patients identity is not disclosed or compromised.
Conflicts of interest
There are no conflicts of interest.
Use of artificial intelligence (AI)-assisted technology for manuscript preparation
The authors confirm that there was no use of artificial intelligence (AI)-assisted technology for assisting in the writing or editing of the manuscript and no images were manipulated using AI.
Financial support and sponsorship: Nil.
References
- Patient-specific component requirements: 'Right blood, right patient, right time, right place' ISBT Sci Ser. 2009;4:52-5.
- [CrossRef] [Google Scholar]
- Quality management systems: Principles and practice In: Cohn CS, Delaney M, Johnson ST, Katz LM, eds. Technical manual (20th ed). United States: AABB Press; 2020. p. :1-29.
- [Google Scholar]
- Role of National Accreditation Board of Hospitals and Healthcare Providers (NABH) core indicators monitoring in quality and safety of blood transfusion. Asian J Transfus Sci. 2016;10:37-41.
- [CrossRef] [PubMed] [Google Scholar]
- Systems for accreditation in blood transfusion services. ISBT Sci Ser. 2009;4:14-7.
- [CrossRef] [Google Scholar]
- Quality indicators in transfusion medicine: The building blocks. ISBT Sci Ser. 2011;6:35-45.
- [CrossRef] [Google Scholar]
- National Accreditation Board for Hospitals and Healthcare Providers, New Delhi, India. :130-36.
- [Google Scholar]
- Training manual In: Ministry of Health and Family Welfare, Government of India. NACO/NBTC; 2016. p. :174-7.
- [Google Scholar]
- Assessment of the key performance indicator proposed by NABH in the blood centre of a tertiary health care hospital in Southern India. Indian J Hematol Blood Transfus. 2023;39:308-16.
- [CrossRef] [PubMed] [Google Scholar]
- Syphilis: Is it back with a bang? Indian Dermatol Online J. 2024;15:73-7.
- [CrossRef] [PubMed] [Google Scholar]
- Adverse reactions of blood transfusion: A study in a tertiary care hospital. Int J Sci Stud. 2016;4:90-4.
- [Google Scholar]
- Transfusion-related adverse events at the tertiary care center in North India: An institutional hemovigilance effort. Asian J Transfus Sci. 2011;5:164-70.
- [CrossRef] [PubMed] [Google Scholar]
- Reasons for discarding whole blood and its components in a tertiary care teaching hospital blood bank in South India. J Clin Sci Res. 2015;4:213-9.
- [CrossRef] [Google Scholar]
- Incidence and causes of wastage of blood and blood components in a blood bank of tertiary care hospital: A retrospective study. IOSR-JDMS. 2016;15:108.
- [CrossRef] [Google Scholar]
- Stemming the flow: Causes and solutions for blood and blood component wastage in a tertiary care hospital. Cureus. 2024;16:e59493.
- [CrossRef] [Google Scholar]
- Analysis of turnaround time for issuance of blood products in emergency: A prospective study in a tertiary care centre in Jammu. J Med Sci Clin Res. 2018;6:11.
- [CrossRef] [Google Scholar]
- Analysis of adverse events and predisposing factors in voluntary and replacement whole blood donors: A study from north India. Asian J Transfus Sci. 2012;6:155-60.
- [CrossRef] [PubMed] [Google Scholar]
- Quality indicators: Performance tools of blood transfusion service. J Evol Med Dent Sci. 2017;6:6348-52.
- [CrossRef] [Google Scholar]
- Pre-donation deferral of blood donors in South Indian set-up: An analysis. Asian J Transfus Sci. 2010;4:112-5.
- [CrossRef] [PubMed] [Google Scholar]
- Whole blood donor deferral causes in a tertiary care teaching hospital blood bank from south India. Hematol Transfus Int J. 2017;5:116.
- [CrossRef] [Google Scholar]
- Blood collection In: Gupta S, Marwaha N, Chaudhary R, Gupta D, Kaur R, Bhavsar S, eds. Transfusion medicine technical manual (3rd ed). India: DGHS; 2022. p. :20-39.
- [Google Scholar]
- Blood transfusion practice among healthcare personnel in Nepal: An observational study. J Blood Transfus. 2018;2018:6190859.
- [CrossRef] [PubMed] [Google Scholar]


