
Translate this page into:
Accuracy of screening for hemolysis in plasma samples using a commercial urine dipstick

*Corresponding author: Giuseppe Lippi, Section of Clinical Biochemistry, University of Verona, Verona, Italy. giuseppe.lippi@univr.it
-
Received: ,
Accepted: ,
How to cite this article: Pighi L, Nitto SD, Henry B, Lippi G. Accuracy of screening for hemolysis in plasma samples using a commercial urine dipstick. J Lab Physicians. 2024;16:315-9. doi: 10.25259/JLP-2023-8-25-(1935)
Abstract
Objectives:
Identification and quantification of hemolysis in serum or plasma samples is an important requirement in laboratory diagnostics; however, this is not always possible automatically, and visual sample inspection is not sufficiently accurate. We have planned this study to determine whether a commercially available urine dipstick with a hemoglobin-reactive pad could be used for this purpose.
Materials and Methods:
Sixty-five routine plasma samples, whose hemolysis index (HI) was previously determined on Roche Cobas 8000, were assayed with a commercial urine dipstick to obtain semi-quantitative data on plasma hemoglobin. Plasma was diluted 1:1000 in water to enter the dipstick’s range of hemoglobin measurement, and 10 µL of this dilution was applied to the hemoglobin pad. Results were visually interpreted within 60 s by comparing the pad color with that on the dipstick box label.
Statistical Analysis:
Semi-quantitative test results obtained with the urine dipstick were directly correlated with those of the same samples assayed on Roche Cobas 8000 using non-parametric Spearman’s correlation and agreement.
Results:
The sample size consisted of 40 non-hemolyzed (HI ≤0.3 g/L) and 25 hemolyzed (HI >0.3 g/L) plasma samples. Spearman’s correlation between Cobas HI and dipstick hemoglobin concentration was r = 0.96 (95% confidence interval, 0.93–0.97; P < 0.001). The concordance of hemolysis detection was 95.4%, with 1.00 sensitivity, 0.93 specificity, 1.00 negative predictive value, and 0.89 positive predictive value compared to the reference HI measurement on Cobas. The cumulative agreement between Cobas HI and the various plasma hemoglobin thresholds obtained with the dipstick was 75.4%.
Conclusions:
We have demonstrated here that plasma hemoglobin assessment with commercially available urine dipsticks may generate semi-quantitative test results accurate enough to influence decision-making regarding sample quality and its suitability for testing.
Keywords
Dipstick
Plasma
Test strip
Urine
Hemolysis

INTRODUCTION
The assessment of the so-called hemolysis index (HI), together with the icterus index (II) and the lipemia index (LI) altogether, abbreviated as “HIL,” has become a cornerstone of preanalytical and analytical quality in laboratory medicine because they allow the amount of these three interfering substances in the test sample to be determined and quantified accurately, rapidly, and inexpensively. Nevertheless, their routine use in clinical laboratories is unfortunately not as widespread as it should be.[1]
First, not all laboratory analyzers are already equipped with these measures (e.g., they are still absent in some stand-alone immunochemical and hemostasis platforms and cannot be used for manual tests, including enzyme-linked immunosorbent assay [ELISA] and other similar techniques).[2] Notably, hemolysis may seriously interfere with several immunological and clotting assays, as more comprehensively described elsewhere.[3] The interference deriving from the presence of cell-free hemoglobin may arise from three possible mechanisms.[2,3] The first and most widely recognized is attributable to the release of hemoglobin and other intracellular compounds in serum or plasma after blood cell injury, which would then cause a false increase in these analytes (i.e., hyperkalemia is a paradigmatic example). The second mechanism involves chemical interference of cell-free hemoglobin in various analytical reactions (e.g., interference with the enzymatic creatine kinase assay is a typical case). Finally, hemoglobin may also trigger significant spectrophotometric interference caused by an increase in optical absorbance or a change in blank value in various laboratory tests based on measurements at 415, 540, and 570 nm, where hemoglobin absorbs more, including immunoassays (interference in cardiac troponin assays is very common).
A large survey by the European Federation of Clinical Chemistry and Laboratory Medicine (EFLM), which received 1405 responses from 37 European countries, recently showed that around 15% of facilities do not routinely monitor HIL[4] and, more importantly, this percentage was found to be unexpectedly high for microbiology (up to 44%), molecular biology (42%), and toxicology (40%) testing. Another interesting aspect that emerged from this study was that up to one-third of all laboratories did not use automatic HIL detection but instead employed a visual scale for hemolysis detection, usually represented by a reference color photograph indicating different hemolysis levels in reference plasma samples.[4] Responses to the question of at what hemolysis threshold samples should be defined as hemolyzed were even more heterogeneous, as there was an almost even distribution of responses among four graded hemolysis thresholds.[4] Similar evidence emerged from other surveys conducted in various countries. For example, the College of American Pathologists surveyed 846 participants in the Chemistry Survey[5] and reported that only a limited number (always <50%) had standardized procedures for handling hemolyzed specimens. In addition, less than half of them had taken recent corrective action to reduce hemolysis burden, using many different approaches.
Overall, these data paint a worrying picture regarding the practice of pre-test hemolysis assessment for potentially impaired tests, which is now unavoidable and recommended by most international and national laboratory medicine organizations.[6,7] In addition, visual inspection of the hue of a sample without automated HIL monitoring has a number of disadvantages,[8] such as subjective and arbitrary interpretation of color, the influence of relative ambient lighting, sample composition (i.e., high bilirubin concentration), and so on. Therefore, the availability of simple and rapid means to obtain semi-quantitative information about the HI of the test sample could help to overcome most of the limitations highlighted in the European Federation of Clinical Chemistry and Laboratory Medicine survey. To this end, we have planned an analytical study to determine whether a commercially available urine dipstick containing a hemoglobin-reactive pad could be used for this purpose.
MATERIALS AND METHODS
We selected 65 anonymized remnant plasma samples (3.5-mL lithium-heparin blood tubes; Vacutest Kima, Padova, Italy) obtained on the morning of a regular working day in the Laboratory Medicine Service of the University Hospital of Verona, remaining after completion of routine tests. Sample identity was replaced with specific identifiers for prohibiting identifiability, but remaining suitable for analysis. Forty of the selected plasma samples had HI values ≤30 (i.e., ≤0.3 g/L, classified as non-hemolyzed), while the remaining 25 had HI values >30 (i.e., >0.3 g/L, classified as hemolyzed), as widely recommended.[9] The HI on Roche Cobas analyzers is assayed with by-chromatic measurement at double wavelengths (570 and 600 nm, with correction for lipemia) and is reported in arbitrary units, which can be roughly converted in hemoglobin concentration, where one arbitrary units of HI correspond to 0.01 g/L of hemoglobin.[10]
These 65 plasma samples were then used to assess plasma hemoglobin concentration with a commercially available urine dipstick (AUTION Sticks, Arkray, Kyoto, Japan), the technical and analytical characteristics of which have been described elsewhere.[11] Briefly, a 1:1000 plasma dilution (i.e., 10 µL of plasma in 10 mL of water) was performed in distilled water to fit the concentration of hemoglobin within the measurement range of the urine hemoglobin pad in the dipstick, and 10 µL of this 1:1000 dilution were then pipetted onto the “blood” pad of the dipstick. Excess plasma was carefully removed with a paper towel, and test results were interpreted visually within 60 s by direct comparison of the color produced in the pad with that reported on the label of the dipstick box label [Figure 1]. Two experienced laboratory physicians were responsible for interpreting the visual readings, and a third laboratory physician resolved any discrepancies. The dipstick hemoglobin assay reagent contains 30 mg of cumene hydroperoxide and 15 mg of 3,3’,5,5’-tetramethylbenzidine with a measurement range between 0.03 mg/dL and 1.0 mg/dL (0.0003–0.01 g/L) of hemoglobin, and stepwise semi-quantitative thresholds of 0 (negative), 0.0003 (±), 0.0006 (1+), 0.002 (2+), and 0.01 (3+) g/L of hemoglobin [Figure 1]. Dipstick results were reported as hemoglobin concentration (in g/L) after adjustment for the dilution factor (i.e., visual results were multiplied by 1000).
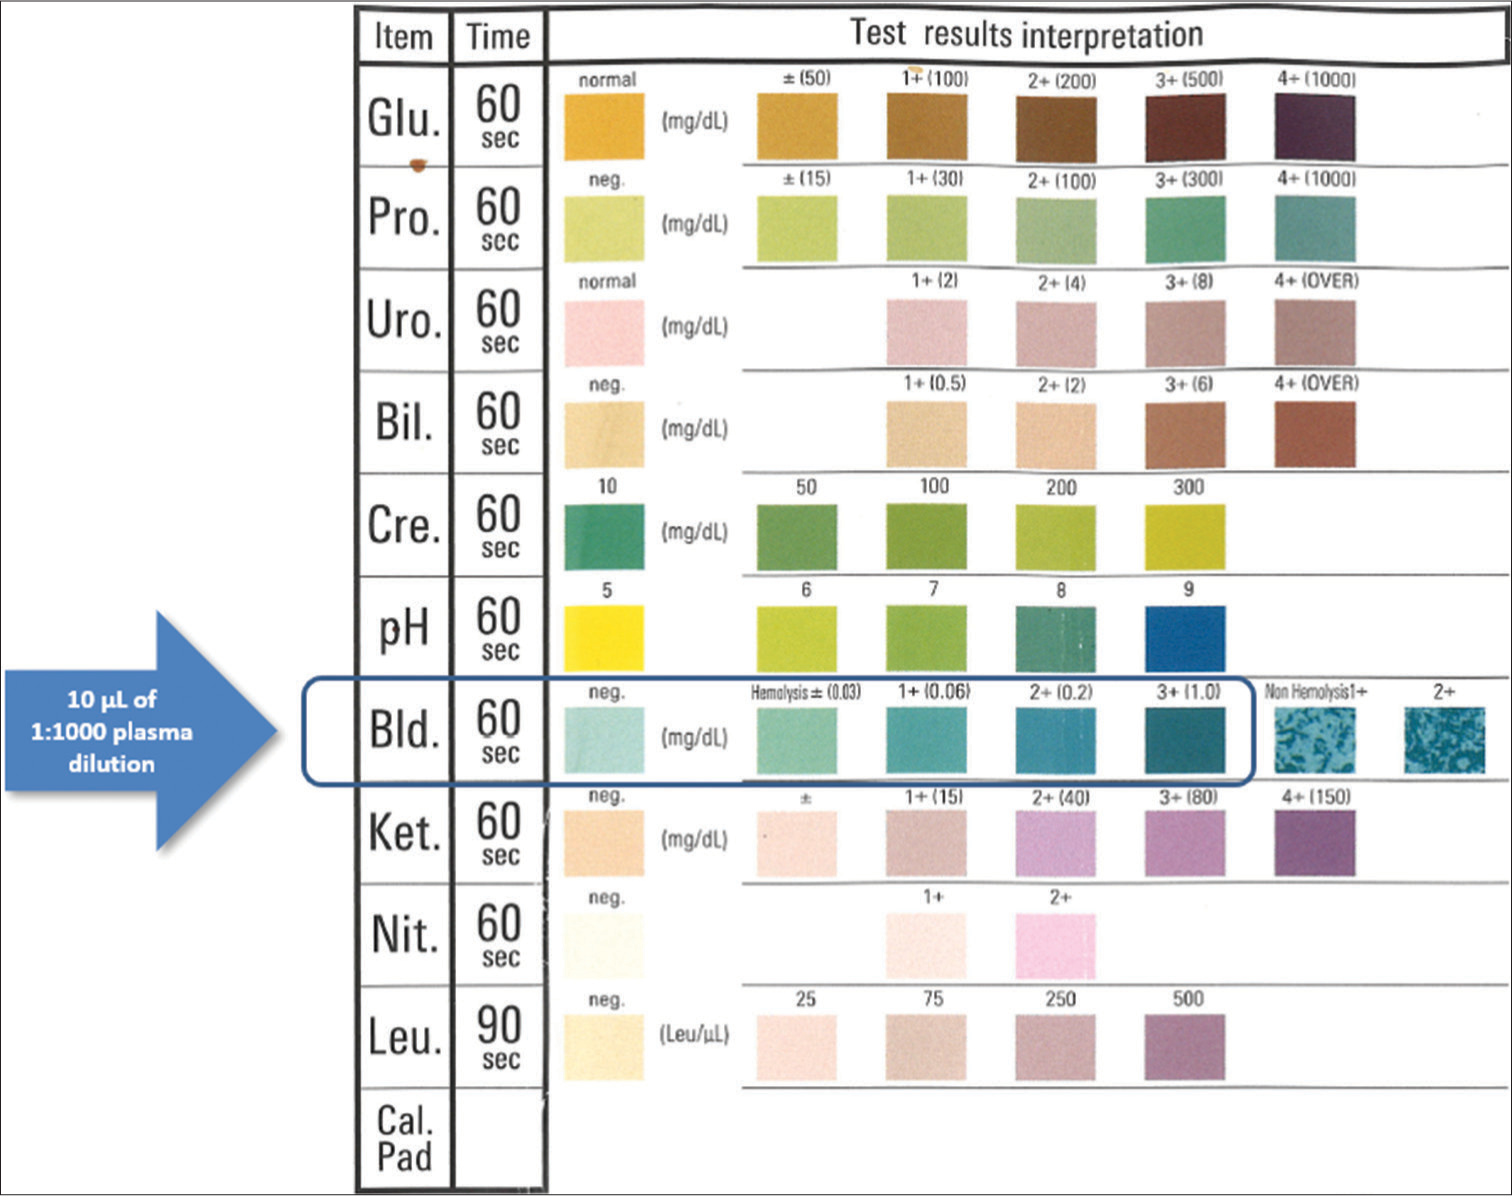
- Picture of the commercial urine dipstick used for assaying plasma hemoglobin concentration. Glu: glucose; Pro: proteins; Uro: urobilinogen; Bil: bilirubin; Cre: creatinine; ph: pH; Bld: direct bilirubin; Ket: ketones; Nit: nitrates; Leu: leukocytes; Cal.Pad: calibration pad.
Test results were reported as median and interquartile range (IQR). Semi-quantitative test results obtained with the urine dipstick were directly correlated with those of the same samples assayed on Roche Cobas 8000 using non-parametric Spearman’s correlation. Concordance on categories of plasma hemoglobin values between the two techniques was also assessed within the following ranges: ≤0.3 g/L (non-hemolyzed), 0.3–0.99 g/L (mildly hemolyzed), 1.0–3.0 g/L (significantly hemolyzed), and >3.0 g/L (grossly hemolyzed).[8] Statistical analysis was performed using Analyse-it (Analyse-it Software Ltd, Leeds, UK). The study was performed on anonymized patient samples after routine testing was completed, such that informed consent was unnecessary. The study was conducted in accordance with the Declaration of Helsinki, according to the relevant local legislation, and was approved by the Ethics Committee of the University Hospital of Verona (970CESC; July 20, 2016).
RESULTS
The Cobas HI values in non-hemolyzed (n = 40) and hemolyzed (n = 25) samples were 0.06 (IQR, 0.03–0.08) g/L and 0.74 (IQR, 0.43–1.11) g/L, respectively. The semi-quantitative distribution of dipstick hemoglobin values was as follows: “negative” or “±:” 37 samples; “1+:” 12 samples; “2+:” 9 samples, and “3+:” 7 samples, respectively. The Spearman’s correlation between Cobas HI and dipstick hemoglobin concentration is shown in Figure 2, yielding to r = 0.96 (95% confidence interval [CI], 0.93–0.97; P < 0.001). The concordance of hemolysis detection (i.e., plasma hemoglobin >0.3 g/L) between Cobas HI and urine dipstick was 95.4% (kappa statistics, 0.90; 95% CI, 0.80–1.01; P < 0.001) [Table 1]. Accordingly, the urine dipstick displayed 1.00 (95% CI, 0.86–1.00) sensitivity, 0.93 (95% CI, 0.80–0.98) specificity, 1.00 (95% CI, 0.91–1.00) negative predictive value, and 0.89 (95% CI, 0.74–0.96) positive predictive value for detecting plasma hemolysis compared to the reference HI measurement on Cobas. The cumulative agreement between Cobas HI and urine dipstick at the different plasma hemoglobin thresholds of ≤0.3 g/L, 0.3–0.99 g/L, 1.0–3.0 g/L, and >3.0 g/L was 75.4% (kappa statistics, 0.58; 95% CI, 0.44–0.72; P < 0.001).
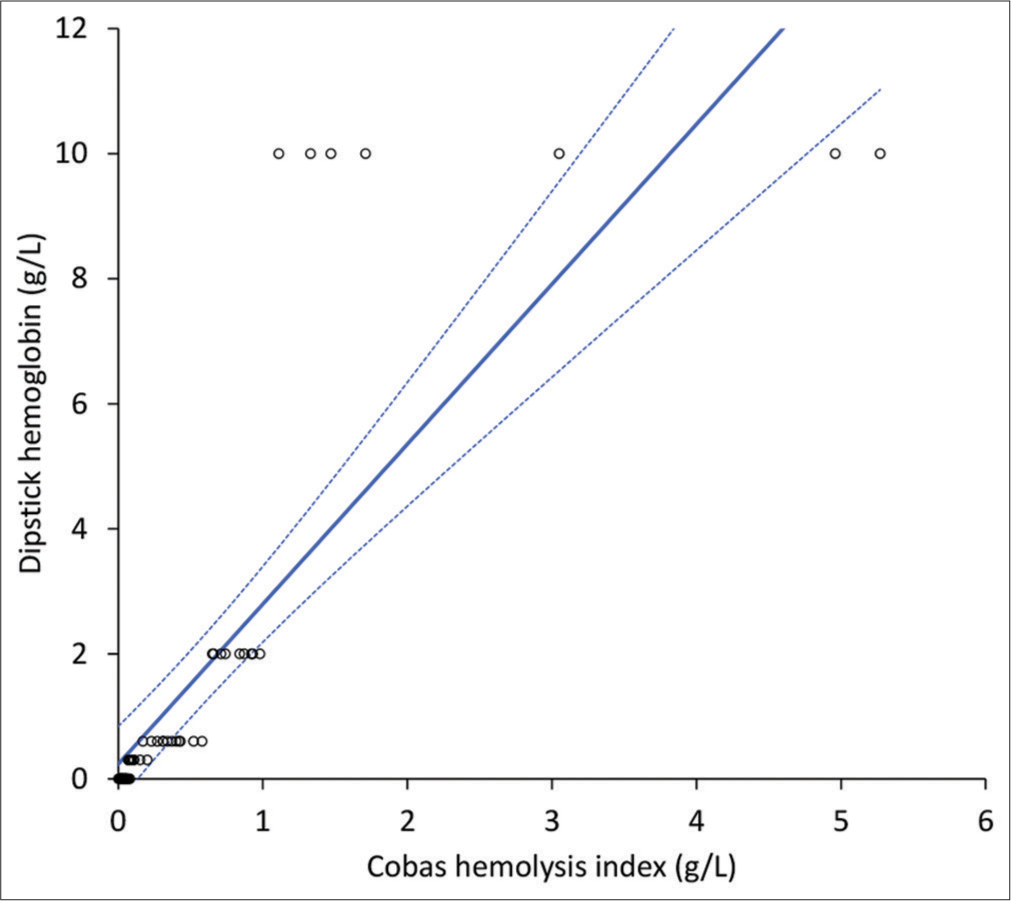
- Spearman’s correlation of plasma quantified by a commercially available urine dipstick and the hemolysis index measured with Roche Cobas 8000.
| Cobas hemolysis index | Dipstick | ||
|---|---|---|---|
| ≤0.3 g/L | >0.3 g/L | Total | |
| ≤0.3 g/L | 37 | 3 | 40 |
| >0.3 g/L | 0 | 25 | 25 |
| Total | 37 | 28 | 65 |
DISCUSSION
The identification and management of hemolyzed specimens represents one of the most critical steps in laboratory diagnostics since the presence of cell-free hemoglobin in serum or plasma can trigger a variety of biological, chemical, and analytical interferences that can ultimately compromise the quality of test results for many analytes.[9] The clear interference of hemolysis with various clinical chemistry[12] and hemostasis[2] parameters has led most manufacturers of laboratory analyzers to equip their instrumentation with the so-called HIL check, which is an automatic, accurate and nearly inexpensive means of detecting and quantifying cell-free hemoglobin in the test sample that compensates for the inherent limitations of visual sample control. With the exception of analyzers that do not have this important technological advance but are integrated into a system of partial or total laboratory automation where other preanalytical or analytical modules can perform HIL control, the unique means of identifying sample hemolysis for a wide range of laboratory tests (i.e., those performed using a stand-alone immunochemical platform, semiautomated or even manual ELISA, and so forth),[13,14] remains visual identification, which is fraught with a number of well-known drawbacks (imprecision, inaccuracy, inter-user variability, need to identify and adopt a validated benchmark, impossibility to store the extent of inference in the LIS, etc.). Therefore, any objective means that can support the identification and quantification of hemolysis in routine practice (even if a semi-quantitative approach is used) should be welcomed.[15]
This is precisely why we planned this proof-of-concept study to determine whether the widely available and largely inexpensive urine test strips can be a potentially valuable tool for detecting and quantifying hemolysis in plasma or serum samples. The results of our study are consistent with this premise, as we have shown that semi-quantitative hemolysis assessment by this approach provides data that are consistent with those obtained from the HI performed with a fully automated clinical chemistry analyzer. In particular, the urine dipstick at the routine plasma dilution of 1:1000 showed a very high correlation (r = 0.96), associated with an accuracy of 95%, a sensitivity of 1.00, and a specificity of 0.93 for identifying hemolyzed samples. Satisfactory performance was also observed in categorizing samples according to their degree of hemolysis, resulting in a cumulative accuracy of 75%. Notably, we decided to dilute the plasma in water rather than in a specific buffer because the use of a buffer can be potentially misleading and impractical for two main reasons. First, different analyzers and even assays use their own buffers so that diluting the plasma in a particular buffer may generate some interference with other assays when other tests are requested. Second, the use of water is cheap, requires no preparation, and is widely available.
CONCLUSIONS
The results of our study suggest that the assessment of plasma hemoglobin using a commercially available urine dipstick can yield semi-quantitative test results that are accurate enough to inform the decision-making regarding sample quality and its eventual suitability for testing. This approach could also be used to obtain information about the potential extent of in vivo hemolysis in patients with a variety of hemolytic anemias when more accurate practices for measuring cell-free hemoglobin are unavailable.
Ethical approval
The study was approved by the Ethics Committee of the University Hospital of Verona (970CESC; July 20, 2016).
Declaration of patient consent
The authors certify that they have obtained all appropriate patient consent.
Conflicts of interest
There are no conflicts of interest.
Use of artificial intelligence (AI)-assisted technology for manuscript preparation
The authors confirm that there was no use of artificial intelligence (AI)-assisted technology for assisting in the writing or editing of the manuscript and no images were manipulated using AI.
Financial support and sponsorship
Nil.
References
- Systematic assessment of the hemolysis index: Pros and cons. Adv Clin Chem. 2015;71:157-70.
- [CrossRef] [PubMed] [Google Scholar]
- Interference in coagulation testing: Focus on spurious hemolysis, icterus, and lipemia. Semin Thromb Hemost. 2013;39:258-66.
- [CrossRef] [PubMed] [Google Scholar]
- Managing hemolyzed samples in clinical laboratories. Crit Rev Clin Lab Sci. 2020;57:1-21.
- [CrossRef] [PubMed] [Google Scholar]
- European survey on preanalytical sample handling-Part 2: Practices of European laboratories on monitoring and processing haemolytic, icteric and lipemic samples. On behalf of the European Federation of Clinical Chemistry and Laboratory Medicine (EFLM) Working Group for the Preanalytical Phase (WG-PRE) Biochem Med (Zagreb). 2019;29:20705.
- [CrossRef] [Google Scholar]
- Clinical laboratory quality practices when hemolysis occurs. Arch Pathol Lab Med. 2015;139:901-6.
- [CrossRef] [PubMed] [Google Scholar]
- Practical recommendations for managing hemolyzed samples in clinical chemistry testing. Clin Chem Lab Med. 2018;56:718-27.
- [CrossRef] [PubMed] [Google Scholar]
- Defining a roadmap for harmonizing quality indicators in Laboratory Medicine: A consensus statement on behalf of the IFCC Working Group “Laboratory Error and Patient Safety” and EFLM Task and Finish Group “Performance specifications for the extra-analytical phases”. Clin Chem Lab Med. 2017;55:1478-88.
- [CrossRef] [PubMed] [Google Scholar]
- Visual assessment of sample quality: Quo usque tandem? Clin Chem Lab Med. 2018;56:513-5.
- [CrossRef] [PubMed] [Google Scholar]
- Hemolyzed specimens: A major challenge for emergency departments and clinical laboratories. Crit Rev Clin Lab Sci. 2011;48:143-53.
- [CrossRef] [PubMed] [Google Scholar]
- Internal quality assurance of HIL indices on Roche Cobas c702. PLoS One. 2018;13:e0200088.
- [CrossRef] [PubMed] [Google Scholar]
- Evaluation of aution max AX-4030 and 9UB uriflet, 10PA aution sticks urine dipsticks in the automated urine test strip analysis. Clin Chem Lab Med. 2011;50:139-46.
- [CrossRef] [PubMed] [Google Scholar]
- Systematical assessment of serum indices does not impair efficiency of clinical chemistry testing: A multicenter study. Clin Biochem. 2013;46:1281-4.
- [CrossRef] [PubMed] [Google Scholar]
- Enzyme linked immunosorbent assay In: StatPearls. Treasure Island, FL: StatPearls Publishing; 2023. Available from: https://www.ncbi.nlm.nih.gov/books/NBK555922 [Last accessed on 2023 Dec 13]
- [Google Scholar]
- Haemolysis index for the screening of intravascular haemolysis: A novel diagnostic opportunity? Blood Transfus. 2018;16:433-7.
- [Google Scholar]


