
Translate this page into:
Hemolysis area: A new parameter of erythrocyte osmotic fragility for screening of thalassemia trait
Address for correspondence: Dr. Thanusak Tatu, Division of Clinical Microscopy, Department of Medical Technology, Research Center for Hematology and Health Technology, Faculty of Associated Medical Sciences, Chiang Mai University, Chiang Mai 50200 Thailand. E-mail: tthanu@hotmail.com
-
Received: ,
Accepted: ,
This is an open access article distributed under the terms of the Creative Commons Attribution-NonCommercial-ShareAlike 3.0 License, which allows others to remix, tweak, and build upon the work non-commercially, as long as the author is credited and the new creations are licensed under the identical terms.
This article was originally published by Medknow Publications & Media Pvt Ltd and was migrated to Scientific Scholar after the change of Publisher.
Abstract
BACKGROUND:
One-tube osmotic fragility test (OFT) is widely used for screening thalassemia traits. Interobserver variation may occur with 0.36% NaCl-based OFT due to the naked eye result reading style.
PURPOSE:
The purpose of this study was to establish and evaluate the novel numerical OFT-based parameter, so-called hemolysis area (HA), in screening thalassemia traits.
MATERIALS AND METHODS:
The portable spectrophotometer was invented capable of calculating the HA values. The HA values were then compared among 69, 156, and 19 blood samples having positive, negative, and suspicious 0.36% NaCl-based OFT results, respectively; 109 and 135 blood samples having mean corpuscular volume (MCV) ≤80 fL and >80 fL, respectively; and 138 and 106 blood samples having mean corpuscular hemoglobin (MCH) ≤27 pg and >27 pg, respectively. In addition, the HA values were compared in 166 blood samples having different globin gene genotypes. Finally, the HA cutoff value was determined by receiver operation curve (ROC) analysis.
RESULTS:
The HA values in samples having positive, suspicious, and negative 0.36% NaCl-based OFT were 33.3 ± 14.4, 42.9 ± 10.5, and 65.3 ± 13.4, respectively; in sample having MCV ≤80 fL and >80 fL were 43.1 ± 19.6 and 63.8 ± 14.5, respectively; and in samples having MCH ≤27 pg and >27 pg were 46.7 ± 20.1 and 64.8 ± 14.2, respectively. The HA values in normal, hemoglobin E, SEA-α thalassemia 1, and β-thalassemia traits were 67.1 ± 12.6, 36.4 ± 13.9, 20.2 ± 4.8, and 18.6 ± 1.1, respectively. All were significantly different. ROC analysis established 52.4 as the HA cutoff that had comparable effectiveness to the conventional screening tests.
CONCLUSION:
The new HA value was effective and could be an alternative choice for screening thalassemia traits.
Keywords
Hemolysis
kinetics
osmotic fragility test
thalassemia heterozygote
thalassemia screen

Introduction
Thalassemia is a chronic hemolytic anemia resulting from defects of globin genes that lead to decreased or absent globin chain production. This disease is highly epidemic in the Mediterranean and tropical countries including Thailand.[123] The thalassemia genes are inherited as autosomal recessive traits. Thus, those heterozygous for the thalassemia gene are clinically asymptomatic.[4] The homozygote or compound heterozygote of the thalassemia gene may die in utero (hemoglobin [Hb] Bart's hydrops fetalis) or require frequent blood transfusions to maintain good quality of life (severe β-thalassemia and severe HbE/β-thalassemia). Thus, early detection of thalassemia heterozygous is necessary.
One-tube osmotic fragility test (OFT) is the simple test widely used in screening thalassemia heterozygotes or thalassemia traits. Traditional OFT utilizing 0.36% NaCl is simple and easy to perform. However, reading the results of this OFT is generally based on naked eye visualization which may be prone to interobserver variation.[56] The kinetic-based OFT technique that generates numerical percentage of hemolysis was developed to overcome this problem.[7] However, this technique relied on benchtop spectrophotometer which prevented it from field use. Thus, the portable spectrophotometer that generated a novel hemolysis parameter so-called hemolysis area (HA) was invented and evaluated in this report.
Materials and Methods
The novel portable spectrophotometer with built-in data analysis capacity
The portable spectrophotometer with touchscreen control was in-house invented in a laboratory of the Department of Physics and Materials Science, Faculty of Science, Chiang Mai University. It used a high-intensity narrow beam red light-emitting diode as source and a broadband photodiode to detect the light intensity about 2 cm from the round cuvette position to enhance scattering sensitivity. The system used pulsed light with phase-sensitive detection to remove external light influence. An Atmel Atmega128 at 16 MHz was used as the microcontroller and an ET-TFT240320TP-3.2 used for the touchscreen. Data were recorded at one-second intervals and displayed on screen.
The instrument measured the turbidity of the red cell suspension in 0.45% glycerin saline solution (GSS)[78] inside the plastic cuvette. A decrease of turbidity led to a decrease in optical density (OD) and an increase in the light transmission (%T) that was detected by the detector. Changes of the OD, %T, and hemolysis (as HmFr) were plotted simultaneously in real-time mode and shown on the screen [Figure 1]. At 120 s, the HA, expressed as HemeArea by the machine, was calculated and also shown on the screen. This HA was, in fact, the result of summation of HmFr which was automatically calculated by the following equation: (OD0-OTt)/OD0, where OD0 and ODt represented the absorbance at 0 and 1–120 s, respectively.
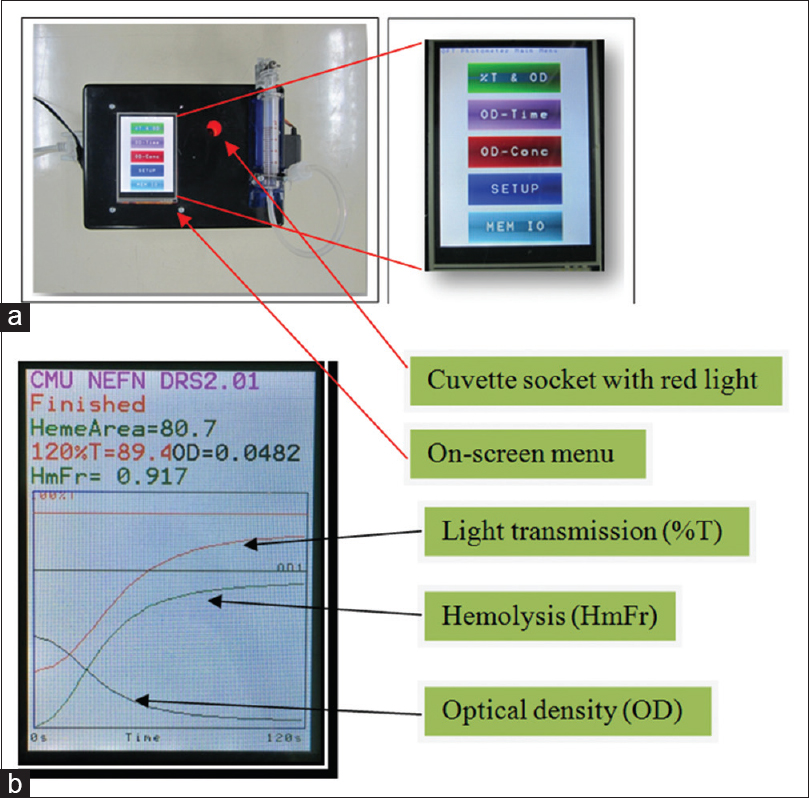
- The newly invented portable spectrophotometer and the on-screen menu (a) as well as the on-screen test result (b) showing changes of light transmission (%T), optical density, and hemolysis (HmFr) of the tested sample. The numerical results are also shown at the top of the screen in panel B. HmFr = (OD0–ODt)/OD0 where OD0 was OD at 0 s and ODt was OD at 1st–120th s). HemeArea or hemolysis area = ΣHmFr taken at 1 s interval for 120 s. (Note: HmFr (120) could also be used as an osmotic fragility test selection parameter, similar to benchtop.)
Practically, after switching on the machine, the machine was set up to zero OD using distilled water and zero %T using black ink under the “SETUP” menu on the screen. Then, under the OD-TIME menu, mixture of 20 μL ethylenediaminetetraacetic acid (EDTA) blood and 5 mL of 0.45% GSS was immediately put (within 10 s) into the cuvette socket and “START” submenu of the OD-TIME menu simultaneously pressed. The real-time plot appeared until 120 s before an on-screen reporting of the “HemeArea or Hemolysis Area; HA” appeared [Figure 1].
Blood samples
Initially, 244 EDTA blood samples were randomly collected to determine the HA values among blood samples having positive, suspicious, and negative 0.36% NaCl-based OFT results, having the mean corpuscular volume (MCV) ≤80 fL and >80 fL, and having mean corpuscular hemoglobin (MCH) ≤27 pg and >27 pg. Next, 166 EDTA blood samples were collected for determination of the HA values in thalassemia traits having different globin gene genotypes and ROC analysis. The protocol of this study strictly followed the Declaration of Helsinki and was approved by the Institutional Research Ethics Committee.
One-tube osmotic fragility test
The conventional 0.36% NaCl-based OFT was performed with some modification.[9] Briefly, 15 μL of EDTA blood was mixed with 2 mL of 0.36% NaCl. Thereafter, the mixture was incubated at room temperature for 5 min before naked eye visualization of the results. If reddish-turbid suspension was seen, the result was positive. If reddish-clear solution was seen, the result was negative. However, if the appearance of the red cell suspension was between positive and negative results, it was reported as suspicious [Figure 2].

- Appearance of the 0.36% NaCl-based osmotic fragility test results as visualized by naked eyes. The result is written under each tube in which the reddish-turbid RBC suspension is reported as positive, reddish-clear red blood cell solution as negative. The tube with RBC suspension having the appearance between positive and negative result is reported as suspicious
Determination of mean corpuscular volume and mean corpuscular hemoglobin
The MCV and MCH values were determined by an electronic blood cell counter (Sysmex KX21, Sysmex Corporation, Kobe, Japan) following manufacturer's instruction. Cutoff values for MCV and MCH were 80 fL and 27 pg, respectively.[1011] The MCV values of ≤80 fL and MCH of ≤27 pg were classified as positive results.
Determination hemoglobin E trait and identification of SEA-α thalassemia 1 and β-globin gene mutations
HbE trait was identified by the cellulose acetate electrophoresis at alkaline condition in which Hb type was shown to be AE.[1213] The SEA-α thalassemia 1 deletion and β-thalassemia mutations including βE, β17(A-T) and β41/42(-TTCT) were identified by the multiplex allele-specific polymerase chain reaction (PCR) described previously.[14]
Determination and evaluation of cutoff points of “hemolysis area”
Cutoff points of the HA values were determined by ROC analysis based on the definite diagnosis established by the standard method of cold alkaline extraction at alkaline condition, Gap-PCR, and allele-specific PCR described above. The area under the curve above 0.6 was considered significant for accurately determining the cutoff points.[15] Sensitivity, specificity, positive predictive value (PPV), negative predictive value (NPV), and efficiency of the HA cutoff value in screening thalassemia traits including HbE, SEA-α thalassemia 1, and β-heterozygotes were compared with those obtained from the conventional 0.36% NaCl-based OFT, MCV, and MCH.
Statistical analysis
Mean and standard deviation (SD) were computed to describe the analyzed data. Student's t-test and Pearson's correlation coefficient analysis were performed to compare mean and to correlate to analyzed data. All the statistical calculations were performed using statistical software. Statistical significance was considered if P < 0.001.
Results
Hematologic pictures of the initial 244 tested samples
Hematologic parameters (mean ± SD) including Hb, Hct, MCV, MCH and HA in 244 initial tested EDTA blood samples were 12.8 ± 1.4 g/dL, 39.3% ±4.1%, 80.1 ± 7.9 fL, 26.2 ± 3.0 pg and 54.6 ± 19.9 units, respectively. Sixty-nine (28.3%) blood samples had positive OFT result while 156 (63.9%) and 19 (7.8%) blood samples had negative OFT and suspicious OFT results, respectively. A hundred and nine (44.7%) blood samples had MCV ≤80 fL while 135 (55.3%) blood samples had MCV >80 fL. Finally, MCH values ≤27 pg and >27 pg were seen in 138 (56.6%) and 106 (43.4%) blood samples, respectively.
Hemolysis area in samples having different mean corpuscular volume, mean corpuscular hemoglobin, and osmotic fragility test results
Analysis of HA and MCV showed that the HA values correlated significantly with the MCV values (r = 0.65, P < 0.001). When samples were grouped by the MCV values, ≤80 fL and >80 fL, the HA values in the first group was significantly lower than the second one (43.1 ± 19.6 vs. 63.8 ± 14.5, P < 0.001) [Figure 3].

- Relationship of hemolysis area and mean corpuscular volume values (a) and comparison of hemolysis area values in blood samples having mean corpuscular volume >80 fL and ≤80 fL (b). Mean values are placed at the middle of each error bar. “Sig.” indicates statistically significant difference after Student's t-test analysis
The HA values also positively and significantly correlated with the MCH (r = 0.65, P < 0.001). Those samples having MCH ≤27 pg had significantly lower levels of HA than the samples having MCH >27 pg (46.7 ± 20.1 vs. 64.8 ± 14.2, P < 0.001) [Figure 4].
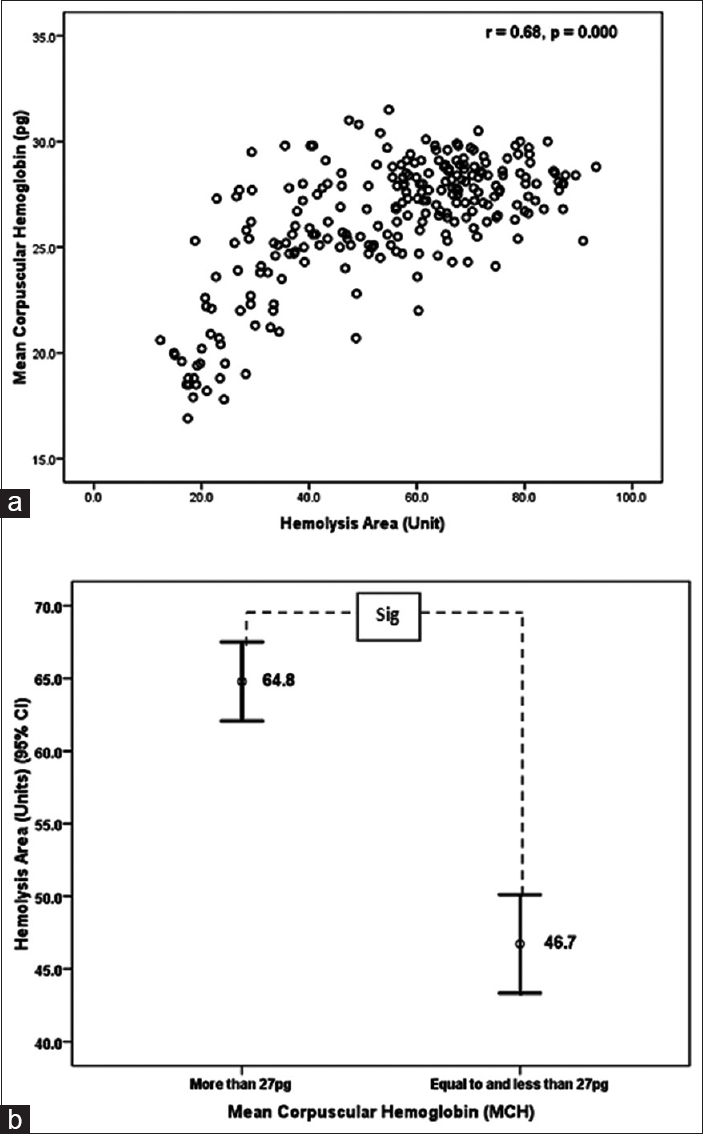
- Relationship of hemolysis area and mean corpuscular hemoglobin values (a) and comparison of hemolysis area values in samples having mean corpuscular hemoglobin >27 pg and ≤27 pg (b). Mean values are placed at the middle of each error bar. “Sig.” indicates statistically significant difference after Student's t-test analysis
The HA values in blood samples having different OFT results were also heterogeneous. Blood samples having positive OFT results had the smallest HA values (33.3 ± 14.4) while blood samples having negative OFT results had the largest HA values (65.3 ± 13.4). In addition, blood samples having suspicious OFT results had the HA value of 42.9 ± 10.5. All these HA values were significantly different [Figure 5].

- Comparison of hemolysis area values in samples having positive, negative, and suspicious 0.36% NaCl-based osmotic fragility test results. Mean values are placed at the middle of each error bar. “Sig.” indicates statistically significant difference after Student's t-test analysis. Note that hemolysis area values in osmotic fragility test-negative group are much higher than those in osmotic fragility test-positive and osmotic fragility test-negative groups
The hemolysis area values in samples having different thalassemia genotypes
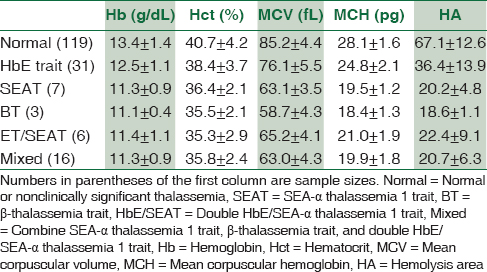
One hundred and sixty-six blood samples including normal individuals, HbE trait [βE/βA], SEA-α thalassemia 1 trait (--SEA/αα), β-thalassemia trait (β17/βA, β41/42/βA), and double HbE/SEA-α thalassemia 1 traits (βE/βA and --SEA/αα) were recruited to determine and compare the HA values. All samples were not anemic as indicated by high Hb/Hct levels, and MCV and MCH levels were unique for each type of thalassemia as shown in Table 1.[1216] The HA value of each thalassemia genotype is also shown in Table 1. Initial comparison of the HA values showed that the HA values in normal samples were significantly higher than those in HbE trait (P < 0.001), which also were significantly higher than those in SEA-α thalassemia 1, β-thalassemia, and double HbE/SEA-α thalassemia 1 traits. The HA values in the SEA-α thalassemia 1, β-thalassemia, and double HbE/SEA-α thalassemia 1 traits were statistically identical (P > 0.001) [Figure 6].
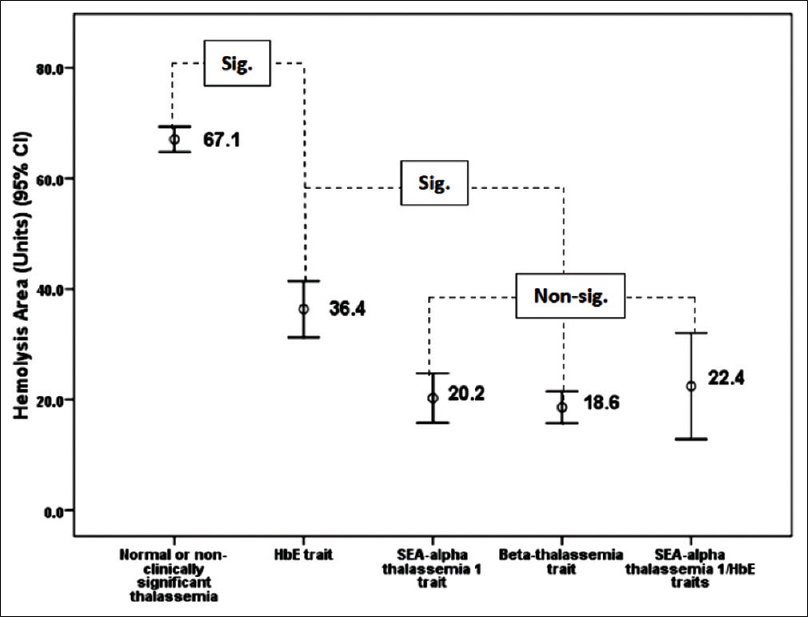
- Comparison of hemolysis area values among blood samples having different thalassemia mutations. Mean values are placed at the middle of each error bar. “Sig.” and “Nonsig” indicate statistically significant and nonsignificant difference, respectively, after Student's t-test analysis
Determination and evaluation of cutoff value of “hemolysis area”
It was clearly shown in previous section that the HA values were different among normal and thalassemia traits. The cutoff value of HA to differentiate between normal and thalassemia trait was then determined by the ROC analysis. The cutoff point was found to be 52.4, which had sensitivity of 0.908 and specificity of 0.915 [Figure 7]. Normal individuals had the HA value of more than or equal to 52.4 while the thalassemia traits had the HA value of <52.4.

- Receiver operation curve for determination of cutoff values of hemolysis area that will be used to screen thalassemia trait from normal or nonclinically significant thalassemia. The point where the hemolysis area cutoff value of 52.4 unit is placed is arrowed. Area under curve stands for area under curve
The capacity of the newly established HA cutoff point in screening thalassemia traits was found to be comparable to that of the conventional 0.36% NaCl-based OFT, MCV, and MCH [Table 2]. The 52.4 cutoff point of the HA value was capable to clearly classified blood samples having negative 0.36% NaCl-based OFT results from blood samples having positive and suspicious 0.36% NaCl-based OFT results [Figure 8]. Moreover, the blood samples having discordant results obtained 0.36% NaCl-based OFT; for example, HbE trait [“E” in Figure 8] having negative 0.36% NaCl-based OFT result, SEA-a thalassemia 1 trait, and double SEA-a thalassemia 1 trait [“SEA” and “SEA/E” in Figure 8, respectively] having suspicious 0.36% NaCl-based OFT result clearly had the HA values <52.4 cutoff point.

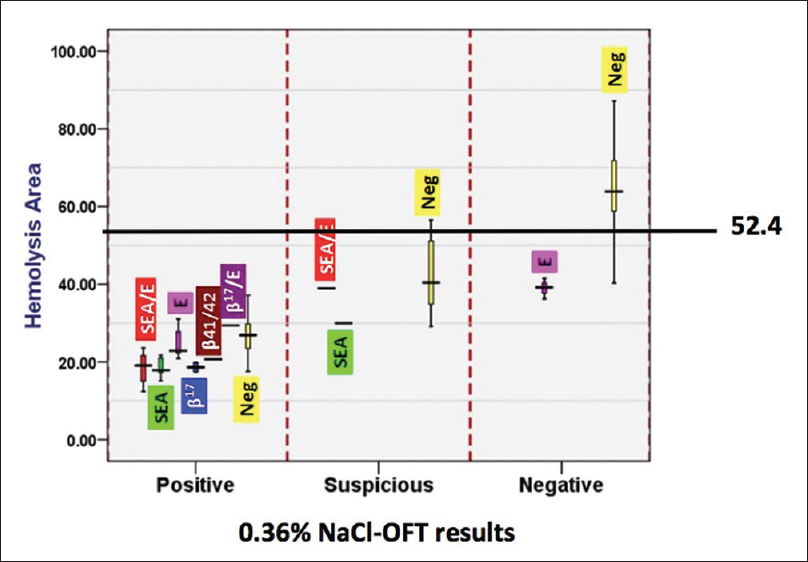
- The hemolysis area values and results of 0.36% NaCl-based osmotic fragility test in blood samples having different thalassemia genotypes. The data were presented in box plots with a line of 52.4 cutoff point drawn. The full descriptions of “SEA,” “b41/41,” “b17,” “E,” and “neg” can be seen in the text. Note that thalassemia trait with positive and suspicious 0.36% NaCl-based osmotic fragility test results all had the hemolysis area values of <52.4
Most importantly, using 52.4 cutoff point, the large proportion of the HbE trait was screened in compared to the conventional 0.36% NaCl-based OFT as shown in Table 3.

Discussion
Thalassemia traits can only be detected by the laboratory investigations as they have no obvious clinical symptoms. One-tube OFT is the screening test for thalassemia traits that is widely employed in many thalassemia-rich countries. At present, two salt solutions are used for OFT, including 0.36% NaCl solution[5917] and 0.45% GSS.[718] The 0.36% NaCl-based OFT requires naked eye visualization for result reading whereas numerical data of hemolysis (% hemolysis) are generated in the 0.45% GSS-based OFT. The later method can overcome the interobserver variation which is common in the former 0.36% NaCl-based OFT method. However, this test cannot be performed in fieldwork since it needs benchtop spectrophotometer to measure change of OD for calculating the “% hemolysis.” The portable spectrophotometer with the built-in capacity of calculating the new parameter of HA invented in this study overcomes the aforementioned obstacles.
This portable spectrophotometer was 20 cm × 13 cm × 8 cm in dimension, weighing only 0.5 kg. Thus, it can be carried to the field site where thalassemia screen is usually performed. The HA was calculated at 120 s for each sample. This hence made the new platform able to swiftly screen the thalassemia trait in the field work.
The samples having positive/suspicious OFT, MCV ≤80 fL, and MCH ≤27 pg had significantly lower HA values than those having negative OFT, MCV >80 fL, and MCH >27 pg. This was as expected as low HA values indicated decreased rate of hemolysis. The decreased rate of hemolysis and small and less hemoglobinized red blood cell are observed in all types of severe thalassemia heterozygote as indicated by positive OFT, low MCV, and low MCH values, respectively.[5917192021] This result thus confirmed the ability of the HA values in effective screening the thalassemia traits. However, the HA values might not correlate with MCV/MCH values in sickle cell trait or in some samples having dimorphic erythrocytes. In the sickle cell trait, although the osmotic fragility of red blood cells is reduced, i.e., positive OFT test, the MCV tends to be within normal range.[52223] Moreover, dimorphic red blood cells possessing a mixture of microcytic and normal red blood cells may be seen in the early phase of iron depletion and position treatment of iron deficiency anemia.[24] The red blood cells in these conditions tend to have normal MCV value while the osmotic fragility is decreased. Therefore, in situation, where the HA values and MCV/MCH values do not agree, these conditions must be concerned.
Cutoff value is essential for the HA-based OFT and ROC analysis established the cutoff value of 52.4. Those samples having HA ≤52.4 and >52.4 were interpreted as positive and negative for the test, respectively. Comparable sensitivity, specificity, PPV, NPV, and efficiency of HA-based OFT to those of conventional 0.36% NaCl-based OFT, MCV, and MCH as shown in Table 3 should indicate that the HA-based OFT can also be used in thalassemia screen.[91121] Analysis in detail as shown in Figure 8 demonstrated that the 52.4 cutoff of HA value was superior to the conventional 0.36% NaCl-based OFT in screening for thalassemia traits. This was because all the thalassemia trait having negative and suspicious OFT results had the HA values <52.4 cutoff points. However, some samples having negative PCR results had the HA value <52.4 cutoff point as shown in Figure 8. This can be simply explained by the fact that the PCR protocol used in this study was set up to detect only the SEA type of a-thalassemia 1 [“SEA” in Figure 8], TTCT-deletion at CDs 41/42 of β-globin gene (“β41/42” in Figure 8), A-T substitution at CD17 of the β-globin gene [“β17” in Figure 8], and G-A substitution at CD26 of the β-globin gene or HbE [“E” in Figure 8]. Thus, those blood samples having negative PCR results might have other to be elucidated thalassemia genotypes.
This HA value is closed to 60% hemolysis cutoff originally set for 0.45% GSS-based OFT.[8] Sensitivity, specificity, PPV, and NPV of the HA-based OFT in detecting thalassemia traits were 91.5%, 90.8%, 79.6%, and 96.4%, respectively, compared to 97.6%, 72.9%, 33.6%, and 99.5% by the original 0.45% GSS-based OFT.[18] Although the HA-based OFT had lower sensitivity than the original 0.45% GSS-based OFT, it had higher specificity and PPV than the original test. This meant that the HA-based OFT was more effective in detecting thalassemia heterozygote than the original test.
The 0.36% NaCl-based OFT and red cell indices can generate falsely negative result for HbE trait. In the study of Kattamis et al., 32% of HbE trait had falsely negative 0.36% NaCl-based OFT results.[5] A resembling result was also observed in this study in which 25% of the HbE heterozygote had negative result of 0.36% NaCl-based OFT. More importantly, the HA-based OFT demonstrated only 11.1% falsely negative results for HbE trait. This result should indicate that the HA-based OFT was more efficient in screening HbE trait than the original 0.36% NaCl-based OFT.
Conclusion
The novel platform of one-tube OFT for thalassemia screen was established relying on the use of new parameter so-called HA. The HA generated by the newly invented portable spectrophotometer with the cutoff point of 52.4 was effective in screening thalassemia traits. This new platform could then be an alternative option of thalassemia screen in thalassemia-rich nations.
Financial support and sponsorship
Nil.
Conflicts of interest
There are no conflicts of interest.
References
- The population genetics of the haemoglobinopathies. In: Rodgers GP, ed. Bailliere's Clinical Haematology, International Practice and Research: Sickle Cell Disease and Thalassaemia. Vol 11. London: Bailliere Tindall; 1998. p. :1-51.
- [Google Scholar]
- Molecular epidemiology of the thalassaemias (including haemoglobin E) Baillieres Clin Haematol. 1992;5:209-38.
- [Google Scholar]
- Phenotype-genotype relationships in monogenic disease: Lessons from the thalassaemias. Nat Rev Genet. 2001;2:245-55.
- [Google Scholar]
- Effectiveness of one tube osmotic fragility screening in detecting beta-thalassaemia trait. J Med Genet. 1981;18:266-70.
- [Google Scholar]
- NESTROFT as a screening test for the detection of thalassaemia & common haemoglobinopathies – An evaluation against a high performance liquid chromatographic method. Indian J Med Res. 1996;104:194-7.
- [Google Scholar]
- Screening for alpha-thalassemia-1 heterozygotes in expecting couples by the combination of a simple erythrocyte osmotic fragility test and a PCR-based method. Community Genet. 1999;2:26-9.
- [Google Scholar]
- Screening for the carriers of thalassemias and abnormal hemoglobins at the community level. Southeast Asian J Trop Med Public Health. 2002;33(Suppl 2):145-50.
- [Google Scholar]
- Diagnosis and management of thalassemia: Avoidance and population control. In: Weatherall DJ, Clegg JB, eds. The Thalassemia Syndrome (4th ed). Milan: Rotolito Lombarda SpA; 2001. p. :597-629.
- [Google Scholar]
- Sensitivity and specificity of mean corpuscular volume testing for screening for alpha-thalassemia-1 and beta-thalassemia traits. J Obstet Gynaecol Res. 2005;31:198-201.
- [Google Scholar]
- Weatherall DJ, ed. The Thalassemia. New York: Churchill Livingstone; 1983.
- Screening for co-existence of α-thalassemia in β-thalassemia and in HbE heterozygotes via an enzyme-linked immunosorbent assay for Hb Bart's and embryonic ζ-globin chain. Int J Hematol. 2012;95:386-93.
- [Google Scholar]
- Receiver operating characteristic (ROC) curve: Practical review for radiologists. Korean J Radiol. 2004;5:11-8.
- [Google Scholar]
- The Thalassaemia Syndromes (4th ed). Oxford: Blackwell Scientific; 2001.
- Effectiveness of red cell osmotic fragility test with varying degrees of saline concentration in detecting beta-thalassaemia trait. Singapore Med J. 2008;49:823-6.
- [Google Scholar]
- Erythrocyte osmotic fragility test for screening of alpha-thalassemia-1 and beta-thalassemia trait in pregnancy. Int J Gynaecol Obstet. 2004;86:347-50.
- [Google Scholar]
- Evaluation of red cell mean corpuscular volume and simple tube red cell osmotic fragility quantitative test in detection of thalassemia. Zhonghua Fu Chan Ke Za Zhi. 2000;35:610-2.
- [Google Scholar]
- Efficiency of premarital screening of beta-thalassemia trait using MCH rather than MCV in the population of Fars Province, Iran. Haematologia (Budap). 2002;32:129-33.
- [Google Scholar]
- Sensitivity and specificity of mean corpuscular hemoglobin (MCH): For screening alpha-thalassemia-1 trait and beta-thalassemia trait. J Med Assoc Thai. 2009;92:739-43.
- [Google Scholar]
- Sickle cell trait increases red blood cell storage hemolysis and post-transfusion clearance in mice. EBioMedicine. 2016;11:239-48.
- [Google Scholar]
- Laboratory parameters provided by Advia 2120 analyser identify structural haemoglobinopathy carriers and discriminate between Hb S trait and Hb C trait. J Clin Pathol. 2016;69:912-20.
- [Google Scholar]
- The red cell histogram and the dimorphic red cell population. Lab Med. 2011;42:300-8.
- [Google Scholar]


