
Translate this page into:
Immunoexpression of CD34, CD117, and p53 in Hypocellular Bone Marrow Disorders
Address for correspondence: Manveen Kaur, MD, Department of Pathology, Government Medical College and hospital, Chandigarh, 160032, India (e-mail: docmanveen@gmail.com).
This article was originally published by Thieme Medical and Scientific Publishers Pvt. Ltd. and was migrated to Scientific Scholar after the change of Publisher.
Abstract
Objectives
Hypocellular bone marrow (BM) disorders comprise heterogeneous entities associated with peripheral cytopenias and decreased production of hematopoietic cells in BM. This study was undertaken to analyze immunohistochemical expression of CD34, CD117, and p53 in morphologically diagnosed patients of hypocellular BM (aplastic anemia [AA], hypocellular myelodysplastic syndrome [h-MDS], and hypocellular acute myeloid leukemia [h-AML]).
Materials and Methods
BM specimens were obtained from patients presenting with pancytopenia/bicytopenia. On 30 patients diagnosed as hypocellular BM, immunohistochemistry (IHC) for CD34, CD117, and p53 was performed.
Results
BM cellularity was < 30% in all (100%) patients. Blast count was increased in h-MDS and h-AML. Features of dysplasia were noted in six (20%) patients. Out of these, three patients were diagnosed as h-MDS having bilineage/trilineage dysplasia, and the other three patients were of AA (11.5% patients) displaying only dyserythropoiesis. On IHC, percentage of BM CD34+ cells was increased in h-MDS+ h-AML (3.87 ± 0.86) as compared with AA (0.19 ± 0.15) and controls (0.81 ± 0.21), p = 0.01. Percentage of BM p53+ cells was also increased in h-MDS+ h-AML (2.9 ± 2.07) as compared with AA and controls, which did not show any p53+ cells, p = 0.0. No statistically significant difference was observed in the expression of CD117 in h-MDS+ h-AML (4.95 ± 3.40) compared with AA (4.49 ± 1.07), p = 0.99.
Conclusion
The study demonstrates the usefulness of CD34 and p53 immunoexpression as an important ancillary method in distinguishing various hypocellular BM disorders, especially h-MDS and AA. However, the role of CD117 remains unclear and needs to be evaluated further by larger studies.
Keywords
aplastic anemia
hypocellular marrow
myelodysplastic syndrome
CD34
CD117
p53

Introduction
Hypocellular BM is defined as bone marrow cellularity less than 30% in patients 60 years or younger and less than 20% in patients over 60 years.[1] Common hematopoietic disorders that result in a hypocellular BM include aplastic anemia (AA), hypocellular myelodysplastic syndrome (h-MDS), hypocellular acute myeloid leukemia (h-AML), and paroxysmal nocturnal hemoglobinuria (PNH).[1,2] These diseases have a distinct underlying pathophysiology but are indistinguishable clinically as well as pathologically, especially in the early stages.[3,4] Differentiating between these disorders, particularly between AA and h-MDS, is a challenging task. The prognosis and treatment of these diseases are different.[2] The annual incidence of AA in India and other Asian countries is as high as 6 to 8 per million population.[5] There is a biphasic distribution with the first peak at 10 to 25 years and the second over 60 years. No significant difference has been observed in the incidence between males and females.[6-9] About one-third of the patients with AA may have a small PNH clone at diagnosis.[10] The incidence of h-MDS in India is not known.[11] Hypocellular MDS typically occurs in elderly people, after 60 years of age and children are least affected.[12,13]
Establishment of correct diagnosis in a patient of hypocellular BM is of utmost importance for institution of appropriate therapy. A few studies in the Western literature have determined the usefulness of immunohistochemical markers for differentiation of hypoplastic MDS from AA. Such studies evaluated expression of CD34, p53, TNF, RAB20, GFI1, and CD117.[14-16] However, discordant results were obtained in most of these studies. In Indian literature, the expression of immunohistochemical markers in hypocellular BM disorders has not been documented. Therefore, the present study was aimed to analyze the immunoexpression of CD34, CD117, and p53 in hypocellular BM disorders.
Materials and Methods
This was a prospective study conducted on 30 consecutive patients presenting with pancytopenia/bicytopenia and having hypocellular BM according to age. Written consent was obtained from all patients included in this study. The study was conducted on ethical guidelines for biomedical research on human subjects as given in the “Declaration of Helsinki” and by Central Ethics Committee on Human Research (CECHR) of the Indian Council of Medical Research (ICMR), New Delhi.
The study included patients having pancytopenia/bicytopenia as per diagnostic criteria: absolute neutrophil count (ANC) < 1.8 × 10⁹/L, platelet count < 100 × 109/L, and hemoglobin (Hb) <10 g/L with hematocrit < 38%. Other inclusion criteria were corrected reticulocyte count < 1% and hypocellular BM. Known cases of malignancy, including leukemia receiving chemotherapy or radiotherapy and known cases of AA and h-MDS on treatment, were excluded from the study.
Complete Blood Count
Complete blood count (CBC) was performed on automated hematology cell coulter, 6-part differential Transasia Sysmex XN1000 using 2 mL fresh ethylene diamine tetra acetic acid blood sample and included Hb, total leucocyte count (TLC), differential leucocyte count, platelets, reticulocyte count, and red cell indices.[17] Anemia and thrombocytopenia were graded according to World Health Organization (WHO) criteria.[18,19] ANC was used to classify the patients into different categories of AA.
Bone Marrow Examination
Bilateral BM aspiration combined with bilateral trephine biopsies was done and imprints of trephine biopsies were taken. Aspiration and trephine biopsy imprint smears in each case were stained with May Grunwald-Giemsa stain. The morphological features assessed included presence of significant bilineage or trilineage dysplasia, increased number or clustering of megakaryocytes, reticulin fibrosis, blast count, and ring sideroblasts.[13,20] The absence of blasts and lack of dysplasia particularly of the megakaryocytic lineage supported the diagnosis of AA.[2]
Immunohistochemical Analysis
Additional sections of trephine biopsies were obtained on lysinated slides and immunohistochemistry (IHC) was performed by standard staining protocol using CD34, p53, and CD117 antibodies.[21] (CD34- monoclonal mouse antibody, QB End 10; CD117- rabbit monoclonal antibody; p53- mouse monoclonal antibody, DO7). To examine their expression, sections were treated with citrate buffer (pH 6.0) in a pressure cooker to allow antigen retrieval. Then sections were incubated with primary antibodies CD34, CD117, and p53 in a moist chamber. Sections were then covered with secondary antibody for 30 minutes and then washed with tris buffer. Chromogen (3,3-diaminobenzidine) was added onto slides to detect immunoreactivity.
Positive controls were included in each run of the immunostaining. CD34 positive endothelial cells were used as an internal control for CD34. Tissue sections from known case of gastrointestinal stromal tumors and lymphoma were used as positive control for CD117 and p53, respectively. Ten controls (known case of lymphoma without BM infiltration) were included in the study. IHC for CD34, CD117, and p53 was performed on their trephine biopsies to establish the normal values, as shown below:
CD34: 0.6–1.2%
p53: 0%
CD117: 0.5–1.4%
CD34 expression was assessed based on the percentage of BM nucleated cells showing membranous and/or cytoplasmic positivity for anti-CD34 antibody. The total number of CD34 positive cells were counted under 1,000× magnification, the average CD34 cell count per 500 BM nucleated cells was calculated and the results were interpreted as percentage and mean ± SD (standard deviation).
p53 positive cells were identified as any cell with clear and unequivocal nuclear staining. Immunohistochemical expression of p53 was quantified as percentage of p53 positive cells per 500 BM nucleated cells as follows: 0%: negative, < 5%: weak expression, 5 to 30%: moderate expression, and > 30%—strong expression. CD117 positive cells show membranous positivity for anti-CD117. It was quantified in as percentage of CD117 positive cells per 500 BM nucleated cells.
To detect PNH clones in AA, additional tests were performed such as leukocyte alkaline phosphatase (LAP) score, and PNH gel card test.
Statistical Analysis
The distribution of the measurable data was tested for its normality using Kolmogorov–Smirnov test and data was presented with descriptive statistics, that is, mean ± SD. The normally distributed data in patients and controls was compared using analysis of variance test. The association of the categorical/classified data with all the diagnosis was calculated using chi-squared test and data presented as percentage form. A p-value of < 0.05 was considered statistically significant.
Results
Out of the 30 patients of hypocellular BM included in this study, 26 had AA, 3 had hypocellular MDS, and 1 had h-AML. The age of patients ranged from 5 to 72 years with the peak in the second decade of life. In AA, age of patients ranged from 5 to 68 years (mean age: 23.73 ± 3.1), while in h-MDS age ranged from 13 to 70 years (mean age: 51.75 ± 13.6). There was a single patient diagnosed as h-AML who was 72 years old. Out of 30 patients, 21 were males and 9 were females, with a male to female ratio of 2.3:1. Among the 26 patients with AA, 18 were males and 8 were females, whereas out of 3 patients of h-MDS, 2 were males and 1 was female. One patient diagnosed as h-AML was male.
Hb ranged from 2.6 to 9.5 gm/dL with the mean Hb 6.2 ± 1.8 gm/dL. Majority of the patients (80%) had severe anemia and six (20%) had moderate anemia. TLC ranged from 1.1 to 7.1 × 10⁹/L. Out of 26 AA patients, 5 (19.2%) had ANC less than 200/µL. In h-MDS and h-AML, ANC was in the normal range. Platelet count ranged from 1 × 10⁹ to 53 × 10/L. Corrected reticulocyte count was < 1% in all (100%) patients (►Table 1). Most patients (69.2%) of AA belonged to the severe category, followed by very severe AA (19.2%). Out of 26 patients with AA, LAP score was increased in 19 patients (73.1%), 6 (23.1%) patients showed normal range (40–150) of LAP score, while 1 (3.8%) patient showed decreased LAP score in which PNH test was positive on the PNH gel card. All patients of h-MDS and h-AML had LAP score within the normal range.
| Parameters | h-MDS+ h-AML (n = 4) | AA (n = 26) | p-Value |
|---|---|---|---|
| Hb (gm/dL) | 5.650 ± 3.024 | 6.338 ± 1.624 | 0.68 |
| RBC (×1012) | 2.010 ± 1.1097 | 2.078 ±.5823 | 0.91 |
| TLC (×109) | 2.950 ± 0.30 | 2.74 ± 1.22 | 0.73 |
| Platelet count (×109) | 26.50 ± 18.41 | 12.57 ± 12.81 | 0.06 |
| Retic (%) | 0.263 ± 0.1887 | 0.263 ± 0.2969 | 0.99 |
Abbreviations: AA, aplastic anemia; h-AML, hypocellular acute myeloid leukemia; h-MDS, hypocellular myelodysplastic syndrome; RBC, red blood cell; TLC, total leucocyte count.
All the patients had BM cellularity of less than 30% on BM aspiration and trephine biopsy. BM cellularity was in the range of 5 to 30% in AA, 10 to 30% in h-MDS, and 20% in h-AML. One (3.8%) patient was diagnosed with Fanconi anemia (FA) in the present study. PNH gel card test was performed on 20 patients of AA as 6 patients did not turn up for the test. The test was positive only in 1 (5%) patient of AA. Mean blast count in AA and in h-MDS was 0.9 and 7.3%, respectively, while in h-AML, blast count was 36%. Out of 30 patients, features of dysplasia were noted in 6 (20%). All the three patients (100%) of h-MDS exhibited bilineage/trilineage dysplasia, while only three patients (11.5%) of AA showed mild dyserythropoiesis (12–17%). Reticulin was increased only in 2 (6.6%) patients and both were diagnosed as h-MDS.
Immunoexpression of CD34 was decreased in 25 (96.2%) patients of AA; however, one (3.8%) patient of AA showed normal expression. The percentage of CD34 cell count was increased in h-AML and in all three (100%) patients of h-MDS (►Fig. 1). All patients (100%) of AA showed increased expression of CD117. Out of three patients of h-MDS, two (66.7%) had increased expression, and one (33.3%) had decreased expression of CD117. One patient diagnosed as h-AML showed increased percentage of CD117 positive cells as compared with controls (►Fig. 2).
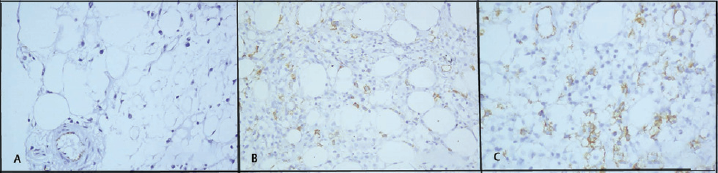
- CD34 immunoexpression in hypocellular bone marrow disorders. (A) Decreased CD34 expression in a patient of aplastic anemia. Internal control—endothelial cells (×400). (B) Increased CD34 expression in a patient of hypocellular myelodysplastic syndrome. (×400). (C) Increased expression of CD34 in hypocellular acute myeloid leukemia (×400).
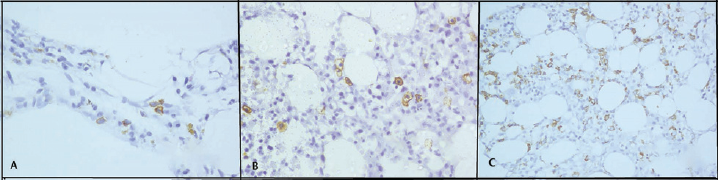
- CD117 immunoexpression in hypocellular bone marrow disorders. (A) Increased CD117 expression in a patient of aplastic anemia. (×400). (B) Increased CD117 expression in a patient of hypocellular myelodysplastic syndrome (×400). (C) Increased expression of CD117 in hypocellular acute myeloid leukemia (×400).
p53 positivity was observed in h-AML and in all three patients (100%) of h-MDS. In h-MDS and h-AML, expression of p53 ranged from 1.0 to 6.0% (►Fig. 3). Out of 26 patients of AA, one (3.8%) diagnosed as FA showed increased expression of p53 (2.9%), a disease that is associated with increased genomic instability.
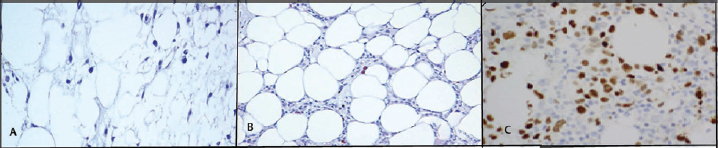
- Immunoexpression of p53 in various hypocellular bone marrow disorders. (A) Decreased p53 expression in a patient of aplastic anemia. (×400). (B) Increased p53 expression in a patient of hypocellular myelodysplastic syndrome (×400). (C) Increased expression of p53 in hypocellular acute myeloid leukemia (×400).
In the combined group of h-MDS+ h-AML, percentage of BM CD34+ cells was increased (3.87 ± 0.86) as compared with AA (0.19 ± 0.15) and controls (0.81 ± 0.21), the difference being statistically significant (p = 0.01). Percentage of BM p53+ cells was also significantly increased in h-MDS+ h-AML (2.9 ± 2.07) as compared with AA and controls, which did not show any p53+ cells, p = 0.0. No statistically significant difference was observed in the expression of CD117 in h-MDS+ h-AML (4.95 ± 3.40) compared with AA (4.49 ± 1.07), p = 0.99 (►Table 2).
| Immunohistochemical marker | h-MDS+ h-AML (n = 4) | AA (n = 26) | p-Value |
|---|---|---|---|
| CD34 | 3.87 ± 0.86 | 0.19 ± 0.15 | 0.01 |
| p53 | 2.9 ± 2.07 | 0 ± 0 | 0.00 |
| CD117 | 4.95 ± 3.40 | 4.49 ± 1.07 | 0.99 |
Abbreviations: AA, aplastic anemia; h-AML, hypocellular acute myeloid leukemia; h-MDS, hypocellular myelodysplastic syndrome.
Discussion
The appropriate classification of hypocellular BM disorders in patients is a challenging task due to the lack of clear cut diagnostic criteria, a fact that is responsible for serious diagnostic inconsistencies.[15] The exact etiopathogenesis of hypocellular marrow remains elusive; however, it is multifactorial encompassing various factors like genetic predisposition, immune mechanisms, radiation, infections, and idiopathic.[22-24] The distinction between AA and h-MDS is clinically relevant because the treatment of both these diseases is different and the risk of progression to acute leukemia is much greater in h-MDS in contrast to AA. The distinction from AA is even more important in patients of h-AML because the latter require appropriate treatment for acute leukemia. Early diagnosis is the best intervention for improving survival and quality of life.[15,25] Such a distinction is ensured by morphological assessment complemented by immunohistochemical and cytogenetic studies.[1,14-16]
The morphological differences may be subtle and identification of blasts in tissue sections may be compromised due to technical errors such as excessive thickness of paraffin sections or suboptimal morphology, resulting from improper fixation. Also, other immature cells like proerythroblasts or subset of lymphoid cells may be mistaken for blasts by morphology. Therefore, in this study, we have tried to demonstrate the role of CD34, CD117, and p53 immunoexpression as an additional assistance in the identification of blasts and abnormal localization of immature precursors to facilitate the distinction between AA, h-MDS, and h-AML.
CD34+ hematopoietic progenitors are central to the pathogenesis of both MDS and AA. CD34 expression is significantly decreased in AA BM because CD34+ cells are the targets of autoimmune destruction. In contrast, CD34+ cells appear to be the cells from which MDS originate, and thus may be increased as a result of neoplastic clonal expansion.[15] We found that the percentage of CD34 cell count was increased in all patients of h-MDS and h-AML; however, expression of CD34 was decreased in patients of AA. Our observations are in agreement with the published literature.[1,15,16] CD34 immunostaining also enables the detection of angiogenesis by highlighting the endothelial cells. In AA, angiogenesis is defective that may lead to BM aplasia; however, angiogenesis is significantly increased in MDS.[14]
p53 is a tumor suppressor gene located on the short arm of chromosome 17. The products of this gene play two roles in DNA damaged cells, that is, proliferation arrest and apoptosis induction. The mutant p53 has a prolonged half-life that plays a permissive role in the proliferation of cells with damaged DNA and is detectable by IHC on tissue sections. In contrast, wild-type p53 cannot be detected because it has a short half-life. In the present study, the percentage of p53 positive cells was significantly higher in h-MDS and h-AML as compared with controls and AA. One patient diagnosed as FA showed increased expression of p53. The findings were in congruence with the existing literature.[14,26]
In the current study, there were no statistically significant differences in the percentage of CD117 positive cells between AA and h-MDS+ h-AML. There are controversial studies in literature regarding the expression of CD117 in hypocellular BM disorders. Bennett and Orazi reported that CD117 was useful for the assessment of presence of ALIP in h-MDS and h-AML in conjunction with CD34.[1] A study conducted by Huss et al and Shao et al demonstrated an increased expression of CD117 in AA compared with h-MDS and controls.[27] The pathogenesis of expression of CD117 in AA and h-MDS is not clear. However, its expression in MDS is associated with poor survival as well as higher risk of progression to AML.[28]
Conclusion
In conclusion, CD34 and p53 immunoexpression might be used as an ancillary method in distinguishing various hypocellular BM disorders especially h-MDS and AA. However, role of CD117 remains unclear and needs to be further evaluated by larger studies.
Conflict of Interest
None.
References
- Diagnostic criteria to distinguish hypocellular acute myeloid leukemia from hypocellular myelodysplastic syndromes and aplastic anemia: recommendations for a standardized approach. Haematologica. 2009;94(02):264-268.
- [CrossRef] [PubMed] [Google Scholar]
- SAA-WP EBMT. Diagnos is of acquired aplastic anemia. Bone Marrow Transplant. 2013;48(02):162-167.
- [CrossRef] [PubMed] [Google Scholar]
- The challenging world of cytopenias: distinguishing myelodysplastic syndromes from other disorders of marrow failure. Oncologist. 2014;19(07):735-745.
- [CrossRef] [PubMed] [Google Scholar]
- Acquired aplastic anaemia. In: Hoffbrand AV, Catovsky A, Tuddenham EGD, Green AR, eds. Hoffbrand (6th). West Sussex, UK: Wiley Blackwell; 2011. p. :206-224.
- [CrossRef] [PubMed] [Google Scholar]
- Epidemiology, pathogenesis and diagnosis of aplastic anaemia. J Assoc Physicians India. 2015;63(3, Suppl):8-12.
- [Google Scholar]
- The epidemiology of aplastic anemia in Thailand. Blood. 2006;107(04):1299-1307.
- [CrossRef] [PubMed] [Google Scholar]
- The epidemiology of acquired aplastic anemia. Haematologica. 2008;93(04):489-492.
- [CrossRef] [PubMed] [Google Scholar]
- British Committee for Standards in Haematology. Guidelines for the diagnosis and management of aplastic anaemia. Br J Haematol. 2009;147(01):43-70.
- [CrossRef] [PubMed] [Google Scholar]
- Catalan Group for Study of Agranulocytosis and Aplastic Anemia. Epidemiology of aplastic anemia: a prospective multicenter study. Haematologica. 2008;93(04):518-523.
- [CrossRef] [PubMed] [Google Scholar]
- Response of paroxysmal nocturnal hemoglobinuria clone with aplastic anemia to rituximab. Case Rep Hematol. 2012;2012 106182
- [CrossRef] [PubMed] [Google Scholar]
- Myelodysplastic syndromes: it is all in the genes. J Clin Oncol. 2012;30(08):774-776.
- [CrossRef] [PubMed] [Google Scholar]
- Myelodysplastic syndromes: incidence and survival in the United States. Cancer. 2007;109(08):1536-1542.
- [CrossRef] [PubMed] [Google Scholar]
- The myelodysplastic syndromes. In: Greer JP, Forester J, Rodgers GM, Paraskevas F, Glader B, Arber DA, eds. Wintrobe's Clinical Haematology (13th). Philadelphia: Lippincott Williams and Wilkins; 2014. p. :1673-1687.
- [Google Scholar]
- CD34 and p53 immunohistochemical stains differentiate hypocellular myelodysplastic syndrome from aplastic anaemia and a CD34 immunochemical stain provides useful survival information for hypoplastic myelodysplastic syndrome. Ann Lab Med. 2014;34:42632.
- [CrossRef] [PubMed] [Google Scholar]
- Quantitative analysis of bone marrow CD34 cells in aplastic anemia and hypoplastic myelodysplastic syndromes. Leukemia. 2006;20(03):458-462.
- [CrossRef] [PubMed] [Google Scholar]
- CD34, RAB20, PU.1and GFI1 mRNA expression in MDS. Int J Lab Hematol. 2009;31:344-351.
- [CrossRef] [PubMed] [Google Scholar]
- Basic haematological techniques. In: Bain BJ, Bates I, Laffar MA, Lewis SM, eds. Dacie and Lewis Practical Haematology (11th). London: Elsevier; 2012. p. :23-56.
- [CrossRef] [Google Scholar]
- Geneva, World Health Organization. 2011 Available at: http://www.who.int/vmnis/indicators/hemoglobin.pdf. Accessed June 15, 2021
- [Google Scholar]
- Thrombocytopenia in adults: a practical approach to evaluation and management. South Med J. 2006;99(05):491-498. quiz 499–500, 533
- [CrossRef] [PubMed] [Google Scholar]
- Myelodysplastic syndromes overview. In: Swerdlow SH, Campo E, Harris NL, Jaffe ES, Pileri SA, Stein H, eds. WHO Classification of Tumors of Hematopoietic and Lymphoid Tissues (4th). Lyon: France; 2017. p. :98-117.
- [Google Scholar]
- Immunohistochemical techniques. In: Bancroft J, Layton C, Suvarna SK, eds. Theory and Practice of Histological Techniques (7th). Philadelphia: Elsevier; 2012. p. :381-426.
- [CrossRef] [Google Scholar]
- Acquired aplastic anaemia. In: Greer JP, Forester J, Rodgers GM, Paraskevas F, Glader B, Arber DA, eds. Wintrobe's Clinical Haematology (12th). Philadelphia: Lippincott Williams and Wilkins; 2009. p. :1185-1195.
- [Google Scholar]
- Current concepts in the pathophysiology and treatment of aplastic anemia. Blood. 2006;108(08):2509-2519.
- [CrossRef] [PubMed] [Google Scholar]
- Immunologic aspects of hypoplastic myelodysplastic syndrome. Semin Oncol. 2011;38(05):667-672.
- [CrossRef] [PubMed] [Google Scholar]
- Classification of childhood aplastic anemia and myelodysplastic syndrome. Hematology (Am Soc Hematol Educ Program. 2011;2011:84-89.
- [CrossRef] [PubMed] [Google Scholar]
- Epidemiology, clinico-haematological profile and management of aplastic anaemia: AIIMS experience. J Assoc Physicians India. 2015;63(3, Suppl):30-35.
- [Google Scholar]
- [Expression of c-kit receptor on the hemopoietic stem/precursor cells of aplastic anemia patients] Zhonghua Xue Ye Xue Za Zhi. 1999;20(10):532-534.
- [Google Scholar]
- CD34/CD117 positivity in assessment of prognosis in children with myelodysplastic syndrome. Leuk Res. 2006;30(02):222-224.
- [CrossRef] [PubMed] [Google Scholar]


