
Translate this page into:
Martin’s formula is best to calculate low-density lipoprotein cholesterol

*Corresponding author: Sudha Ambiger, Department of Biochemistry, Kahers Jawaharlal Nehru Medical College (JNMC), Belgaum, Karnataka, India. dr.sudha.ambi@gmail.com
-
Received: ,
Accepted: ,
How to cite this article: Farheen F, Ambiger S, Jaalam K, Javali S. Martin’s formula is best to calculate low-density lipoprotein cholesterol. J Lab Physicians. 2024;16:291-7. doi: 10.25259/JLP-2022-7-20-(1343)
Abstract
Objectives:
Due to the cost-effectiveness, most of the laboratories in India estimate low-density lipoprotein cholesterol (LDL-C) levels with the Friedewald’s formula. There were many shortcomings of the Friedewald’s formula. Recently, Martins have derived a new formula for calculating LDL-C. The present study was undertaken to calculate LDL-C using various formulae (Friedewald’s formula, Anandaraja’s formula, and Martin’s formula) and to compare directly measured LDL-C with calculated LDL-C at various ranges of triglyceride (TG) concentration.
Materials and Methods:
The present study compared LDL-C measured by Martin’s formula, Friedewald’s formula, and Anandaraja’s formula with directly measured LDL In 280 Outpatient fasting samples between the age group of 18 and 50 years. Depending on the TG values, study samples are divided into four groups. Group 1: <200 mg/dL, Group 2: 200–300 mg/dL, Group 3: 300–400 mg/dL, Group 4: >400 mg/dL.
Statistical Analysis:
This was performed by the Statistical package for social sciences version 16. Paired t test and pearson correlation were performed to find the significant difference and correlation between direct LDL-C and calculated LDL-C by different formula.
Results:
Martin’s formula shows highest correlation with r-value of (0.9979) compared to Friedewald’s (0.9857) and Anandaraja’s (0.9683) r-values. The mean difference was least for Martin’s formula (0.31 ± 3.53) compared to other formulae. Among all the groups, the percentage of error was least for Martin’s formula (0.23%). Martin’s LDL-C shows highest concordance (90.90%) compared to Friedewald’s (79.60%) and Anandaraja’s formulae (82.90%).
Conclusions:
Among all the groups, Martin’s formula shows highest correlation, least percentage of error, highest concordance, and least mean differences. At all TG levels, Martin’s formula is the best formula compared to the Friedewald’s formula and Anandaraja’s formula.
Keywords
Low-density lipoprotein
Martin’s formula
Anandaraja’s formula
Friedewald’s formula and direct low-density lipoprotein

INTRODUCTION
The National Cholesterol Education Program Adult Treatment Panel III (NCEP-ATP III) guidelines suggest starting the drug therapy, if low-density lipoprotein cholesterol (LDL-C) levels >130 mg/dL. This makes accurate reporting of LDL-C crucial in the management of dyslipidemia patients.[1] Ultracentrifugation and beta-quantitation are the gold standard methods for LDL-C measurement. The other methods include direct measurement of LDL-C using a homogenous assay. These methods are expensive, inconvenient, and not readily available in most of the routine laboratories.[2] Due to these limitations, many clinical laboratories throughout the world use a less expensive and easy approach for the estimation of LDL-C, that is, Friedewald’s formula.[3] However, there are several shortcomings of this formula, mainly the underestimation of LDL-C at high triglyceride (TG) levels and overestimation at low TG levels.[4] Many attempts have been made to evaluate and refine Friedewald’s formula. Different modified formulae such as Anandaraja’s formula[5] and Martin’s formula[6] have been developed. Compared to Friedewald’s formula, Anandaraja’s formula[5] uses only two analytes, TG and total cholesterol (TC) for calculation, which may decrease the total error when compared to the Friedewald’s formula.
Friedewald’s formula did not take account of inter individual variation as it uses fixed value 5 as advisor for TG, resulting in underestimation of risk and potentially under treatment.[7] In contradictory, Martin’s et al.[7] provided a new formula, by introducing adjustable factor in the formula. The Martin’s formula: (total cholesterol-high-density lipoprotein cholesterol [TC-HDL-C]) – (TGs/adjustable factor).[7] Adjustable factor defined by levels of TG and non-HDL-C, as divisor for TG. This adjustable factor ranges from 3.1 to 11.9. This was derived from an analysis of TG-to-very low-density lipoprotein cholesterol (VLDL-C) ratios of more than 1.3 million people.[7] There are few studies reporting the use of this formula in India.
Accurately determining LDL-C values is important in clinical laboratory practice because LDL-C is employed to manage patients having a high risk of coronary heart disease. Therefore, most alternative formulae have been developed to estimate LDL-C to be appropriate for ethnic- specific as well as other populations. The present study was undertaken with an aim, to determine,which of this calculated formula (Friedewald’s, Anandaraja’s, and Martin’s formula) show maximum correlation with directly measured LDL-C at different serum TG levels.
MATERIALS AND METHODS
Study design
This study is an observational study. The study samples were collected from KLE centenary charitable hospital and medical research center Belagavi. Two hundred and eighty outpatient fasting complete lipid profile patients of 18–50 years of age were included in the study. Ethical clearance was obtained from the Institution Ethics Committee USM KLE International Medical Program Belagavi. Ethical approval number USM-KLE/IEC/04–2020. Written informed consent was taken from all participants.
Inclusion criteria
Two hundred and eighty outpatient fasting samples coming to laboratory for lipid profile and age group 18–50 years were included in the study.
Exclusion criteria
Patients with diabetes mellitus, hypothyroidism, cirrhosis, chronic hepatitis, chronic kidney disease, pancreatitis, and patients on active medication, such as steroids, statins, and omega-3 fatty acids, were excluded from the study.
Calculation of sample size
Direct method LDL mean = 118.02[8]
Friedewald method mean = 107.22[8]
Standard deviation in direct method = 35.45
Standard deviation in Friedewald method = 24.35
Effect size: 0.261538461538461
Power = 95%
Alpha error = 1%
Required sample size = 266 should be taken.
Z = 1.96 for 95% confidence
S1 = Standard deviation in Direct method = 35.45
S2 = Standard deviation in Friedewald method = 24.35
X2 = Direct method LDL mean = 118.02
X1 = Friedewald method mean = 110.22
Sample collection and lipoprotein analysis
As a routine procedure, the samples were collected after 10– 12 h of overnight fasting by withdrawing 3 mL of venous blood in a plain vial. The samples were centrifuged at 3000 rpm for 15 min to obtain serum and were analyzed for lipid profile on the same day. The serum lipid profile parameters TC, TG, HDL-C, and LDL-C were analyzed on EM 360 clinical chemistry analyzer (TransAsia Bio-Medicals Ltd, Mumbai, Maharashtra, India). All the lipid parameters were estimated using kits purchased from Erba Mannheim XL system packs. The linearity (intra-assay coefficients) of TC, TG, HDL- C, and LDL-C assays were 4.2–695 mg/dL (0.98–1.21%), 9.74– 1062 mg/dL (0.48–0.86%), 1.90–193 mg/dL (1.32–1.95%), and 2.60–263 mg/dL (1.74–2.16%), respectively. The intra-assay coefficients observed in our analysis were in concurrence with the manufacturer’s measurements. All quality controls were performed to ensure the accuracy of the analytical testing (internal and external controls). The internal control is routinely processed every 24 h on two levels (normal and pathological) by liquichek lipids control from Bio-Rad laboratories, Inc. The results are analyzed daily and periodically for the evaluation of the Levey Jennings graph. The laboratory’s external quality control is performed every three months. All the lipid parameters assays meet the National Institutes of Health NCEP goals for acceptable performance (LDL – CV < 4%, Bias < 4% and Total Error of < 12%, for HDL – CV < 4%, Bias ≤± 5% and total error ≤13%, for TC – CV < 3%, Bias ≤ ±3% and total error ≤8.9%, for TG – CV < 5%, and Bias ≤ ±5% and total error ≤15%).
LDL-C was calculated by following formulae:
Friedewald’s formula[4] (F-LDL) = TC−(TG/5+HDL-C)
Anandaraja’s formula[5](A-LDL) = (0.9×TC) −(0.9×TG/5)–28
Martin’s formula[6] (M-LDL) = (TC-HDL-C)– (TGs/adjustable factor*)
*Adjustable factor: The adjustable factor based on TG and nonHDL-C concentrations. Mart’s method matches each person with one of 180 different factors to estimate VLDL cholesterol from TGs. The Martin’s LDL-C was calculated using an LDL-C calculator (http://www.ldlcalculator.com). Copy the values for TC, HDL-C, and TGs from the research database into the Excel file. Non-HDL-C, the adjustable factor, and LDL-C by Martin’s formula, will be automatically calculated.
Depending on the TG values, study samples were divided in to four groups.
Group 1: <200 mg/dL
Group 2: 200–300 mg/dL
Group 3: 300–400 mg/dL
Group 4: >400 mg/dL.
Statistical analysis
The data obtained were entered into Microsoft Excel sheet, and statistical analysis was performed with the Statistical Package for the Social Sciences version 16.0. Paired t-test and Pearson correlation were performed to find the significant difference and correlation between direct LDL-C and calculated LDL by a different formula. Scatter plot was used to represent the correlation between the two methods. The mean percentage of error was calculated using the formula: (Calculated LDL-C−D-LDL-C)/D-LDL-C × 100. P < 0.05 is considered as significant.
RESULTS
The study consists of a total 280 samples. Depending on the TG values (66–533 mg/dL), the study population is divided into four groups. There were 124 participants in Group 1, 91 participants in Group 2, 36 participants in Group 3, and 29 participants in Group 4.
Table 1 shows the baseline characteristics of the study population gender and sex. Comparison of gender and age between groups is statistically not significant. There was no significant difference in age and gender in the study population between groups [Table 1].
| Group 1 | Group 2 | Group 3 | Group 4 | Total | P-value | |
|---|---|---|---|---|---|---|
| Gender | ||||||
| Male | 64 (52) | 37 (41) | 20 (55) | 9 (31) | 130 | 0.089 |
| Female | 60 (48) | 54 (59) | 16 (44) | 20 (69) | 150 | |
| Age | ||||||
| Mean±SD | 40.9±8.0 | 38.8±9.2 | 39.1±10.0 | 39.8±8.2 | 39.9±8.7 | 0.337 |
| Total | 124 | 91 | 36 | 29 | 280 |
SD: Standard deviation. P<0.05 is statically significant
LDL-C was calculated according to three different formulae and compared with directly measured LDL-C [Table 2]. correlation coefficient r was calculated with each equation by correlation analysis of the data. The best formula was chosen in terms of the highest correlation and the lowest mean difference and standard deviation. LDL-C by Martin’s formula showed a highest correlation of r = 0.9979, compared to other formulae r-value Friedewald’s formula 0.9857 and Anandaraja’s formula 0.9683 [Table 2 and Figure 1].
| Samples | Variables | r-value | P-value |
|---|---|---|---|
| Total | Friedewald formula | 0.9857 | <0.001* |
| Anandaraja formula | 0.9683 | <0.001* | |
| Martins formula | 0.9979 | <0.001* | |
| Group 1 | Friedewald formula | 0.9983 | <0.001* |
| Anandaraja formula | 0.9864 | <0.001* | |
| Martins formula | 0.9998 | <0.001* | |
| Group 2 | Friedewald formula | 0.9944 | <0.001* |
| Anandaraja formula | 0.9884 | <0.001* | |
| Martins formula | 0.9953 | <0.001* | |
| Group 3 | Friedewald formula | 0.9976 | <0.001* |
| Anandaraja formula | 0.9908 | <0.001* | |
| Martins formula | 0.9991 | <0.001* | |
| Group 4 |
Friedewald formula | 0.9958 | <0.001* |
| Anandaraja formula | 0.9967 | <0.001* | |
| Martins formula | 0.9967 | <0.001* |
LDL-C: Low-density lipoprotein cholesterol, r: Correlation coefficient, *P<0.05 is statically significant
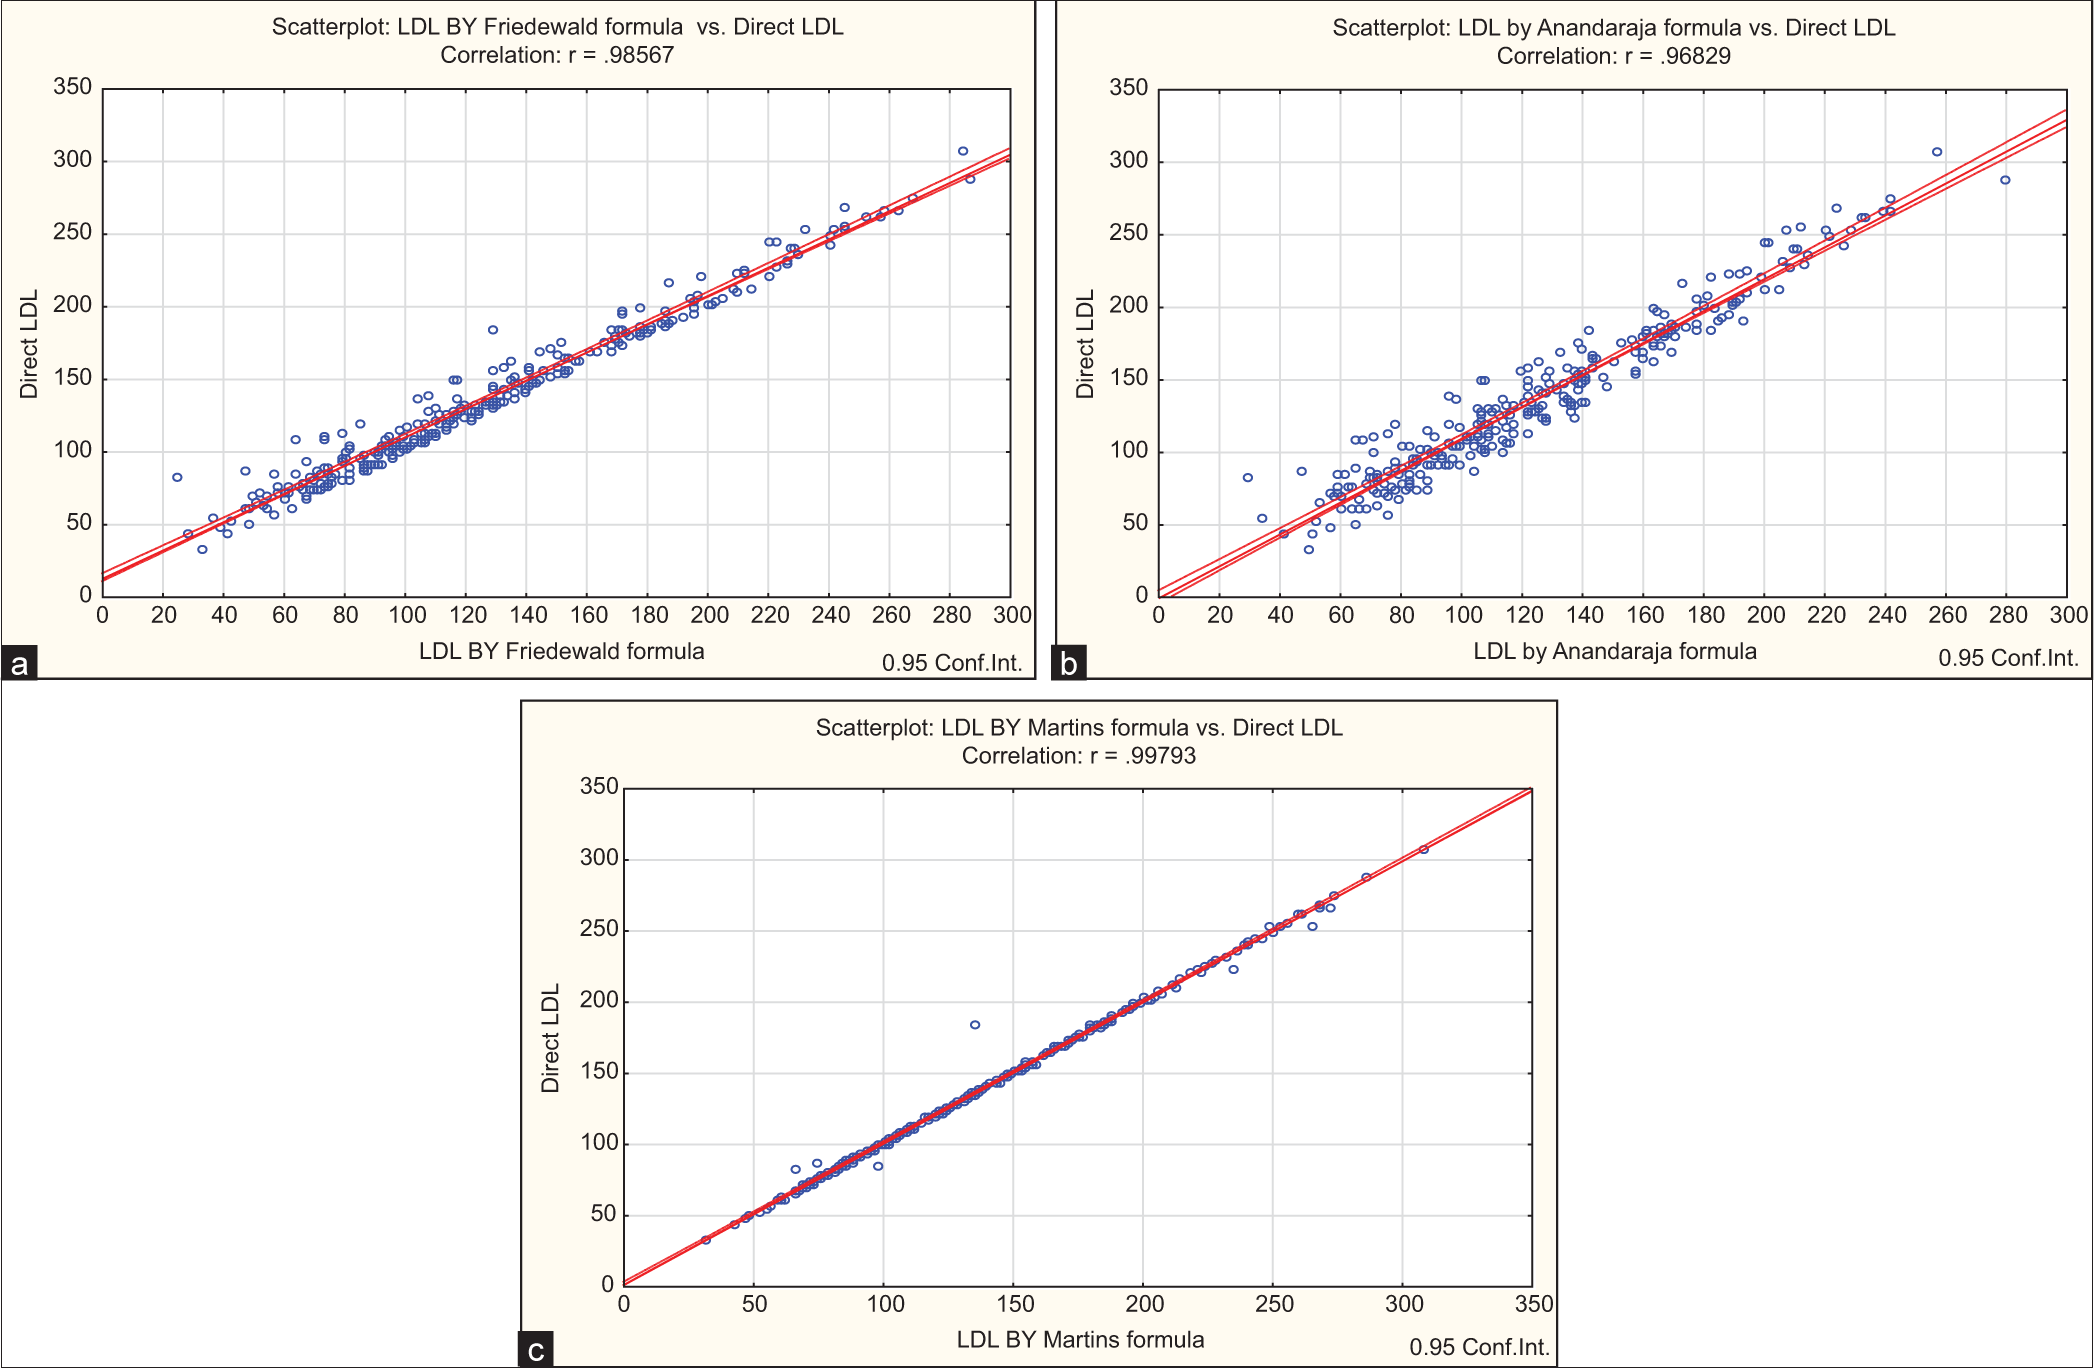
- Correlation between direct low-density lipoprotein cholesterol (LDL-C) and calculated LDL-C. Blue dots indicate values of LDL by direct low density lipoprotein cholesterol (LDL-C) and calculated LDL-C by Friedewald formula, red line indicates positive corelation between them. (a) Correlation between direct LDL-C and Friedewald formula LDL-C. (b) Correlation between direct LDL-C and Anandaraja formula LDL-C. Blue dots indicate values of LDL by direct low density lipoprotein cholesterol (LDL-C) and calculated LDL-C, red line indicates positive corelation between them. (c) Correlation between direct LDL-C and Martins formula LDL-C. Blue dots indicate values of LDL by direct low density lipoprotein cholesterol(LDL-C) and calculated LDL-C by Martins formula, red line indicates positive corelation between them.
Comparison of mean of directly measured LDL-C with calculated LDL-C [Table 3] by Friedewald’s formula and Anandaraja’s formula shows that it is underestimated at all levels of TG, and it is statistically significant. Among the total sample, mean difference of the direct and calculated formula was the least for Martin’s formula 0.31 ± 3.53 compared to other formulae. In Group 1, mean difference was least for Anandaraja’s formula 1.08 ± 8.35 compared to other formulae. In Groups 2, 3, and 4, mean difference was least for Martin’s formula with values 0.65 ± 5.17, 0.00 ± 2.47, and 0.77 ± 5.13, respectively, compared to other formulae.
| Total sample | |||
|---|---|---|---|
| Method | Mean±SD | Mean difference (mg/dL) | P-value |
| Direct | 137.42±54.51 | ||
| Friedewald formula | 128.06±55.18 | 9.37 | <0.001* |
| Anandaraja formula | 125.56±47.96 | 11.86 | <0.001* |
| Martins formula | 137.11±54.82 | 0.31 | 0.1443 |
| Group 1 | |||
| Direct | 118.61±44.55 | ||
| Friedewald formula | 115.60±45.27 | 3.01 | <0.001* |
| Anandaraja formula | 117.53±39.93 | 1.08 | 0.1536 |
| Martins formula | 118.21±44.47 | 0.40 | <0.001 |
| Group 2 | |||
| Direct | 134.85±53.09 | ||
| Friedewald formula | 124.33±56.93 | 10.52 | <0.001* |
| Anandaraja formula | 121.54±50.16 | 13.31 | <0.001* |
| Martins formula | 134.20±52.76 | 0.65 | 0.2343 |
| Group 3 | |||
| Direct | 177.48±50.13 | ||
| Friedewald formula | 163.74±55.03 | 13.74 | <0.001* |
| Anandaraja formula | 153.87±48.31 | 23.61 | <0.001* |
| Martins formula | 177.47±51.33 | 0.00 | 0.9941 |
| Group 4 | |||
| Direct | 176.21±58.99 | ||
| Friedewald formula | 148.70±65.78 | 27.52 | <0.001* |
| Anandaraja formula | 137.39±58.33 | 38.83 | <0.001* |
| Martins formula | 176.98±60.58 | −0.77 | 0.4288 |
LDL-C: Low-density lipoprotein cholesterol, SD: Standard deviation. Mean difference=Direct LDL-C–Formula calculated LDL-C. *P<0.05 is statically significant
Percentage of error from direct LDL-C to calculated LDL-C was the least for Martin’s formula [Table 4 and Figure 1] in total study sample and in all groups compared to other formulae.
| LDL by Friedewald | LDL by Anandaraja | LDL by Martins | |
|---|---|---|---|
| Total | 6.82 | 8.63 | 0.23 |
| Group 1 | 2.54 | 0.91 | 0.34 |
| Group 2 | 7.80 | 9.87 | 0.48 |
| Group 3 | 7.74 | 13.30 | 0.00 |
| Group 4 | 15.62 | 22.04 | 0.44 |
LDL-C: Low-density lipoprotein cholesterol. Percentage of error=(Calculated LDL-C–Direct LDL-C)/Direct LDL-C×100.
The present study compared the concordance of the directly measured LDL-C with the estimated LDL-C when classifying LDL-C values by NCEP-ATP III. We labeled the result as being “concordant” if the two values were in the same classification, as an “overestimation simultaneously”, the estimated value was greater than the direct measurement, or as an “underestimation” if the estimated value was less than the direct measurement.
Martin’s formula (90.90%) resulted in the best concordance with the direct measurement compared to Friedewald’s formula (79.60%) and Anandaraja’s formula (82.90%). Overestimation and underestimation rates produced by Martin’s formula are less than those produced by Friedewald’s and Anandaraja’s formula.
DISCUSSION
The underestimation of LDL-C will lead to delay in the initiation of treatment of patients who are at high risk of dyslipidemia. In a mean, overestimation also leads to exposure of patients to unnecessary drug therapy. Hence, there is a need to find an accurate equation for the estimation of LDL-C with the best performance comparable to the directly measured LDL-C. Since Friedewald’s formula has limitations, many attempts have been made to derive a more accurate formula for LDL-C calculation. The present study was undertaken with the aim of determining which of these calculated formulae (Friedewald’s, Anandaraja’s, and Martin’s formula) show maximum correlation with directly measured LDL-C at different serum TG levels.
The previous studies such as Sahu et al.[9] and Molavi et al.[10] have shown that Friedewald’s equation performs better for certain groups of populations. However, in the study, we found that calculated LDL-C is underestimated in all the groups. Among all the formulas, the mean difference and percentage of error produced by Friedewald’s equation are high in the total sample and in Groups 2, 3, and 4. The results are consistent with the results previously reported by authors’[11-13] that show that Friedewald’s formula underestimates LDL-C at higher TG ranges. It may be because the performance of Friedewald’s equation steadily decreases with increasing TG and is not recommended for hypertriglyceridemia (<400 mg/dL) ranges. In contradictory, studies done by various author[14,15] have reported overestimation of LDL-C by Friedewald’s formula as compared to directly measured LDL-C.
The present study shows, underestimation by Anandaraja’s formula compared to the directly measured LDL-C. The previous studies conducted by Kapoor et al.,[8] Kamal et al.,[11] and other authors’[16-18] also reported underestimation by Anandaraja’s formula. In Group 1, mean difference between Anandaraja’s formula and directly measured LDL –C is least compared to other formulas. The results are consistent with Krishnaveni and Gowda.[19] Krishnaveni and Gowda[19] showed that for subjects with serum levels of TG <100 mg/dL, Anandaraja’s Formula was the most accurate equation.
Kamal et al.,[11] and author’s[20,21] have showed that as TG levels increase, there is an increase in mean difference between direct and formula calculated LDL-C. The present study results support this finding, with an increase in TG concentrations, the difference between D LDL-C and Friedewald’s, Anandaraja’s calculated LDL-C increased. Gupta et al.[16] and Lee et al.[22] observed that LDL-C cholesterol concentrations had no relation with TG concentrations. Martin-LDL-C values were closer to direct LDL-C in all the groups.
Martin’s formula (90.90%) resulted in the best concordance with the direct measurement compared to Friedewald’s formula (79.60%) and Anandaraja’s formula (82.90%). The results are consistent with studies done by Kang et al.,[6] Martin et al.,[7] and by Lee et al.[22] Overestimation and underestimation rates produced by Martin’s formula are less than those produced by Friedewald’s and Anandaraja’s formula; the difference is particularly pronounced in the underestimation rate. This is of particular importance because underestimation is generally considered riskier than overestimation. Primarily, underestimation can cause delays in the initiation of treatment, while screening the general population.
The present study shows the tendency of Friedewald’s formula to underestimate LDL. It is in these clinical conditions that the Martin’s formula may be more useful. In all the groups, Pearson correlation coefficient r value was high for Martin’s formula compared to the Friedewald’s formula. It was suggested that the Martin’s formula may prevent under-treatment due to the underestimation of LDL using the Friedewald’s formula. Our results thereby confirmed that the study by author’s[6,7,22] stated that Martin’s formula offers a significant improvement in LDL-C estimation when compared with Friedewald’s formula. Martin’s formula can be used instead of routine Friedewald’s formula as Martin’s formula is more accurate.
In developing countries like India with a burdening population of high TG, there is a need to adopt the novel equation. Martin’s 180-cell approach could be coded into an online calculator, smartphone application, or automated laboratory reporting system.
Limitation of study
This present study has a few limitations. Firstly, the results may not be generalizable to the overall population, as there may be differences in baseline characteristics between our subjects and the general population. We had access only to the lipid profiles of the subjects. Moreover, clinical characteristics or clinical outcomes of patients in our sample were unknown. Second, instead of calculating an adjustable factor for the Martin’s equation, we used the calculator that was suggested by the authors. However, there is a possibility that the adjustable factor for the Indian population is different from what Martin’s reported.
CONCLUSIONS
In the present study, Martin’s formula showed high correlation, lower mean difference. Additionally it shows the highest concordance and low percentage of errors in all the groups. This is mainly in comparison to Friedewald’s formula and Anandaraja’s formula. At all TG levels, Martin’s formula is best compared to Friedewald’s formula and Anandaraja’s formula.
Ethical approval
Ethical clearance was obtained from the Institution Ethics Committee USM KLE International Medical Program Belagavi. Ethical approval number USM-KLE/IEC/04–2020.
Declaration of patient consent
The authors certify that they have obtained all appropriate patient consent.
Conflicts of interest
There are no conflicts of interest.
Use of artificial intelligence (AI)-assisted technology for manuscript preparation
The authors confirm that there was no use of artificial intelligence (AI)-assisted technology for assisting in the writing or editing of the manuscript and no images were manipulated using AI.
Financial support and sponsorship
Nil.
References
- Journey in guidelines for lipid management: From adult treatment panel (ATP)-I to ATP-III and what to expect in ATP-IV. Indian J Endocrinol Metab. 2013;17:628-35.
- [CrossRef] [PubMed] [Google Scholar]
- Comparison of LDL-cholesterol estimated by direct method and by calculation. Int J Biomed Adv Res. 2016;7:353-8.
- [CrossRef] [Google Scholar]
- Limitations of direct methods and the reference method for measuring HDL and LDL cholesterol. Clin Chem. 2011;57:1081-3.
- [CrossRef] [PubMed] [Google Scholar]
- Estimation of the concentration of low-density lipoprotein cholesterol in plasma, without use of the preparative ultracentrifuge. Clin Chem. 1972;18:499-502.
- [CrossRef] [PubMed] [Google Scholar]
- Low-density lipoprotein cholesterol estimation by a new formula in Indian population. Int J Cardiol. 2005;102:117-20.
- [CrossRef] [PubMed] [Google Scholar]
- Martin's equation as the most suitable method for estimation of low-density lipoprotein cholesterol levels in Korean adults. Korean J Fam Med. 2017;38:263-9.
- [CrossRef] [PubMed] [Google Scholar]
- Comparison of a novel method vs the Friedewald equation for estimating low-density lipoprotein cholesterol levels from the standard lipid profile. JAMA. 2013;310:2061-8.
- [CrossRef] [PubMed] [Google Scholar]
- A leap above Friedewald formula for calculation of low-density lipoprotein-cholesterol. J Lab Physicians. 2015;7:11-6.
- [CrossRef] [PubMed] [Google Scholar]
- Comparison of two methods of estimation of low density lipoprotein cholesterol, the direct versus Friedewald estimation. Indian J Clin Biochem. 2005;20:54-61.
- [CrossRef] [PubMed] [Google Scholar]
- Comparison common equations for LDL-C calculation with direct assay and developing a novel formula in Iranian children and adolescents: The CASPIAN V study. Lipids Health Dis. 2020;19:129.
- [CrossRef] [PubMed] [Google Scholar]
- A comparison of calculated with direct measurement of low density lipoprotein cholesterol level. J Chittagong Med Coll Teach Assoc. 2009;20:19-23.
- [CrossRef] [Google Scholar]
- Method of LDL cholesterol measurement influences classification of LDL cholesterol treatment goals: Clinical research study. J Investig Med. 2010;58:945-9.
- [CrossRef] [PubMed] [Google Scholar]
- Validation of the Friedewald formula for the determination of low-density lipoprotein cholesterol compared with beta-quantification in a large population. Clin Biochem. 2004;37:785-90.
- [CrossRef] [PubMed] [Google Scholar]
- Comparison of LDL cholesterol concentrations by Friedewald calculation and direct measurement in relation to cardiovascular events in 27,331 women. Clin Chem. 2009;55:888-94.
- [CrossRef] [PubMed] [Google Scholar]
- LDL-cholesterol calculation formulas in patients with or without the metabolic syndrome. Int J Cardiol. 2007;119:414-5.
- [CrossRef] [PubMed] [Google Scholar]
- Does LDL-C Estimation using Anandaraja's Formula give a better agreement with direct LDL-C estimation than the Friedewald's formula? Indian J Clin Biochem. 2012;27:127-33.
- [CrossRef] [PubMed] [Google Scholar]
- A direct measurement for LDL-cholesterol increases hypercholesterolemia prevalence: Comparison with Friedewald calculation. J UOEH. 2010;32:211-20.
- [CrossRef] [PubMed] [Google Scholar]
- Validation of the Friedewald formula in type II diabetes mellitus: An Indian perspective study. Int J Biomed Adv Res. 2015;6:103.
- [CrossRef] [Google Scholar]
- Assessing the validity of Friedewald's formula and Anandraja's formula for serum LDLcholesterol calculation. J Clin Diagn Res. 2015;9:C01-4.
- [CrossRef] [PubMed] [Google Scholar]
- Seven direct methods for measuring HDL and LDL cholesterol compared with ultracentrifugation reference measurement procedures. Clin Chem. 2010;56:977-86.
- [CrossRef] [PubMed] [Google Scholar]
- Validity of the conventional indirect methods including Friedewald method for determining serum low-density lipoprotein cholesterol level: Comparison with the direct homogeneous enzymatic analysis. J Occup Health. 2000;42:130-7.
- [CrossRef] [Google Scholar]
- Validation of the martin method for estimating low-density lipoprotein cholesterol levels in Korean adults: Findings from the Korea national health and nutrition examination survey, 2009-2011. PLoS One. 2016;11:e0148147.
- [CrossRef] [PubMed] [Google Scholar]


