
Translate this page into:
Prostate-Specific Antigen Density: A Measurement to Differentiate Benign Hypertrophy of Prostate from Prostate Carcinoma
Address for correspondence Purnima Rajkhowa, MD, Department of Microbiology, Silchar Medical College, Silchar 788014, Assam, (e-mail: chandankn01@rediffmail.com).
This article was originally published by Wolters Kluwer - Medknow and was migrated to Scientific Scholar after the change of Publisher.
Abstract
Background
Determination of isolated prostate-specific antigen (PSA) in asymptomatic individuals has not demonstrated sufficient sensitivity and specificity to be useful in the routine evaluation of prostate disease. To enhance the accuracy of serum PSA we have used a proportion of serum PSA and prostate volume, which we refer to as prostate-specific antigen density (PSAD). Prostate volume in this study was calculated using transrectal ultrasonography (TRUS).
Materials and Methods
A total of 106 patients with prostatic disease clinically confined to the prostate glands were evaluated.
Results and Observation
The mean PSAD for prostate cancer was 0.15 ± 0.01 while that for benign hypertrophy of the prostate (BPH) was 0.11 ± 0.02 (p < 0.05). Significant difference (p < 0.05) was noted in the prostate volume in these two groups with the mean prostate volume measured by TRUS in the BPH to be 53.85 ± 9.71 mL compared with 58.14 ± 7.48 mL in the carcinoma. PSA density of 0.13 ng/mL can be used as a cutoff for the individual in our set-up who should go for prostate biopsy with sensitivity and specificity of over 90%.
Conclusion
These results suggest that PSAD may be useful in distinguishing BPH and prostate cancer.
Keywords
prostate-specific antigen density
carcinoma
transrectal ultrasonography
benign hypertrophy

Introduction
With the aging of population globally, benign and malignant changes in the prostate are becoming increasingly common and prostate cancer is the second most common cancer in men. With such a high prevalence of these diseases, in 2017 approximately 161,260 prostate cancer cases were diagnosed, out of which 26,730 men died from prostate cancer in the United States.1 The overall age-adjusted prostate cancer incidence rates in India was 3.7/100,000 persons during the year 2008 with regional variation of 0.8 in the state of Manipur and 10.9/100,000 person-years in Delhi.2,3 These types of variation also exist in western countries with African American men having a high mortality rate of 43 per 100,000 in the period 2008 to 2011.3-5
There is a need to devise a reliable test for detecting early-stage prostate cancer without metastasis, for effective initiation of treatment.6,7 Majority of the prostate cancer patients at the time of diagnosis present with local invasion or metastasis.8 So, it is important to differentiate the benign hypertrophy of the prostate (BPH) from its malignant condition; the prostate cancer at the earliest should start with the effective treatment, thereby reducing the mortality as well as morbidity. The digital rectal examination (DRE) is a commonly followed procedure in routine clinical practice for prostate cancer detection. But DRE misses a significant number of cancers, including many early organ-confined tumors.6,8,9 Prostate-specific antigen (PSA), a kallikrein-related serine protease that was approved in 1994 for the detection of prostate cancer, has a controversial role. The American Cancer Society recommends the physicians to offer PSA testing and a DRE on an annual basis for men over the age of 50 using the criteria that have been evolved over time.6 Using the commonly used threshold of PSA for prostate biopsy, which is 4 ng/mL, many men with a PSA elevation beyond this do not have histologic evidence of prostate cancer at biopsy. So utmost care is required to select the individuals for prostate biopsy whenever the PSA ranges between 4 and 10 ng/mL, the next threshold for prostate cancer.10 To improve diagnostic accuracy of men with a PSA between 4 and 10 ng/mL, the gray area between BPH and carcinoma, different entities are being used, like PSA density (total serum PSA/prostate volume), prostate velocity (PSA doubling time), and percentage of free PSA (free PSA/total PSA).1 Considering the above facts, a diagnostic type of study using prostate biopsy as gold standard test was undertaken to know the sensitivity and specificity of the PSA density measurement by transrectal ultrasonography (TRUS) in patients of BPH suspected for carcinoma. The current study was conceived with the aim of investigating the sensitivity and specificity of prostate-specific antigen density (PSAD) measurement using biopsy as a gold standard test and also to estimate the cutoff PSAD in differentiating BPH from carcinoma.
Materials and Methods
Study Design and Sample Size
A hospital-based analytical cross-sectional study was performed.
Study Participants and Data Collection
A total of 106 patients with different urinary symptoms were recruited prospectively for the case group from September 2016 to August 2018 from the Urology Outpatient Department. All the recruited individuals were subjected to PSA and renal function test, urine analysis, and other metabolic profile to rule out any co-morbid condition. The exclusion criteria were urinary tract infection, prostatitis, urethral stricture, and co-morbid conditions like abnormal coagulation profile, uncontrolled diabetes mellitus, and electrolyte derangements. Cases with PSA above 2.6 ng/mL were advised for TRUS without including in the study group for their benefits. Individuals with PSA values between 4 and 9.99 ng/dL were included in the study and subjected to TRUS and prostate biopsy. TRUS was performed in the Department of Radiology and Imaging and biopsy was processed and reported by the Department of Pathology.
PSA was estimated by Beckman Coulter DXI immunoassay system using the principles of chemiluminescence which is an immunoenzymatic (“sandwich”) assay. In this procedure, a sample is added to a reaction vessel with mouse monoclonal anti-PSA alkaline phosphatase conjugate and paramagnetic particles coated with a second mouse monoclonal anti-PSA antibody. The PSA in the sample binds to the immobilized monoclonal anti-PSA on the solid phase. The monoclonal anti-PSA alkaline phosphatase conjugate reacts with a different antigenic site on the sample PSA. After incubation, materials bound to the solid phase are held in a magnetic field while unbound materials are washed away. Then the chemiluminescent substrate Lumi-Phos 530 is added to the vessel and light generated by the reaction is measured with a luminometer. The light production is directly proportional to the concentration of PSA in the sample. The amount of analyte in the sample is determined from a stored, multipoint calibration curve. Renal function test and metabolic profile were estimated by photometric principle using the Beckman Coulter AU 2700 System.
Statistical Analysis
The data were analyzed using SPSS 22.0 software (SPSS Inc.). Continuous data were presented as mean (with standard deviation) or median (with range) depending upon whether they were normally distributed or not. Subsequently, their comparisons among groups were performed by an unpaired t-test. In all calculations, a two-tailed p-value < 0.05 was regarded as statistically significant.
Ethics
The study was complied with the tenets of the Helsinki Declaration and was approved by the Institutional Ethics Committee. Voluntary informed written consent was procured from all the participants of the study.
Results
Dividing the 106 individuals that were included during the study with PSA values ranging between 4 and 9.99 ng/mL into two groups: BPH and carcinoma, it was observed that 54 out of 106 individuals that were subjected for biopsy were positive for carcinoma (►Table 1). Unpaired t-test was performed between the two groups BPH and carcinoma to find out for any significant difference with respect to PSA, free PSA, prostate volume, and PSA density (►Table 1). ►Fig. 1 shows the receiver operating characteristics (ROC) curve to find out the sensitivity and specificity of different parameters like PSA, free PSA, and prostate volume measurement by TRUS along with the area covered by the ROC curve. To find out the trend in PSA values in the subjects that were included during the study, a cross tabulation (►Table 2) was done between biopsy and dividing the 106 individuals into three groups based on PSA values, 4 and 5.99, 6 and 7.99, and 8 and 9.99 ng/mL. An ROC curve was constructed for PSA density to find out the sensitivity and specificity with area under the curve (►Fig. 2). ►Table 3 shows the sensitivity and specificity at the optimum to find out the threshold of PSA density beyond which all subjects with values higher than the threshold should go for biopsy.
| Parameter | BPH (n = 52) | Carcinoma (n = 54) | p-Value |
|---|---|---|---|
| PSA (ng/mL) | 5.59 ± 1.16 | 8.44 ± 0.86 | 1.98 (NS) |
| Free PSA (ng/mL) | 1.74 ± 0.58 | 0.72 ± 0.34 | 1.44 (NS) |
| Prostate volume (mL) | 53.85 ± 9.71 | 58.14 ± 7.48 | 0.0125 (significant) |
| Percentage PSA | 31.16 ± 8.83 | 8.44 ± 3.99 | 1.56 (NS) |
| PSA density (ng/mL) | 0.11 ± 0.02 | 0.15 ± 0.01 | 2.16 (NS) |
Abbreviations: BPH, benign hypertrophy of the prostate; NS, nonsignificant; PSA, prostate-specific antigen.
| Biopsy | Total | ||||
|---|---|---|---|---|---|
| BPH | Cancer | ||||
| PSA group | 4–5.99 ng/mL | Count | 36 | 0 | 36 |
| % within PSA group | 100.0% | 0.0% | 100.0% | ||
| % within biopsy | 69.2% | 0.0% | 34.0% | ||
| 6–7.99 ng/mL | Count | 14 | 19 | 33 | |
| % within PSA group | 42.4% | 57.6% | 100.0% | ||
| % within biopsy | 26.9% | 35.2% | 31.1% | ||
| 8–9.99 ng/mL | Count | 2 | 35 | 37 | |
| % within PSA group | 5.4% | 94.6% | 100.0% | ||
| % within biopsy | 3.8% | 64.8% | 34.9% | ||
| Total | Count | 52 | 54 | 106 | |
| % within PSA group | 49.1% | 50.9% | 100.0% | ||
| % within biopsy | 100.0% | 100.0% | 100.0% | ||
Abbreviations: BPH, benign hypertrophy of the prostate; PSA, prostate-specific antigen.
| Prostate density | Sensitivity | 1-Specificity |
|---|---|---|
| 0.1208 | 0.944 | 0.115 |
| 0.1241 | 0.944 | 0.096 |
| 0.1247 | 0.926 | 0.096 |
| 0.1252 | 0.926 | 0.077 |
| 0.1256 | 0.926 | 0.058 |
| 0.1273 | 0.926 | 0.038 |
| 0.1291 | 0.907 | 0.038 |
| 0.1304 | 0.889 | 0.038 |
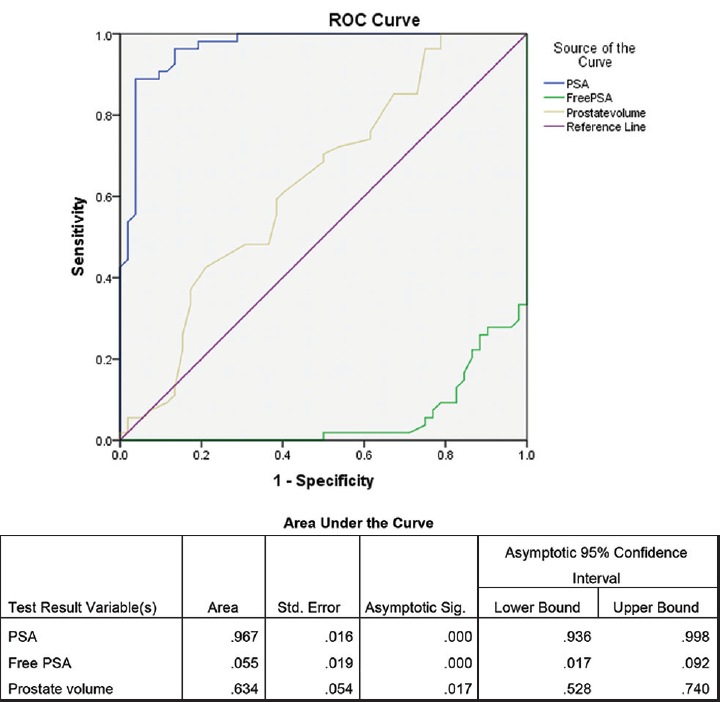
- ROC curve for PSA, prostate value, and free PSA with area under the curve in the study conducted during the period September 2016 to August 2018. PSA, prostate-specific antigen; ROC, receiver operating characteristics.
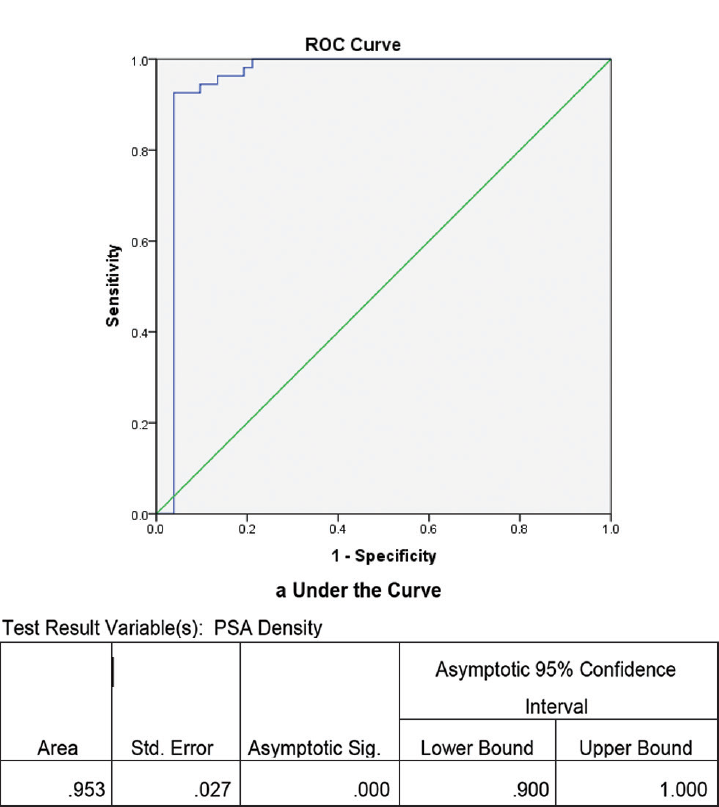
- ROC curve for PSA density with area under the curve in the study conducted during the period September 2016 to August 2018. PSA, prostate-specific antigen; ROC, receiver operating characteristics.
Discussion
Out of 106 individuals that were included in the study, 54 (50.9%) were biopsy positive. Mean PSA value in the BPH group was 5.59± 1.16 ng/mL, whereas prostate cancer group presented with the mean PSA value of 8.44 ±0.86 ng/mL. No significant difference (p = 1.98) was noted between these groups (►Tables 1 and 2). Also, there was no significant difference in free PSA, percentage of free PSA, and PSA density between the two groups of BPH and prostate cancer indicating that these parameters has nothing to do with the exposure variable. Mean PSA density was 0.11 ± 0.02 ng/mL in the BPH group and in the individuals with prostate cancer the mean value was 0.15 ± 0.01 ng/mL. Significant difference (p < 0.05) was noted in the prostate volume in these two groups with mean prostate volume by TRUS in the BPH to be 53.85 ± 9.71 mL compared with 58.14 ±7.48 mL in the carcinoma. The study conducted by Serdar et al in 2002 found no significant difference with respect to total PSA, free PSA, percentage of free PSA, and PSA density.11 Xie et al in 2018 reported that in their study, the overall prostate cancer was detected in 42% of the patients (362/862).12 In a study conducted by Tijani et al in the year 2017 at Urological Center, Lagos, no significant difference with respect to median PSA or prostate volume was found. However, they found a statistically significant difference with respect to the PSA density. In their study, median PSA density in the BPH group was 0.11 (0.03–0.32) ng/mL, whereas the median prostate density for the prostate cancer was 0.16 (0.02–0.55) ng/mL.13 This may be due to the fact that the PSA density is dependent on the size of the prostate which do not actually correlate to the occurrence of cancer. Literature shows that in the intermediate zone the occurrence of prostate cancer is higher in those individuals with low prostate volume.14-16
PSA was approved by Food and Drug Administration (FDA) for use in prostate screening way back in 1994 and it is the most commonly used parameter for prostate cancer screening in the United States.1,17,18 Catalona et al in a metacentric study done on 6,374 men of 50 years of age and older showed that 72% or (93/130) of prostate cancers detected by PSA and DRE were organ-confined indicating an early stage of cancer. The study conducted by Catalona et al also demonstrated that PSA testing in conjugation with DRE was more effective in detecting prostate cancer than DRE alone.14 Our study showed that that PSA is still a good marker for screening of prostatic pathology with area under curve (AUC) of 0.967 (►Fig. 1). Our finding in the study can be supported by the fact that a single PSA measured at age 60 is associated with AUC of 0.90. The major problem of estimating the serum PSA is that there might be elevated PSA in case of prostatitis or urinary tract infection (UTI) even in the procedure of prostatic biopsy.1 So care has to be taken in excluding these confounding factors. Dividing the individuals that were included in our study into three groups based on the PSA levels (►Table 2), it was found that highest occurrence of biopsy of positive prostate cancer (100%) in the group with serum PSA concentration is in the range of 8 to 9.99 ng/mL. This is an interesting finding in our study. The study conducted by Nam et al, with a patient population of 3,010 eligible men in the Prostate Centres of the University of Toronto concluded that serum PSA is one of the predictors for the presence of aggressive prostate cancer at diagnosis, which is a similar finding in accordance with our result.19 But the major issue with the PSA is the overdiagnosis with prostate cancer in men having early-stage clinically indolent disease. Unless the exclusion criteria are made stringent there is every possibility of men with benign diseases like UTI and hyperplasia being biopsied for prostate cancer.20,21
The AUC for prostate volume in our study was 63.4% indicating that prostate volume has an important role in deciding the individuals who should go for prostate biopsy (►Fig. 1). There exist many studies which included prostate volume as a component of nomogram for prostate cancer screening along with percentage of free PSA, PSA density, and age.22 ►Fig. 2 shows the ROC curve for the PSA density measurement by TRUS in our study with an AUC of 0.953 (95% confidence interval 0.9–1.0). This finding shows that PSA density measurement by TRUS is good enough in predicting the occurrences of prostate cancer in our study group. PSA density provides a reliable indication to go for biopsy to those individuals suspected for carcinoma. The study by Serdar et al reported that the AUC for PSA density was 0.631.11 On the other hand, Xie et al reported an AUC of 0.796 in their study conducted on 862 individuals for PSA density.12 PSA density is very much useful in differentiating BPH and prostate carcinoma in the gray zone of serum PSA between 4 and 10 ng/mL.11,23 While measuring the PSA density it is to be noted that PSA density is dependent on the serum PSA level. Normal serum PSA range varies according to age, race, and different geographical location.24 So a nomogram designed in western set-up to detect prostate cancer may not work on Asian population.22 This is applicable to our population also which is a part of Northeast India. One of our objectives of the study was to find out the cutoff of PSA density for our set-up. ►Table 3 shows the sensitivity and specificity of PSA density measurement by TRUS at the optimum. From this table it is evident that PSA density of 0.13 ng/mL can be used as a cutoff for the individual in our set-up who should go for prostate biopsy with sensitivity and specificity of over 90%.
Limitation of the Study
This was a small sample size, hospital-based cross sectional study. A well-designed follow-up study with higher sample size is required.
Conclusion
In summary, PSAD is a simple, inexpensive, and good tool that can be used to differentiate BPH from prostate cancer in the gray zone of serum PSA between 4 and 10 ng/mL and PSAD of 0.13 ng/mL can be used as a cutoff for our set-up. If validated, it can be used to identify men who can likely forego prostate biopsies, thus reducing the over detection and morbidity of unnecessary biopsies.
Conflict of Interest
None declared.
Funding
This study was funded by an intramural research grant received from the North Eastern Indira Gandhi Regional Institute of Health and Medical sciences (NEIGRIHMS), Shillong (NEIGR-Esst-I/7/2016).
Reference
- Benign and malignant diseases of the prostate. In: Kasper DL, Fauci AS, Hauser SL, Longo DL, Larry JJ, Loscaizo J, eds. Harrison's Principles of Internal Medicine (20th). New York, NY: McGraw-Hill Education; 2018. p. :796-805.
- [Google Scholar]
- Demography and disease characteristics of prostate cancer in India. Indian J Urol. 2016;32(02):103-108.
- [CrossRef] [PubMed] [Google Scholar]
- Stage at diagnosis and relative differences in breast and prostate cancer incidence in India: comparison with the United States. Asian Pac J Cancer Prev. 2006;7(04):547-555.
- [Google Scholar]
- The surveillance, epidemiology, and end results (SEER) program of the National Cancer Institute. Cancer. 2014;120(Suppl. 23):3755-3757.
- [CrossRef] [PubMed] [Google Scholar]
- SEER Cancer Statistics Review, 1975–2009 (Vintage 2009 Populations) Bethesda, MD: National Cancer Institute; 2012. Available at: https://seer.cancer.gov/archive/csr/1975_2008/. Accessed May 19, 2019
- [Google Scholar]
- Prediction of significant prostate cancer diagnosed 20 to 30 years later with a single measure of prostate-specific antigen at or before age 50. Cancer. 2011;117(06):1210-1219.
- [CrossRef] [PubMed] [Google Scholar]
- Why make an early diagnosis of prostate cancer. J Urol. 1992;147(3 Pt 2):853-854.
- [CrossRef] [PubMed] [Google Scholar]
- PLCO Project Team. Mortality results from a randomized prostate-cancer screening trial. N Engl J Med. 2009;360(13):1310-1319.
- [CrossRef] [Google Scholar]
- Prostate volumetric assessment by magnetic resonance imaging and transrectal ultrasound: impact of variation in calculated prostate-specific antigen density on patient eligibility for active surveillance program. J Comput Assist Tomogr. 2013;37(04):589-595.
- [CrossRef] [PubMed] [Google Scholar]
- Relationship of chronic histologic prostatic inflammation in biopsy specimens with serum isoform [-2]proPSA (p2PSA), %p2PSA, and prostate health index in men with a total prostate-specific antigen of 4-10 ng/ml and normal digital rectal examination. Urology. 2014;83(03):606-612.
- [CrossRef] [PubMed] [Google Scholar]
- Diagnostic approach to prostate cancer using total prostate specific antigen-based parameters together. Ann Clin Lab Sci. 2002;32(01):22-30.
- [Google Scholar]
- A nomogram based on a TRUS Five-grade scoring system for the prediction of prostate cancer and high grade prostate cancer at initial TRUS-Guided Biopsy. J Cancer. 2018;9(23):4382-4390.
- [CrossRef] [PubMed] [Google Scholar]
- The role of the percentage free PSA in the diagnosis of prostate cancer in Blacks: findings in indigenous West African men using TRUS guided biopsy. Afr J Urol. 2017;23(01):14-19.
- [CrossRef] [Google Scholar]
- Evaluation of percentage of free serum prostate-specific antigen to improve specificity of prostate cancer screening. JAMA. 1995;274(15):1214-1220.
- [CrossRef] [PubMed] [Google Scholar]
- Percent free prostate specific antigen and cancer detection in black and white men with total prostate specific antigen 2.5 to 9.9 ng/ml. J Urol. 2000;163(05):1467-1470.
- [CrossRef] [PubMed] [Google Scholar]
- The value of percentage free prostate specific antigen (PSA) in the detection of prostate cancer among patients with intermediate levels of total PSA (4.0-10.0 ng/mL) in Nigeria. Arab J Urol. 2012;10(04):394-400.
- [CrossRef] [PubMed] [Google Scholar]
- Prostatic acid phosphatase in 1993. Its limited clinical utility. Urol Clin North Am. 1993;20(04):589-595.
- [CrossRef] [PubMed] [Google Scholar]
- Comparison of digital rectal examination and serum prostate specific antigen in the early detection of prostate cancer: results of a multicenter clinical trial of 6,630 men. J Urol. 1994;151(05):1283-1290.
- [CrossRef] [PubMed] [Google Scholar]
- Assessing individual risk for prostate cancer. J Clin Oncol. 2007;25(24):3582-3588.
- [CrossRef] [PubMed] [Google Scholar]
- Beyond PSA: the next generation of prostate cancer biomarkers. Sci Transl Med. 2012;4(127) 127rv3
- [CrossRef] [PubMed] [Google Scholar]
- Impact of screening on incidence and mortality of prostate cancer in the United States. Epidemiol Rev. 2001;23(01):181-186.
- [CrossRef] [PubMed] [Google Scholar]
- Nomogram using transrectal ultrasound-derived information predicting the detection of high grade prostate cancer on initial biopsy. Prostate Int. 2013;1(02):69-75.
- [CrossRef] [PubMed] [Google Scholar]
- Evaluating PSA density as a predictor of biochemical failure after radical prostatectomy: results of a prospective study after a median follow-up of 36 months. ISRN Urol. 2013;2013 984951
- [CrossRef] [PubMed] [Google Scholar]
- Biomarkers in localized prostate cancer. Future Oncol. 2016;12(03):399-411.
- [CrossRef] [PubMed] [Google Scholar]


