
Translate this page into:
Short term antibiotic effects on gut microbiome in Indian preschoolers: A 16S rRNA analysis
 , Ashish Bavdekar2, Anand Kawade3, Krishna Chaitanya Veligandla1, Devesh Kumar Joshi4, Rahul Rathod1, Bhavesh Kotak1
*Corresponding author: Dr. Neha, Department of Medical Affairs, Dr. Reddy`s Laboratories, Hyderabad, Telangana, India. neha2@drreddys.com
-
Received: ,
Accepted: ,
How to cite this article: Neha, Bavdekar A, Kawade A, Veligandla KC, Joshi DK, Rathod R, et al. Short term antibiotic effects on gut microbiome in Indian preschoolers: A 16S rRNA analysis. J Lab Physicians. 2024;16:7-18. doi: 10.25259/JLP_6_2023
Abstract
Objectives:
Antibiotic use is associated with dysbiosis of the gut microbiome. The objective of this study is to investigate the effect of antibiotics on gut composition in children aged 3–5 years receiving antibiotics compared to children who did not receive antibiotics.
Materials and Methods:
A total of 54 participants aged 3–5 years were included in this multi-centric cohort study. Participants were divided into two equal groups, that is the treatment-experienced group (Group 1, n = 27, antibiotic) and the treatment-not-experienced group (Group 2, n = 27, non-antibiotic). Stool samples of study participants were collected on days 0 and 5 (± 1 day) and analyzed using 16Svedberg ribosomal ribonucleic acid (16S rRNA) gene sequencing.
Statistical Analysis:
The Kruskal-Wallis H-test and Benjamini-Hochberg FDR correction were applied to determine the differentially abundant pathways across the zones using Statistical Analysis of Metagenomic Profiles (STAMP) (v2.1.3).
Results:
A non-significant increase in the mean abundance of the Phyla Bacteroidota, Proteobacteria, Actinobacteria, and Verrucomicrobiota was observed in both groups from day 0 to day 5. An alteration in the Firmicutes/Bacteroidetes ratio was observed. A significant (P < 0.05) abundance of genus Enterobacteriaceae, Enterococcaceae, and Lactobacillaceae was observed in the participants with antibiotic treatment. The relative abundance of families Enterococcus, Lactobacillus, Sellimonas, Ruminococcus, Torques, and Eggerthella groups was observed to be significantly higher (P < 0.05) in participants with antibiotic treatment. Beta-diversity indices revealed significant differences at group and subgroup levels regarding the bacterial counts.
Conclusions:
It was observed that a short-term course of 5 days of antibiotic usage is associated with altered microbial abundance and diversity.
Keywords
Antibiotics
Dysbiosis
Early childhood
Gene sequencing
Gut microbiomes
Stool samples

INTRODUCTION
The oral cavity, skin, and intestine of humans are inhabited by 1000 trillion microbiomes.[1] The collection of microbiomes colonizing the gut is known as “gut microbiota”[2] that forms a densely populated “mini ecosystem.”[3] It is a microbial ecosystem where a diverse group of organisms live in close proximity to each other, interacting and influencing complex changes. Out of 55 phyla in the human body, the majority of the gut bacteria belong to the Bacteroidetes, Firmicutes, Proteobacteria, Actinobacteria, Fusobacteria, and Verrucomicrobia.[4] An important characteristic feature of the intestinal microbiome is the composition of microbiota and the metagenome that remains largely unaffected irrespective of the type of food intake.[3] Gut microbes are gaining importance due to their functions of stimulating host immune development, nutrient metabolism, differentiation of mucosal structure,[3] maintaining intestinal mucosal barrier by enhancing gut integrity, formation of the intestinal epithelium, and protection against pathogens, providing anti-inflammatory signals to the host,[2] and are necessary for the maintenance of intestinal homeostasis.[5]
The role of microbiomes is crucial during early life as the changes in relation to the composition and the abundance of microbiomes become more or less stable, remain the same throughout life, and dictate the health of the host.[5] Various internal and external factors influence the gut microbiota, starting from birth to adulthood.[3] The human fecal microbiota consists of four main groups of bacteria (phyla), that are Firmicutes, Bacteroidetes, Proteobacteria, and Actinobacteria, of which the first two bacteria account for more than 80% of the microbiota. Firmicutes comprise mostly of Gram-positive bacteria, while Bacteroidetes include Gram-negative bacteria; Proteobacteria consist of Gram-negative bacteria and includes a wide variety of well-studied pathogens. Actinobacteria are a group of Gram-positive bacteria.[6] The Firmicutes phylum is composed of Lactobacillus, Bacillus, Clostridium, Enterococcus, and Ruminococcus. Bacteroidetes phylum comprises four classes: Bacteroidia, Flavobacteria, Sphingobacteria, and Cytophagia.[7]
There has been a rapid rise in the use of antibiotics for various diseases among adults and children.[8] Infants, toddlers, and preschool children are usually treated with oral/intravenous antibiotics (e.g., penicillins, cephalosporins, and macrolides), due to their health conditions.[9] Antibiotics disrupt the composition of the gut microbiota,[10] affect the normal maturation of the microbiome, destabilizes it, and alter the basic physiological equilibria.[11] Studies on the effect of exposure to antibiotics show that the abundance and diversity of intestinal microbiota are affected irrespective of which type of antibiotics are used.[12] Early antibiotic exposure reduces microbiome composition and diversity with a marked reduction in Bifidobacterium and increases in Proteobacterium levels. Over time, when antibiotic treatment is stopped, the intestinal microbiota shows great resilience and returns to a composition like the original one, but it’s not fully recovered in most cases.[13]
Several studies have demonstrated the impact of antibiotic usage on gut dysbiosis in adults, neonates, and infants. However, the short-term effect of antibiotics on gut dysbiosis in children is poorly understood.[6] Therefore, this study aims to investigate the effect of antibiotics on gut composition in children aged 3–5 years receiving antibiotics compared to children who did not receive antibiotics.
MATERIALS AND METHODS
Study design
A multi-centric cohort study was conducted at two sites in Pune, India. This study was conducted to investigate the impact of a short-term course of 5 days of antibiotic usage on gut microbiota and the differences in gut microbiota composition of participants receiving antibiotics compared to participants who did not.
Enrolled subjects
A total of 54 participants aged 3–5 years were screened and enrolled in this study, as the gut microbiota remains relatively stable within this age group. Participants were divided into two groups. In Group 1, there were 27 treatment-experienced participants who had an initial 1–2 days of IV antibiotics followed by oral antibiotics to treat infections for 5 days or more. In Group 2, there were 27 treatment-not-experienced participants who attended clinics for vaccinations, and non-infectious diseases were included in the study. Participants excluded from the study were those who had a medical history of any acute childhood illness in the past week, chronic illness, neonatal intensive care unit or pediatric intensive care unit admission, or history of drug intake in the past 3 months, including antibiotics, proton-pump inhibitors, and probiotics.
Sample collection
Stool samples from participants were collected on days 0 and 5 (± 1 day) of recruitment in outpatient and inpatient settings. After receiving antibiotics, stool samples were collected within 72 h of the completion of the antibiotic course. All the samples were collected in a 50 mL sterile falcon tube and stored at −80°C immediately. No preservative was used. All the samples were shipped in dry ice and sent for microbial analysis to determine differences in the gut composition of both groups.
Instruments/procedure
Microbial community analyses
Genomic deoxyribonucleic acid extraction
In this study, targeted metagenomics (amplicon) sequencing and bioinformatics services were used to analyze the stool samples. The total genomic Deoxyribonucleic acid (DNA) was extracted from 108 samples (54 participants) using 16Svedberg ribosomal ribonucleic acid (16S rRNA) gene amplicon sequencing (Illumina MiSeq technology). To ensure quality and quantity prerequisites for targeted metagenomics (amplicon) sequencing Genomic deoxyribonucleic acid (gDNA) including 500 ng (minimum 20 ng/mL conc.) of community DNA, absorbance ratio (A260/280) of 1.8–2.0 and shipment of samples in cool pack were addressed.
Sequence processing and microbial community analysis
Quality trimming and adapter clipping of the Illumina sequences were done using Trimmomatic-0.38 paired end mode.[14] The trimmed and adapter free FASTQs were imported using quantitative insights into microbial ecology (QIIME) 2-2022.2 import tools.[15] Assembly of forward and reverse reads for each sample was carried out using vsearch join-pairs in qiime2.[16] Denoising the reads into amplicon sequence variants (ASVs) was done using deblur. Taxonomy was assigned to the ASVs with the SILVA138 database.[17] All possible contaminants were filtered out, including mitochondria, chloroplast, Eukaryota, and unassigned ASVs. A rooted phylogenetic tree was generated using FastTree and multiple alignment with fast fourier transform (MAFFT) and used in calculating phylogenetic diversity metrics. Data from QIIME 2 were analyzed and tested using various statistical packages, including “Phyloseq,”[18] “DESeq2,”[19] and “Vegan”[20] in R v.3.4.2. Alpha and beta diversity calculations were done using the tools for microbiome analysis in R.[21] Alpha diversity indices, including Shannon diversity and Chao, were calculated and analyzed using the Wilcoxon test to compare various sample types. Beta diversity was assessed using the Bray– Curtis distance matrix and depicted in a principal coordinate analysis (PCoA) plot. Detection of the differentially abundant phyla and genera across the samples was done using analysis of variance in GraphPad Prism ver. 9.0.
The differentially abundant phyla and genera were detected across the different sample categories by applying the Kruskal–Wallis H-test and Benjamini–Hochberg false discovery rate (FDR) correction using statistical analysis of metagenomic profiles (STAMP) (v2.1.3).
Metagenome-functional predictions and statistical analysis
Phylogenetic investigation of communities by reconstruction of unobserved states (PICRUSt2) tool was used to analyze the metabolic potential of the microbial community[22] that predicts functional abundances based on marker gene sequences. The final output tables produced by PICRUSt2 represent the read depth per ASV multiplied by the predicted function abundances per ASV. The data were transformed to relative abundance before applying any statistical analysis. The relative abundance of identified pathways was compared across different zones and subzones.
Ethical aspects
The study was reviewed and approved by the Institutional Ethics Committee of KEM Hospital Research Center Pune (KEMHRC ID No. 2106). The ICMR’s Ethical Guidelines for Biomedical and Health Research on human participants (2017) were followed. Written informed consent was obtained from the parents of each participant before recruitment.
Statistics
The Kruskal–Wallis H-test and Benjamini–Hochberg FDR correction were applied to determine the differentially abundant pathways across the zones using STAMP (v2.1.3). The predicted genes with a significant difference in their relative abundance (P < 0.05) were plotted in a heatmap matrix in the R package pheatmap (version 1.0.12).
RESULTS
A total of 54 participants aged 3–5 years were included in the study, with 27 participants in Group 1 (treatment-experienced) and 27 participants in Group 2 (treatment-not-experienced). A total of 108 stool samples were collected from both groups on Day 0 (54 samples) and Day 5 (54 samples). All these samples were analyzed using 16S RNA gene amplicon sequencing.
Baseline demographics: In Group 1, 15 male and 12 female participants were included with a mean age of 46.4 months, whereas in Group 2, 16 male and 11 female participants were included with a mean age of 46.4 months.
The minimum and maximum gestational ages at birth between the two groups are between 37 and 40 weeks. About 40.7% of participants in Group I and 44.4% of participants in Group II had received breastfeeding. Participants having a normal diet in Group 1 and Group 2 are 33.3% and 30%, respectively. Normal vaginal delivery birth rates in Group 1 and II were 52% and 63%, respectively. In the 1st year of life, only 3.7% of Group 1 participants and 14.8% of Group 2 participants had received antibiotics. In the 2nd year, participants who received antibiotics in Group 1 and Group 2 were 48.1% and 40.7%, respectively. About 48.1% participants in Group 1 and 44.4% participants in Group 2 had received antibiotics at ages > 2 years.
The data have been categorized and analyzed at day 0 and day 5 for both males and females separately between the two groups. At the phyla level, the mean relative abundance of Bacteroidota and Firmicutes in both breast-feed and nonbreastfeed participants was P = 0.1728, P = 0.1292, P = 0.1212, and P = 0.9663, respectively, which was statistically less significant [Table 1]. A statistically significant difference was observed between the treatment-experienced and treatment-not-experienced groups on the mean relative abundance of Bacteroidota (P = 0.0496) and Verrucomicrobiota (P = 0.0291), while a less significant difference was seen in Firmicutes (P = 0.2795) [Table 2].
| Feeding | Mean relative abundance (%) | ||
|---|---|---|---|
| Treatment-experienced (n=27) n, mean | Treatment-not-experienced (n=27) n, mean | P-values | |
| Breast-feed (n=23) | |||
| Phylum | |||
| Bacteroidota | 11, 16.315 | 12, 21.699 | 0.1728 |
| Firmicutes | 11, 19.849 | 12, 15.197 | 0.1292 |
| Family | |||
| Enterobacteriaceae | 11, 0.043 | 12, 0.018 | 0.401 |
| Enterococcaceae | 11, 0.018 | 12, 0.000 | 0.0068 |
| Genus level | |||
| Escherichia-Shigella | 11, 5.773 | 12, 2.333 | 0.6228 |
| Enterococcus | 11, 1.818 | 12, 0.000 | 0.0068 |
| Non-breastfeed (n=31) | |||
| Phylum | |||
| Bacteroidota | 16, 12.483 | 15, 16.317 | 0.1212 |
| Firmicutes | 16, 22.736 | 15, 21.710 | 0.9663 |
| Family | |||
| Enterobacteriaceae | 16, 0.261 | 15, 0.059 | 0.0016 |
| Enterococcaceae | 16, 0.113 | 15, 0.027 | 0.0162 |
| Genus level | |||
| Escherichia-Shigella | 16, 37.344 | 15, 7.100 | 0.0011 |
| Enterococcus | 16, 16.094 | 15, 3.767 | 0.0141 |
| Phylum | Mean relative abundance (%) | ||
|---|---|---|---|
| Treatment-experienced | Treatment-not-experienced | P-values | |
| Bacteroidota | 14.044 | 18.709 | 0.0496 |
| Verrucomicrobiota | 0.822 | 1.414 | 0.0291 |
| Firmicutes | 21.559 | 18.815 | 0.2795 |
It was evident from the plot Figure 1 that there was a non-significant increase in the mean abundance of Bacteroidota, Proteobacteria, Actinobacteria, and Verrucomicrobiota in both groups from day 0 to day 5.
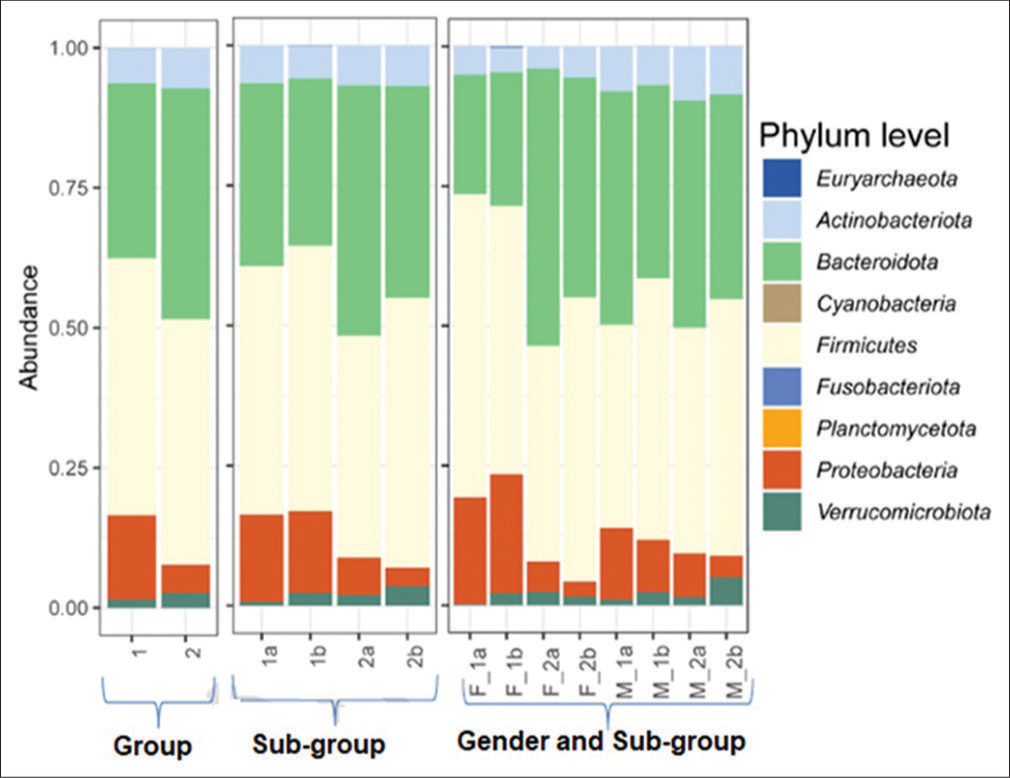
- Relative abundance of phyla assigned to fecal microbiome of treatment-experienced and treatment-not-experienced participants on day 0 and day 5. Group 1 comprises treatment-experienced participants and group 2 comprises treatment-not-experienced participants. (1a) Subgroup treatment-experienced at day 0, (1b) subgroup experienced at day 5, (2a) subgroup treatment-not-experienced at day 0, and (2b) subgroup treatment-not-experienced at day 5. (F_1a) Treatment-experienced females at day 0, (F_1b) treatment-experienced females at day 5, (F_2a) treatment-not-experienced females at day 0, (F_2b) treatment-not-experienced females at day 5, (M_1a) treatment-experienced males at day 0, (M_1b) treatment-experienced males at day 5, (M_2a) treatment-not-experienced males at day 0, and (M_2b) treatment-not-experienced males at day 5 (M_2b).
A mean relative increase in Firmicutes abundance was observed in both groups, more pronounced in Group 2 compared to Group 1.
At the phylum level, the mean relative abundance of Firmicutes was 1a < 1b, whereas that of Bacteroidota was 1b < 1a [Table 3] and sub categorization [Table 4].
| Phylum | Mean relative abundance (%) | ||||
|---|---|---|---|---|---|
| 1a | 1b | 2a | 2b | P-values | |
| Bacteroidota | 14.063 | 14.024 | 20.503 | 16.913 | 0.1743 |
| Verrucomicrobiota | 0.299 | 1.345 | 1.025 | 1.802 | 0.0722 |
| Firmicutes | 21.180 | 21.937 | 16.954 | 20.675 | 0.4562 |
1a: Sub-group treatment-experienced at day 0; 1b: Sub-group treatment-experienced at day 5; 2a: Sub-group treatment-not-experienced at day 0; 2b: Sub-group treatment-not-experienced at day 5
| Phylum | F_1a | F_1b | F_2a | F_2b | M_1a | M_1b | M_2a | M_2b | P-values |
|---|---|---|---|---|---|---|---|---|---|
| Bacteroidota | 8.137 | 10.563 | 22.087 | 16.583 | 18.804 | 16.793 | 19.236 | 17.177 | 0.0747 |
| Verrucomicrobiota | 0.086 | 1.338 | 1.467 | 0.478 | 0.469 | 1.351 | 0.672 | 2.861 | 0.2513 |
| Firmicutes | 27.529 | 23.815 | 16.442 | 20.626 | 16.102 | 20.435 | 17.364 | 20.715 | 0.4977 |
F_1a : Treatment-experienced females at day 0; F_1b: Treatment-experienced females at day 5; F_2a: Treatment-not-experienced females at day 0; F_2b: Treatment-not-experienced females at day 5; M_1a: Treatment-experienced males at day 0; M_1b: Treatment-experienced males at day 5; M_2a: Treatment-not-experienced males at day 0; M_2b: Treatment-not-experienced males at day 5
At the family level, the mean relative abundance of Enterobacteriaceae in breast-feed participants was P = 0.401, which was statistically not significant; whereas non-breastfeed participants, it was P = 0.0016, which was statistically significant. The mean relative abundance of Enterococcaceae in both breast-feed and non-breastfeed participants was P = 0.0068, and P = 0.0162, respectively, which was statistically significant [Table 1].
Figure 2 and Table 5 revealed an increase in the relative abundance of Enterobacteriaceae, Enterococcaceae, and Peptostreptococcaceae on day 5 over day 0 of sample collection in participants with antibiotic treatment. A significant decrease in the relative abundance of Lactobacillaceae was observed in Group 1 from day 0 to day 5.
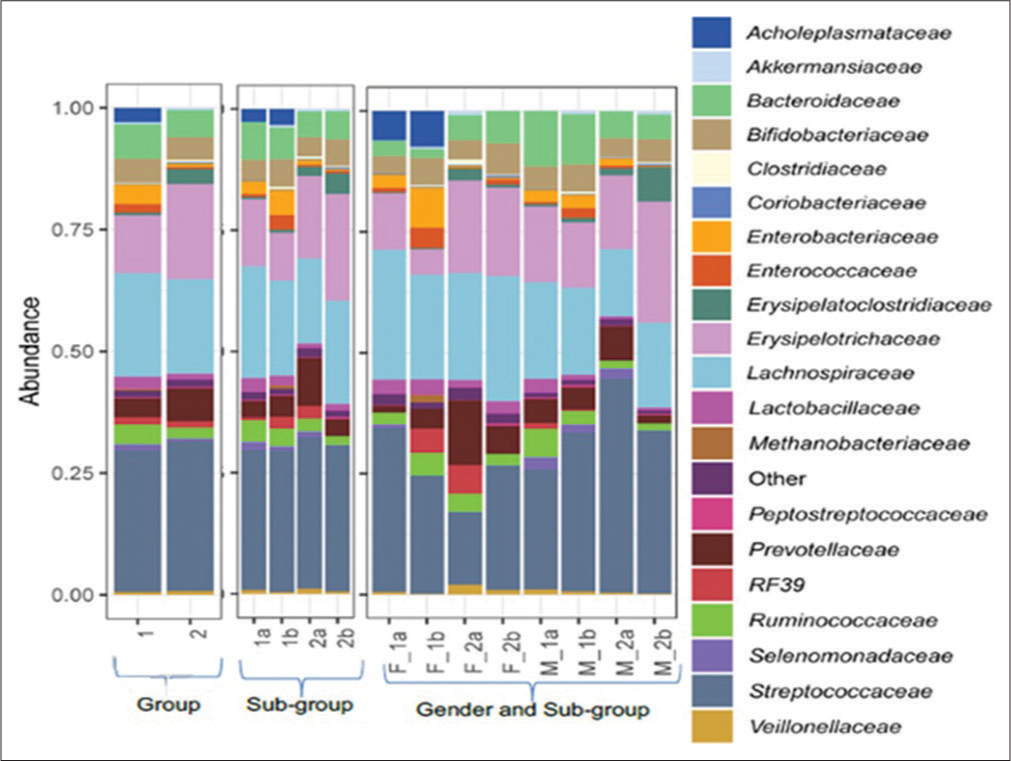
- Relative abundance of family level assignments of the fecal microbiome of treatment-experienced and treatment -not-experienced female and male participants on zero and fifth day of sampling. Group 1 comprises treatment-experienced participants and group 2 comprises treatment-not-experienced participants. (1a) Subgroup treatment-experienced at day 0, (1b) subgroup treatment-experienced at day 5, (2a) subgroup treatment-not-experienced at day 0, and (2b) subgroup treatment-not-experienced at day 5. (F_1a) Treatment-experienced females at day 0, (F_1b) treatment-experienced females at day 5, (F_2a) treatment-not-experienced females at day 0, (F_2b) treatment-not-experienced females at day 5, (M_1a) treatment-experienced males at day 0, (M_1b) treatment-experienced males at day 5, (M_2a) treatment-not-experienced males at day 0, and (M_2b) treatment-not-experienced males at day 5.
| Family | Mean relative abundance (%) | ||
|---|---|---|---|
| Treatment-experienced | Treatment-not-experienced | P-values | |
| Enterobacteriaceae | 0.172 | 0.041 | 0.028 |
| Enterococcaceae | 0.075 | 0.015 | 0.001 |
| Lactobacillaceae | 0.124 | 0.075 | 0.003 |
| Prevotellaceae | 0.162 | 0.360 | 0.035 |
A statistically significant (P < 0.05) increase in the relative abundance of Enterococcaceae and Peptostreptococcaceae is observed in Group 1 from day 0 to day 5. A similar increase was observed in the relative abundance in Group 2. However, the increase in Enterococcaceae was less in participants without antibiotics when compared to participants on antibiotics.
At the family level, the mean relative abundance of Enterococcaceae was 1a < 1b, whereas that of Lactobacillaceae was 1b < 1a [Table 6] and subcategorization [Table 7].
| Family | Mean relative abundance (%) | ||||
|---|---|---|---|---|---|
| 1a | 1b | 2a | 2b | P-values | |
| Enterococcaceae | 0.0394 | 0.1097 | 0.0125 | 0.0171 | 0.001 |
| Lactobacillaceae | 0.1704 | 0.0778 | 0.0646 | 0.0854 | 0.033 |
| Peptostreptococcaceae | 0.0102 | 0.0113 | 0.0107 | 0.0287 | 0.022 |
1a: Sub-group treatment-experienced at day 0; 1b: Sub-group treatment-experienced at day 5; 2a: Sub-group treatment-not-experienced at day 0; 2b: Sub- group treatment-not-experienced at day 5
| Family | F_1a | F_1b | F_2a | F_2b | M_1a | M_1b | M_2a | M_2b | P-values |
|---|---|---|---|---|---|---|---|---|---|
| Enterococcaceae | 0.0531 | 0.1474 | 0.0026 | 0.0255 | 0.0283 | 0.0796 | 0.0204 | 0.0104 | 0.015 |
| Lactobacillaceae | 0.2026 | 0.1214 | 0.0995 | 0.1380 | 0.1446 | 0.0429 | 0.0367 | 0.0433 | 0.019 |
| Peptostreptococcaceae | 0.0063 | 0.0005 | 0.0073 | 0.0406 | 0.0133 | 0.0200 | 0.0133 | 0.0192 | 0.012 |
F_1a: Treatment-experienced females at day 0; F_1b: Treatment-experienced females at day 5; F_2a: Treatment-not-experienced females at day 0; F_2b: Treatment-not-experienced females at day 5; M_1a: Treatment-experienced males at day 0; M_1b: Treatment-experienced males at day 5; M_2a: Treatment-not-experienced males at day 0; M_2b: Treatment-not-experienced males at day 5
The mean relative abundance of Escherichia-Shigella at genus level in breast-feed participants was P = 0.6228, which was statistically non-significant; whereas non-breastfeed participants, it was P = 0.0011, which was statistically significant. The mean relative abundance of Enterococcaceae in both breast-feed and non-breastfeed participants was P = 0.0068, and P = 0.0141, respectively, which was statistically significant [Table 1].
A significant decline was observed in the relative abundance of Lactobacillus from day 0 to day 5 in Group 1, while it increased from day 0 to day 5 in Group 2. The relative abundance of Enterococcus increased significantly from day 0 to day 5 in Group 1.
The relative abundance of Bifidobacterium increased from day 0 to day 5 in Group 1 and Group 2 participants. However, these changes are not statistically significant.
At the Genus level, the mean relative abundance of Enterococcus was 1a < 1b, whereas Lactobacillus was 1b < 1a [Figure 3 and Tables 8-10].
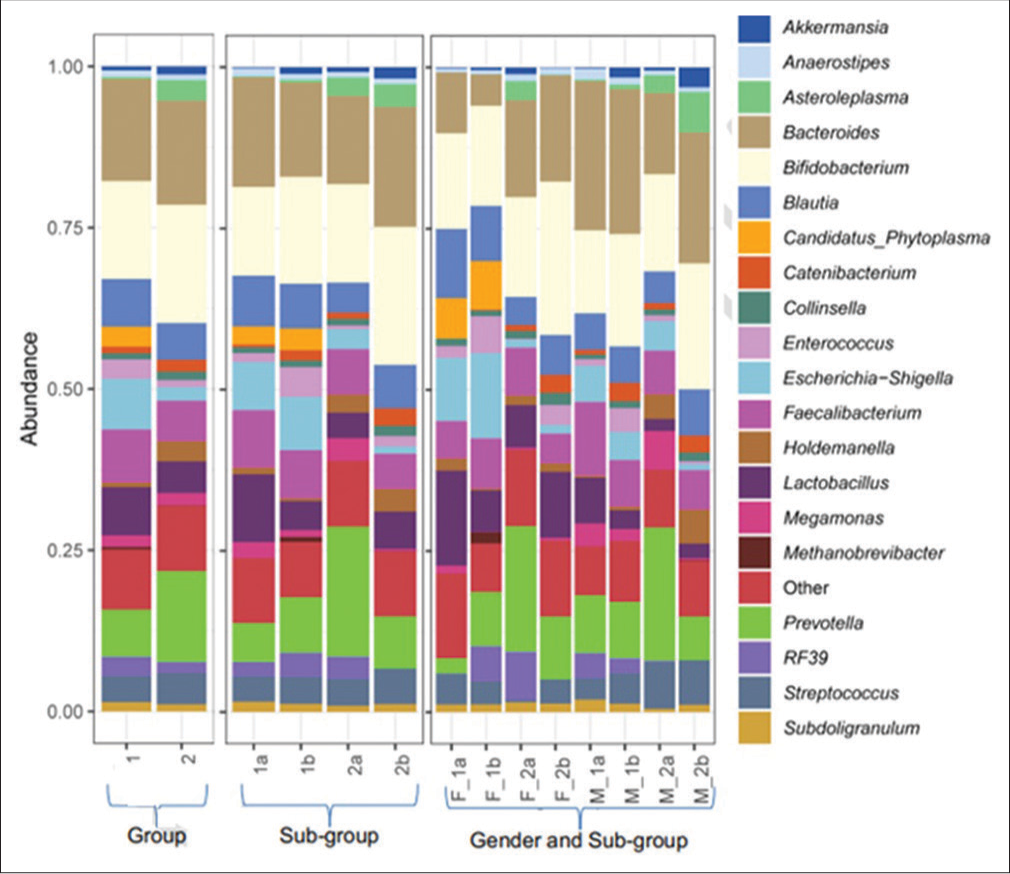
- Relative abundance of genus level assignments of the fecal microbiome of treatment-experienced and treatment-not -experienced female and male participants on zero and fifth day of sampling. Group 1 comprises treatment-experienced participants and group 2 comprises treatment-not-experienced participants. (1a) Subgroup treatment-experienced at day 0, (1b) subgroup treatment-experienced at day 5, (2a) subgroup treatment-not-experienced at day 0, and (2b) subgroup treatment-not-experienced at day 5. (F_1a) Treatment-experienced females at day 0, (F_1b) treatment-experienced females at day 5, (F_2a) treatment-not-experienced females at day 0, (F_2b) treatment-not-experienced females at day 5, (M_1a) treatment-experienced males at day 0, (M_1b) treatment-experienced males at day 5, (M_2a) treatment-not-experienced males at day 0, and (M_2b) treatment-not-experienced males at day 5.
| Genus | Mean relative abundance (%) | ||
|---|---|---|---|
| Treatment-experienced | Treatment-not-experienced | P-values | |
|
Ruminococcus torques group |
0.0008 | 0.0000 | 0.0227 |
| Dialister | 0.0078 | 0.0137 | 0.0193 |
| Eggerthella | 0.0020 | 0.0002 | 0.0150 |
| Enterococcus | 0.0642 | 0.0131 | 0.0010 |
| Escherichia-Shigella | 0.1530 | 0.0311 | 0.0138 |
| Lactobacillus | 0.1236 | 0.0750 | 0.0033 |
| Prevotella | 0.0999 | 0.2368 | 0.0367 |
| Ruminococcus | 0.0021 | 0.0049 | 0.0051 |
| Sellimonas | 0.0014 | 0.0000 | 0.0425 |
| Senegalimassilia | 0.0003 | 0.0016 | 0.0457 |
| Genus | Mean relative abundance (%) | ||||
|---|---|---|---|---|---|
| 1a | 1b | 2a | 2b | P-values | |
| Enterococcus | 0.035 | 0.093 | 0.010 | 0.016 | 0.002 |
| Lactobacillus | 0.170 | 0.077 | 0.065 | 0.085 | 0.034 |
| Ruminococcus | 0.003 | 0.002 | 0.003 | 0.007 | 0.015 |
1a: Sub-group treatment-experienced at day 0; 1b: Sub-group treatment- experienced at day 5; 2a: Sub-group treatment-not-experienced at day 0; 2b: Sub- group treatment-not-experienced at day 5
| Genus | F_1a | F_1b | F_2a | F_2b | M_1a | M_1b | M_2a | M_2b | P-values |
|---|---|---|---|---|---|---|---|---|---|
| (Ruminococcus)_torques_group | 0.003 | 0.000 | 0.000 | 0.000 | 0.000 | 0.001 | 0.000 | 0.000 | 0.013 |
| Eggerthella | 0.001 | 0.005 | 0.000 | 0.000 | 0.001 | 0.002 | 0.000 | 0.001 | 0.013 |
| Enterococcus | 0.049 | 0.122 | 0.002 | 0.024 | 0.024 | 0.070 | 0.018 | 0.009 | 0.025 |
| Lactobacillus | 0.202 | 0.120 | 0.099 | 0.138 | 0.145 | 0.043 | 0.037 | 0.043 | 0.020 |
| Olsenella | 0.000 | 0.000 | 0.001 | 0.000 | 0.000 | 0.000 | 0.000 | 0.000 | 0.024 |
F_1a: Treatment-experienced females at day 0; F_1b: Treatment-experienced females at day 5; F_2a: Treatment-not-experienced females at day 0; F_2b: Treatment-not-experienced females at day 5; M_1a: Treatment-experienced males at day 0; M_1b: Treatment-experienced males at day 5; M_2a: Treatment-not-experienced males at day 0; M_2b: Treatment-not-experienced males at day 5
In Figure 4, beta-diversity indices revealed significant differences at group and subgroup levels regarding the bacterial counts. The biggest shift in the microbial community was observed in the antibiotic group for female participants from day 0 (black eclipse) to day 5 (gray eclipse); whereas a similar but smaller shift was observed for the male participant group with antibiotic treatment from day 0 (yellow eclipse) to day 5 (dark green eclipse). Among the antibiotic treatment groups for both male and female participants, the microbial communities were more heterogeneous after 5 days of antibiotic treatment. On the other hand, the microbial communities either remained similar or became more homogeneous on the 0 day and 5th day of sample collection for both participant groups without antibiotic treatment. However, a slight shift was noticed from the 0-day (red eclipse) to 5th day (blue eclipse) in samples collected from the female participants without antibiotic treatment. In the case of male participants without antibiotic treatment, the microbial communities become more homogenous on the 5th day (light green eclipse) than on the 0-day (brown eclipse).
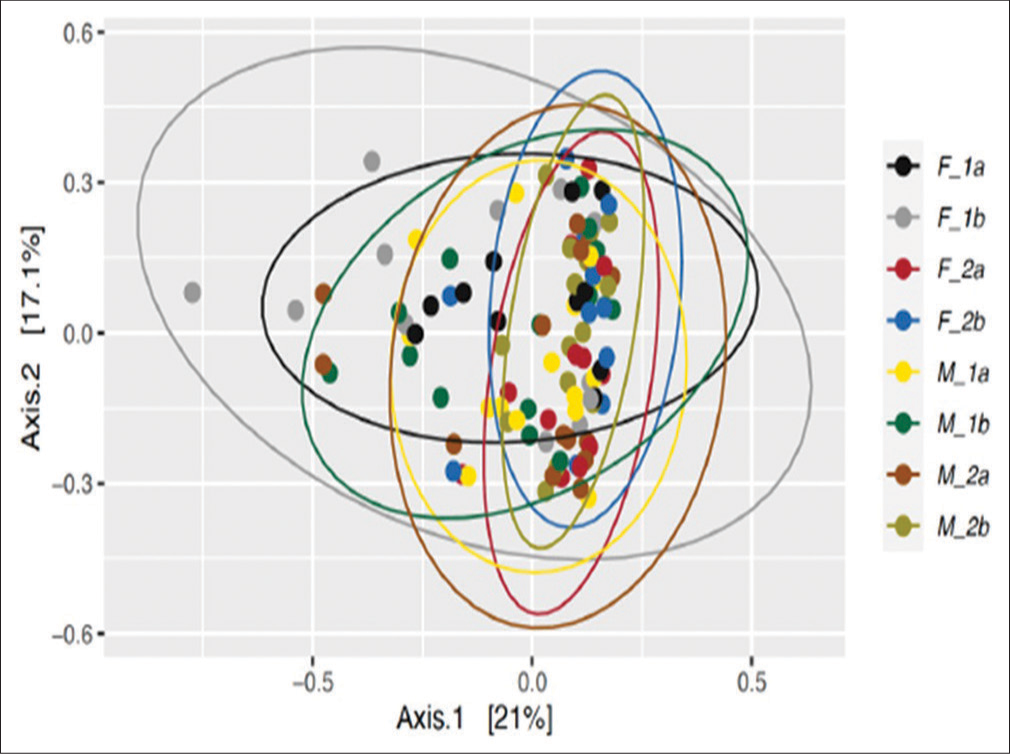
- Principal coordinate analysis (PCoA) plots depicting beta-diversity calculated using the Bray-Curtis similarity distance among the prokaryotic communities in the fecal samples collected from the female participants at day 0 and day 5. (F_1a) treatment-experienced females at day 0, (F_1b) treatment-experienced females at day 5, (F_2a) treatment -not-experienced females at day 0, (F_2b) treatment not experienced females at day 5, (M_1a) treatment-experienced males at day 0, (M_1b) treatment-experienced males at day 5, (M_2a) treatment-not-experienced males at day 0, and (M_2b) treatment-not-experienced males at day 5.
The Firmicutes/Bacteroidetes (F/B) ratio is widely accepted to have an important influence on maintaining normal intestinal homeostasis. An increased or decreased F/B ratio is considered as dysbiosis.[23] The presented study shows that the F/B ratios of Group 1 and Group 2 were 1.535 and 1.006, respectively [Tables 11-13].
| Phylum | Treatment-experienced | Treatment-not-experienced |
|---|---|---|
| Firmicutes | 21.559 | 18.815 |
| Bacteroidota | 14.044 | 18.709 |
| F/B ratio | 1.535 | 1.006 |
F/B: Firmicutes/Bacteroidetes
| Ratio | Subgroup | |||
|---|---|---|---|---|
| 1a | 1b | 2a | 2b | |
| F/B ratio | 1.506 | 1.564 | 0.827 | 1.222 |
F/B: Firmicutes/Bacteroidetes, 1a: sub-group treatment-experienced at day 0;1b: sub-group treatment-experienced at day 5; 2a: sub-group treatment-not-experienced at day 0; 2b: sub-group treatment-not-experienced at day 5.
| F/B ratio | 1a | 1b | 2a | 2b |
|---|---|---|---|---|
| Female | 3.382 | 2.254 | 0.744 | 1.244 |
| Male | 0.856 | 1.217 | 0.903 | 1.206 |
F/B: Firmicutes/Bacteroidetes, 1a: sub-group treatment-experienced at day 0; 1b: sub-group treatment-experienced at day 5; 2a: sub-group treatment-not-experienced at day 0; 2b: sub-group treatment-not-experienced at day 5
DISCUSSION
Antibiotics are frequently used in children to treat common infections and diseases. However, little is known about the effects of antibiotics on the composition and load of the gut microbiota immediately after treatment.[2,6] The present study was, thus, undertaken to study how short-term antibiotic usage is associated with altered microbial abundance and diversity.
Furthermore, this study reasserts that there is an increasing need for global awareness and a detailed understanding of the relationship between antibiotic use and gut dysbiosis. The need of the hour is that healthcare practitioners consider the damage to the gut microbiome while prescribing antibiotics for children and limit their systematic use as they can reshape the microbiota in favor of resistant bacterial strains in the long term.
In the present study, Firmicutes and Bacteroidota represent a large majority of the prokaryotic communities in both groups that were exposed and not exposed to antibiotics for 5 days. This is in concordance with the findings of Wei et al. who observed that the most abundant phyla reported in the fecal samples of children were Bacteroidetes and Firmicutes, followed by the Proteobacteria, Actinobacteria, and Verrucomicrobia, 14 days after treatment with azithromycin in children aged 12–36 months.[8] On comparing groups with azithromycin and placebo, Parker et al. stated that the relative abundance of Proteobacteria, and Verrucomicrobia decreased on day 14. Study findings revealed a modest effect of azithromycin on the composition of the bacterial microbiota among 6–11-month-old infants.[24] The present study also showed a significant decrease in Verrucomicrobia mean relative abundance in the antibiotic-treated group but an increase in the Proteobacteria group, which could Possibly be due to the brief period of observation and short-term antibiotic usage in our study.
Ma et al. and Li et al. stated that breast milk is the main influence of gut microbiota, with differences observed among infants fed exclusively or with formula. Firmicutes on days 0 and 30 dominated the breast milk gut microbiota.[25,26] Similarly, the present study reported comparable results with gut microbiota composition. It was also observed in the present study that the mean relative abundance of Bacteroidetes significantly decreased, and there was a non-significant increase in the mean relative abundance of Firmicutes in both groups from day 0 to day 5. This was in contrast to the findings of Kwon et al., who demonstrated a significant decrease in Firmicutes and Bacteroidetes phyla in the antibiotic group as compared to the control group in infants under 3 months of age.[2] Firmicutes count also decreased from 36% to 4% after 5 days of antibiotic treatment in a child with otitis media, as reported by Sturød et al.[27]
The present study demonstrated a significant increase in the Escherichia-Shigella groups at the genus level in the antibiotic group as compared to the non-antibiotic group. This was in concordance with the study of Kwon et al., who reported a significant increase in the Escherichia/Shigella, and Bifidobacterium groups at the genus level in the antibiotic group as compared to the control group.[2] Wei et al. also found that the Bifidobacterium count significantly reduced in the azithromycin group at day 14 of fecal sample analysis.[8] While Mangin et al. found no significant differences in total Bifidobacteria concentrations after amoxicillin treatment for 7 days, the average number of Bifidobacterium species per microbiota was significantly lower for treated infants compared to the healthy group at day 7.[28]
Alpha diversity indices in the present study suggested no significant differences between the two groups at baseline or post-treatment [Supplementary Figure 1]. This was unlike the study of Oldenburg et al., who found non-significant differences at baseline and significant differences in Simpson’s (0.003) and Shannon’s (0.0001) a-diversity indices in all four treatment arms on the 5th day post-treatment.[10] Furthermore, in a study conducted by Kwon et al., similarly, significant differences in Chao1 (0.033) and Shannon index (0.009) between the control and the antibiotic groups at 4 weeks of sample collection were observed.[2] Similar to our study, Doan et al. found that alpha diversity indices at baseline were non-significant across the two groups, but analysis of stool samples after 5 days of antibiotic treatment revealed significant changes in Inverse Simpsons’ a-diversity indices, with the antibiotic-treated group showing decreased microbial count.[29] Wei et al. also demonstrated that the Shannon diversity index showed statistically lower results for the azithromycin group as compared to the placebo on 14 days of antibiotic use.[8]
In the present study, the b-diversity indices showed that the microbial communities in the antibiotic-treated group were more heterogeneous on day 5 as compared to the non-antibiotic treated group, which showed a more homogenous composition on both days. This finding harmonizes with the study of Bokulich et al., who in their analysis, found a significant relation in the b-diversity index of stool samples of children collected over 2 years. In their study, antibiotic exposure was associated with deficits in Clostridiales and Ruminococcus from 3 to 9 months of life but with no consistent changes in other taxa.[30] On the other hand, Doan et al. reported that b-diversity indices did not show any significance in the azithromycin versus placebo group 5 days post-treatment.[29]
The present study also revealed that a higher abundance of Erysipelatoclostridium, Clostridium species, Ruminococcus, and Eschirichia-Shigella was seen on day 5 of antibiotic treatment [Supplementary Figure 2]. This is in contrast to a study by Abeles et al. (2016), who observed depletion of the Erysipelotrichaceae, Veillonellaceae, and Clostridiales in the gut flora of children following a 3 or 7 day antibiotic course.[31] Doan et al. stated in their study that Faecalibacterium, Blautia, Bifidobacterium, Succinivibrio, Ruminococcus, Roseburia, Escherichia, and Clostridium, account for 61% (higher abundance) of the filtered reads on days 0 and 5 for Antibiotic-treated group.[29]
The present study has shown that the relative abundance of Enterococcus, Lactobacillus, Sellimonas, and Eggerthella was significantly higher in participants receiving antibiotic treatment. On the contrary, the relative abundance of Prevotella, Dialister, and Senegalimassilia was lower in participants with antibiotic treatment in comparison to participants without antibiotic treatment. Prediction of the functions of prokaryotic communities thereby revealed a higher abundance of genes associated with antibiotic resistance in the samples from the participants with antibiotic treatment in comparison to the non-antibiotic group.
In their study, Panda et al. (2014) reported that fluoroquinolones and b-lactams significantly decreased microbial diversity by 25% and reduced the core phylogenetic microbiota from 29 to 12 taxa. However, at the phylum level, these antibiotics increased the Bacteroidetes/Firmicutes ratio (B/F ratio) (P = 0.0007, FDR = 0.002).[6] In contrast to this, the present study demonstrates that antibiotics increased the phylum Firmicutes from day 0 to day 5, while Bacteroidota decreased from day 0 to day 5, decreasing the B/F ratio. In our study, the F/B ratio of the antibiotic group was 1.535. In subgroup analysis, the F/B ratio of group 1 at day 0 and day 5 was 1.506 and 1.564, respectively.
The differences in these findings obtained in our study and previous studies could possibly be attributed to the age of the study participants, lifestyle-associated factors including diet, physical activity, food additives and contaminants, antibiotic consumption, physical activity, the study setting (different geographical areas have been shown to have different microbial compositions in the intestine), the study duration, and the time since the antibiotic exposure.
This study has few limitations considering the short-term duration of post-antibiotic exposure observation and the inclusion of participants from the same region. Furthermore, this study did not give importance to the class and type of antibiotics used by the study participants.
CONCLUSIONS
Several studies have demonstrated that the gut microbiome is sensitive to antibiotic treatment. However, there has been little to no information available on the short-term usage of antibiotics in children aged 3–5 years. This is the first Indian study conducted on children to determine the differences in the gut composition of participants receiving antibiotics compared to participants who did not receive antibiotics.
In our study, it was observed that there was a significant decrease in the gut flora of study participants who belonged to the treatment-experienced group from day 0 to day 5 at the phyla, family, and genus level, whereas in the treatment-not-experienced group, there were no significant changes in the gut flora from day 0 to day 5. Future studies involving specific classes of antibiotics to study their effects on the gut microbiome are warranted.
Acknowledgments
The authors would like to thank the study participants and facilities for their cooperation and contribution to the completion of this study. The authors sincerely acknowledge the support and consultation from Microgenomics and Technology Solutions, Mandi (H.P) and Techsol Lifesciences, Hyderabad, Telangana. This study was funded by Dr. Reddy’s Laboratories Ltd., Hyderabad, India.
Ethical approval
The author(s) declare that they have taken the ethical approval from IEC (KEMHRC ID No. 2106).
Declaration of patient consent
The authors certify that they have obtained all appropriate patient consent.
Conflicts of interest
All authors declare the following: Payment/services info: This research was funded by Dr Reddy’s Laboratories Ltd., Financial relationships: Neha, Devesh Kumar Joshi, Krishna Chaitanya Veligandla, Rahul Rathod, Bhavesh Kotak declare(s) employment from Dr. Reddy’s Laboratories Ltd. The authors, Neha and Devesh Kumar Joshi are serving as the Medical Advisors at Dr. Reddy’s Laboratories Ltd. Hyderabad. Similarly, the authors, Krishna Chaitanya Veligandla, Rahul Rathod, and Bhavesh Kotak are also working as Medical Cluster Head, Head Ideation and Clinical Research, and Head Medical Affairs, respectively, at Medical Affairs Department, Dr. Reddy’s Laboratories Ltd. Hyderabad, India. Other relationships: All authors have declared that there are no other relationships or activities that could appear to have influenced the submitted work.
Use of artificial intelligence (AI)-assisted technology for manuscript preparation
The authors confirm that there was no use of artificial intelligence (AI)-assisted technology for assisting in the writing or editing of the manuscript and no images were manipulated using AI.
Financial support and sponsorship
This research was funded by Dr. Reddy’s Laboratories Ltd., but no financial relationship or activity was with any of the primary investigators.
References
- Administration of b-lactam antibiotics and delivery method correlate with intestinal abundances of Bifidobacteria and Bacteroides in early infancy, in Japan. Sci Rep. 2021;11:6231.
- [CrossRef] [PubMed] [Google Scholar]
- Changes to gut microbiota following systemic antibiotic administration in infants. Antibiotics (Basel). 2022;11:470.
- [CrossRef] [PubMed] [Google Scholar]
- Factors influencing the gut microbiome in children: From infancy to childhood. J Biosci. 2019;44:49.
- [CrossRef] [PubMed] [Google Scholar]
- Antibiotics as major disruptors of gut microbiota. Front Cell Infect Microbiol. 2020;10:572912.
- [CrossRef] [PubMed] [Google Scholar]
- Microbial activities and intestinal homeostasis: A delicate balance between health and disease. Cell Mol Gastroenterol Hepatol. 2015;1:28-40.
- [CrossRef] [PubMed] [Google Scholar]
- Short-term effect of antibiotics on human gut microbiota. PLoS One. 2014;9:e95476.
- [CrossRef] [PubMed] [Google Scholar]
- Environmental and gut bacteroidetes: The food connection. Front Microbiol. 2011;2:93.
- [CrossRef] [PubMed] [Google Scholar]
- Short-and long-term impacts of azithromycin treatment on the gut microbiota in children: A double-blind, randomized, placebo-controlled trial. EBioMedicine. 2018;38:265-72.
- [CrossRef] [PubMed] [Google Scholar]
- Impact of antibiotics on the human microbiome and consequences for host health. Microbiologyopen. 2022;11:e1260.
- [CrossRef] [PubMed] [Google Scholar]
- Effect of commonly used pediatric antibiotics on gut microbial diversity in preschool children in Burkina Faso: A randomized clinical trial. Open Forum Infect Dis. 2018;5:ofy289.
- [CrossRef] [PubMed] [Google Scholar]
- Association between antibiotics and gut microbiome dysbiosis in children: Systematic review and meta-analysis. Gut Microbes. 2021;13:1-18.
- [CrossRef] [PubMed] [Google Scholar]
- Disruption of the gut ecosystem by antibiotics. Yonsei Med J. 2018;59:4-12.
- [CrossRef] [PubMed] [Google Scholar]
- Antibiotics and the human gut microbiome: Dysbioses and accumulation of resistances. Front Microbiol. 2016;6:1543.
- [CrossRef] [PubMed] [Google Scholar]
- Trimmomatic: A flexible trimmer for Illumina sequence data. Bioinformatics. 2014;30:2114-20.
- [CrossRef] [PubMed] [Google Scholar]
- Reproducible, interactive, scalable and extensible microbiome data science using QIIME 2. Nat Biotechnol. 2019;37:852-7.
- [CrossRef] [PubMed] [Google Scholar]
- VSEARCH: A versatile open source tool for metagenomics. PeerJ. 2016;4:e2584.
- [CrossRef] [PubMed] [Google Scholar]
- The SILVA ribosomal RNA gene database project: Improved data processing and web-based tools. Nucleic Acids Res. 2013;41:D590-6.
- [CrossRef] [PubMed] [Google Scholar]
- Phyloseq: An R package for reproducible interactive analysis and graphics of microbiome census data. PLoS One. 2013;8:e61217.
- [CrossRef] [PubMed] [Google Scholar]
- Moderated estimation of fold change and dispersion for RNA-seq data with DESeq2. Genome Biol. 2014;15:550.
- [CrossRef] [PubMed] [Google Scholar]
- VEGAN, a package of R functions for community ecology. J Veg Sci. 2003;14:927-30.
- [CrossRef] [Google Scholar]
- Tools for microbiome analysis in R. Version. 2017. Available from: https://microbiome.github.io/tutorials/Alphadiversity.html
- [Google Scholar]
- PICRUSt2 for prediction of metagenome functions. Nat Biotechnol. 2020;38:685-8.
- [CrossRef] [PubMed] [Google Scholar]
- The influence of probiotics on the firmicutes/bacteroidetes ratio in the treatment of obesity and inflammatory bowel disease. Microorganisms. 2020;8:1715.
- [CrossRef] [PubMed] [Google Scholar]
- Changes in the intestinal microbiota following the administration of azithromycin in a randomized placebo-controlled trial among infants in south India. Sci Rep. 2017;7:9168.
- [CrossRef] [PubMed] [Google Scholar]
- Comparison of gut microbiota in exclusively breast-fed and formula-fed babies: A study of 91 term infants. Sci Rep. 2020;10:15792.
- [CrossRef] [PubMed] [Google Scholar]
- The effect of breast milk microbiota on the composition of infant gut microbiota: A cohort study. Nutrients. 2022;14:5397.
- [CrossRef] [PubMed] [Google Scholar]
- Impact of narrow-spectrum penicillin V on the oral and faecal resistome in a young child treated for otitis media. J Glob Antimicrob Resist. 2020;20:290-7.
- [CrossRef] [PubMed] [Google Scholar]
- Amoxicillin treatment modifies the composition of Bifidobacterium species in infant intestinal microbiota. Anaerobe. 2010;16:433-8.
- [CrossRef] [PubMed] [Google Scholar]
- Gut microbial diversity in antibiotic-naive children after systemic antibiotic exposure: A randomized controlled trial. Clin Infect Dis. 2017;64:1147-53.
- [CrossRef] [PubMed] [Google Scholar]
- Antibiotics, birth mode, and diet shape microbiome maturation during early life. Sci Transl Med. 2016;8:343.ra82.
- [CrossRef] [PubMed] [Google Scholar]
- Microbial diversity in individuals and their household contacts following typical antibiotic courses. Microbiome. 2016;4:39.
- [CrossRef] [PubMed] [Google Scholar]
SUPPLEMENTARY FIGURES
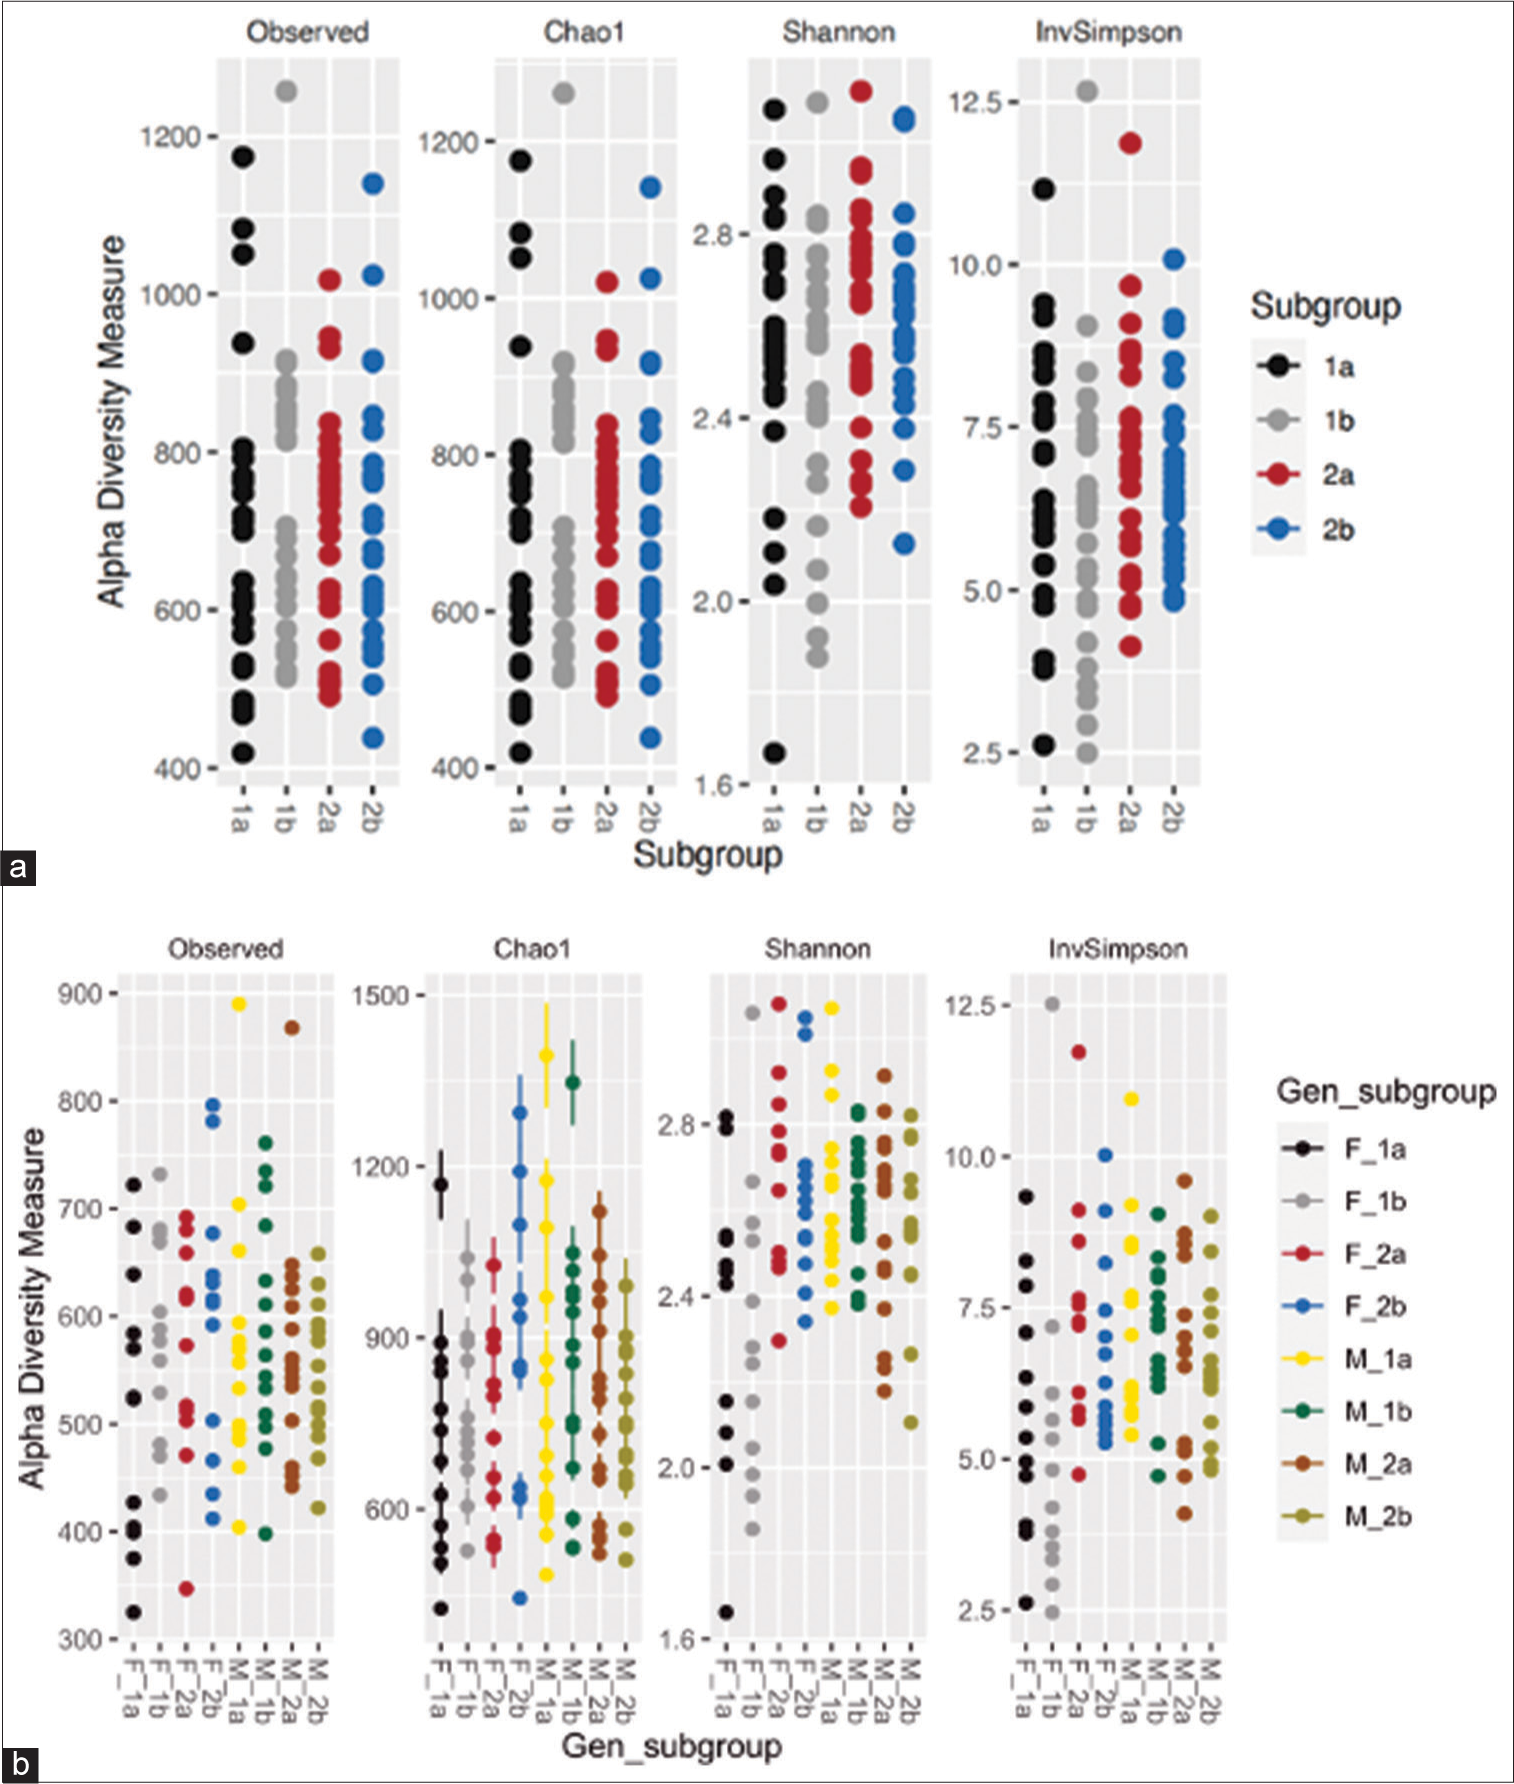
- (a and b) Prokaryotic communities in fecal microbiome of subgroups. (1a) Subgroup treatment-experienced at day 0, (1b) subgroup treatment-experienced at day 5, (2a) subgroup treatment-not-experienced at day 0, and (2b) subgroup treatment-not-experienced at day 5. Gen_subgroup: (F_1a) Treatment-experienced females at day 0, (F_1b) treatment-experienced females at day 5, (F_2a) treatment-not-experienced females at day 0, (F_2b) treatment-not-experienced females at day 5, (M_1a) treatment-experienced males at day 0, (M_1b) treatment-experienced males at day 5, (M_2a) treatment-not-experienced males at day 0, and (M_2b) treatment-not-experienced males at day 5.
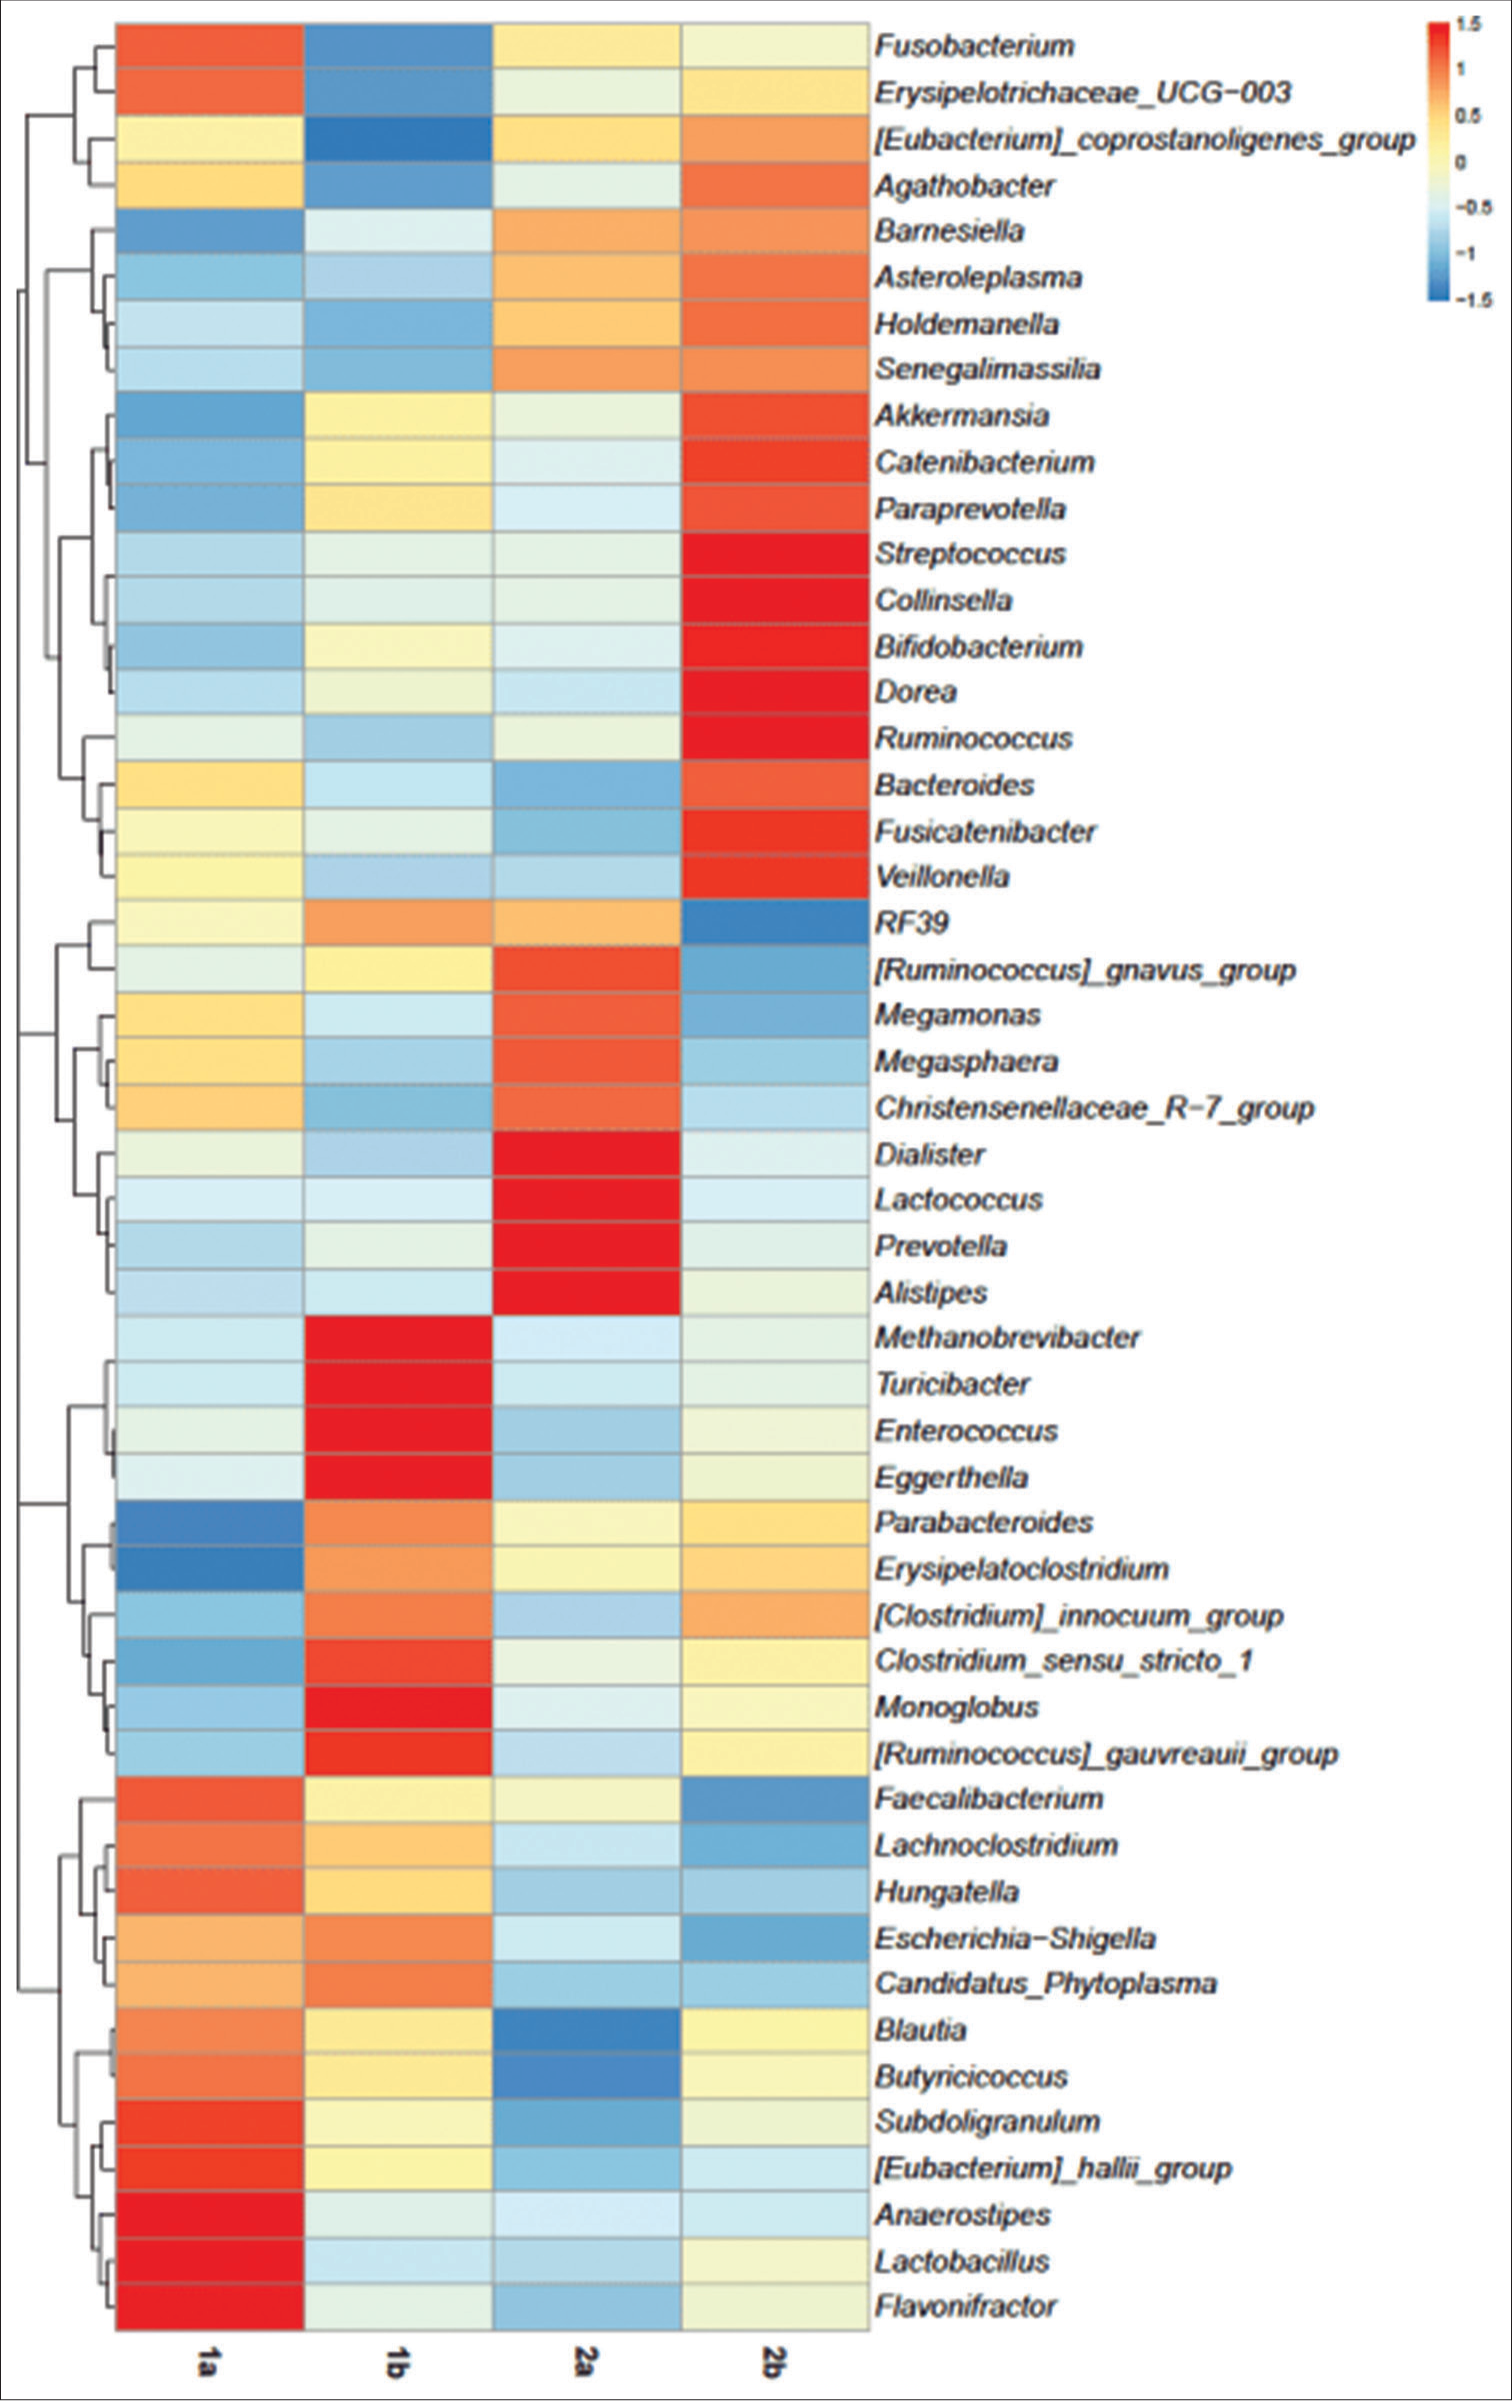
- Heatmap depicting the abundance of prokaryotic genera of subgroups on day 0 and day 5. (1a) Subgroup treatment-experienced at day 0, (1b) subgroup treatment-experienced at day 5, (2a) subgroup treatment-not-experienced at day 0, and subgroup (2b) treatment-not-experienced at day 5.


