
Translate this page into:
Unraveling the Possibilities of Monoclonal Protein Migration, Identification, and Characterization in SPEP on Capillary Zone Electrophoresis
Address for correspondence: Rajni Saijpaul, MD, MBBS, Department of Biochemistry, Third floor, Pathology block, Maulana Azad Medical College, Bahadur Shah Zafar Marg, New Delhi, 110002, India (e-mail: rajnigirish1111@gmail.com).
This article was originally published by Thieme Medical and Scientific Publishers Pvt. Ltd. and was migrated to Scientific Scholar after the change of Publisher.
Abstract
Serum protein electrophoresis (SPEP) is a method by which proteins present in serum are separated into different fractions based on their molecular weight and electric charge. Presence of M spike, composed of monoclonal protein, on electrophoretogram is a characteristic finding that can be seen in monoclonal gammopathies like multiple myeloma. M spike is most commonly seen in the gamma region however, the M-spike can be observed in fraction other than the Y fraction as well i.e. in the beta region and rarely alpha region. Here we have enumerated few cases where M protein has been seen in fractions other than the gamma region. Thus one needs to be cautious about the variable appearance of M-spike during interpretation of SPEP as some physiological proteins if elevated can also give rise to similar spike sometimes referred as pseudo monoclonal pattern.
Keywords
capillary zone electrophoresis
multiple myeloma
M-spike
monoclonal protein
variable migration

Introduction
Monoclonal gammopathy (MG) comprises a wide range of conditions arising from the abnormal clonal proliferation of plasma cells, in which monoclonal proteins can be detected in urine and serum either as intact immunoglobulins, only light chains (kappa and lambda) or only heavy chains (G, A, M, D, and E), or intact immunoglobulins with excess light chains.[1,2] On the basis of clinical features, bone marrow findings, and quantitative measurement of the monoclonal protein, common disorders associated with MG include malignant diseases, such as multiple myeloma (MM), Waldenströmsmacroglobulinaemia, plasmacytoma, or benign diseases like MG of uncertain significance (MGUS), the term being coined by the Mayo Clinic Group Time 1971.[3,4]
MGUS is the common etiology of MG, with prevalence progressively increasing with age, that is, 1, 3, and 10% in the age group of more than 50, 70, and 80 years, respectively.[2] MM contributes to nearly 10% of the hematological malignancies, with occurrence of nearly 1 per 100,000 population worldwide.[2] Patients of MM present most commonly with complaints of back pain, spontaneous fracture, or recurrent infections.[2] Serum protein electrophoresis (SPEP) is a routinely done investigation for suspected cases of MG for the diagnostic, therapeutic, and prognostic evaluation of the underlying illness. Serum proteins are separated into different regions by SPEP based on their molecular weight and electric charge.[4] Zone electrophoresis is the most commonly used electrophoretic technique in which serum proteins are separated into different regions and thereafter interpreted. Monoclonal proteins usually migrate to the gamma region producing M spike; however, many times the spike may be encountered in other regions (like α2, β1, and β2) making the diagnosis of MG challenging. So, whenever any atypical migration of M protein is observed on SPEP, it should be further investigated with immunoelectrophoresis (immunofixation [IF] or immunosubstraction [IS]), which would help in resolving this diagnostic dilemma by the identification and characterization of paraproteins.
Here, we would like to present some interesting insight into electrophoretograms displaying M spike in regions other than common location (gamma region) on capillary zone electrophoresis (CZE).
Cases
Case 1
A 65 years old male presented to the outpatient department (OPD) with complaints of on-and-off back pain for 6 to 7 years and intermittent fever with progressively increasing generalized weakness since 2 years. He was hypertensive for 15 years and was diagnosed with osteoarthritis knee 5 years back. On examination, he was overweight and pallor was seen.
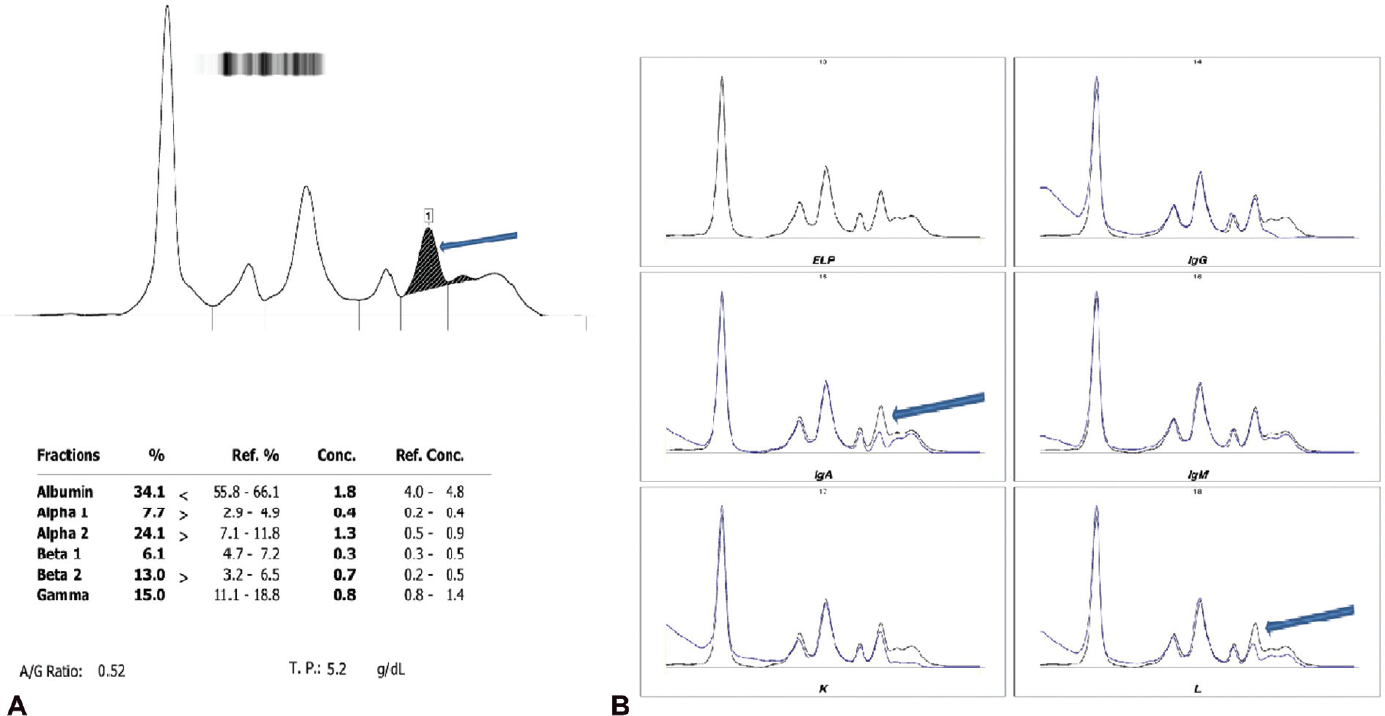
Blood investigations (►Table 1) showed low hemoglobin level and hypercalcemia with reversal of albumin-to-globulin ratio. No osteolytic lesion was seen on the radiological survey. Bone marrow findings were suggestive of megaloblastic erythropoiesis with increased plasma cells in marrow (< 10%). However, M-spike was seen in β1 fraction on SPEP which came as monoclonal IgA-lambda on immunotyping (IT) (►Fig. 1). M protein concentration was 1.7 g/dL. The patient was provisionally diagnosed with MGUS based on the above observations and referred for further management.

- (A) M-spike in the β1 region on CZE and (B) M-spike comprising of monoclonal IgA-lambda on IS.
| Patient 1 | Patient 2 | Patient 3 | Patient 4 | Patient 5 | |
|---|---|---|---|---|---|
| Hemoglobin (g%) | 7.8 | 7.6 | 7.4 | 7.8 | 6.3 |
| TLC (per cumm) | 7,500 | 6,400 | 4,000 | 3,200 | 5,600 |
| Platelet (lacs per cumm) | 3.1 | 1.8 | 1.6 | 2.3 | 1.4 |
| Blood urea (mg/dL) | 45 | 32 | 32 | 48 | 51 |
| Serum creatinine (mg/dL) | 1.6 | 1.2 | 1.2 | 2.1 | 3.1 |
| Serum calcium (mg/dL) | 10.2 | 7.9 | 9.1 | 9.2 | 9.6 |
| Total serum protein(g/dL) | 7.4 | 9.8 | 8.1 | 8.6 | 15.3 |
| Serum albumin (g/dL) | 2.7 | 2.4 | 2.1 | 2.3 | 3.3 |
| A/G ratio | 0.57 | 0.32 | 0.34 | 0.37 | 0.27 |
Abbreviations: A/G ratio, albumin-to-globulin ratio; TLC, total leukocyte count.
Note: Bold values indicate the test values not within the biological reference range of these parameters.
Case 2
A 45 years old male presented to the OPD with complaints of progressively increasing bony pain and generalized weakness for 6 to 7 months. He had anorexia and weight loss for 3 to 4 months with easy bruisability and rashes since 1 month. He was a known case of type II diabetes mellitus for 10 years, MGUS for 5 years, and chronic liver disease for 2 years. On examination, he was of thin built and had pallor. Petechial hemorrhages were observed on bilateral upper and lower limbs.
Blood investigations (►Table 1) revealed low hemoglobin level and high total serum protein level with reversal of albumin-to-globulin ratio. Radiological investigations showed osteopenia with multiple punched-out lytic lesions in pelvic bones and proximal shafts of bilateral femur. As the patient was a diagnosed case of MGUS, its progression to MM was suspected and subsequently M-spike was characterized as monoclonal IgG-lambda type on IT (►Fig. 2). M protein concentration was 4.8 g/dL. These findings were further supported by bone marrow result which was suggestive of plasma cell myeloma (> 15% plasma cells) with CD138+ and CD19 − . Therefore, the patient was diagnosed with MM and referred for further management and treatment.

- (A) M-spike in the fused β-γ region on CZE and (B) monoclonal IgG-lambda corresponding to M-spike on SPEP.
Case 3
A 53 years old male presented to the emergency with complaints of black tarry stool and generalized weakness for 4 days. He had a loss of appetite for 20 to 30 days, night sweats for 1 to 2 months, and persistent backache for 4 to 5 months. He had a fracture of D11 and L2 vertebrae a year back. He was a known case of type II diabetes mellitus for 17 years and been an alcoholic for 20 years. On examination, he was of normal built and had pallor.
Blood investigations (►Table 1) revealed low hemoglobin level and marginal decrease in leukocytes and platelet count. He also had hypercalcemia and high total serum protein level with reversal of albumin-to-globulin ratio. On X-ray skull rain drop appearance was seen and X-ray spine showed old D11 and L2 vertebral fracture. This raised the suspicion of plasma cell gammopathy and SPEP was requested on which M-spike was seen in β fraction (merged β1 and β2 fractions) which on IT revealed the presence of monoclonal IgA-lambda and on quantification its value was 3.2 g/dL (►Fig. 3). On the basis of the above findings, bone marrow aspiration was recommended for a definitive diagnosis of MM and subsequent treatment. The patient did not show for follow-up, so bone marrow aspiration could not be performed.

- (A) M-spike in the merged β1 and β2 region on CZE and (B) monoclonal IgA-lambda corresponding to M-spike on SPEP.
Case 4
A 58 years old female presented to OPD with complaints of pain in left forearm since 3 months. She also had generalized weakness and persistent backache for 5 years. She had menopause 4 years back. There was no history of trauma or any chronic illness. Pallor was observed on general examination.
Blood investigations (►Table 1) revealed low hemoglobin level and low leukocyte counts. She also had hypercalcemia and high total serum protein level with reversal of albumin-to-globulin ratio. On X-ray, forearm ulnar fracture was seen. SPEP was advised. On SPEP, M-spike in β2 fraction was detected followed by IT, which revealed the presence of monoclonal IgA-lambda in the region corresponding to M spike on SPEP (►Fig. 4). M protein concentration was 0.4 g/dL. Bone marrow findings showed increased plasma cells in marrow (< 10%). On the basis above findings, a provisional diagnosis of MGUS was made and the patient was referred for further management.
- (A) M-spike in the β2 region on CZE and (B) monoclonal IgA-lambda forming M-spike on SPEP.
Case 5
A 60 years old female presented to OPD with complaints of progressively increasing weakness for 7 months and on-and-off backache since 3 years. She was on treatment for post-menopausal bleeding. On general examination, pallor was seen.
Blood investigation reports (►Table 1) showed low hemoglobin and low platelet counts. Raised total serum calcium and serum protein were also reported. Considering low hemoglobin levels with others suggestive of MG, SPEP was requested. M-spike appeared in gamma fraction on SPEP, which was followed by IT where the monoclonal protein IgA kappa was seen corresponding to the position of M spike on SPEP (►Fig. 5). The M protein concentration was 4.2 g/dL. There was no significant finding on the radiological survey. She was provisionally diagnosed with MGUS and referred for further management and treatment.

- (A) M-spike in the gamma region on CZE and (B) monoclonal IgA kappa corresponding to M-spike on SPEP.
Discussion
Nearly 100 serum samples were processed on the two capillaries automated capillary electrophoresis system (Minicap flex piercing, Sebia, France) installed in our setup during a period of 8 months (August 2020–March 2021). Among them, we observed M-spike in 14 CZE electrophoretograms. The M-spike was present in the gamma region in 10 samples, while in four samples the M-spike was detected in regions other than gamma. Quantitative estimation of monoclonal proteins can provide valid interpretation in diagnosis, evaluation, and monitoring of MGs; therefore, from capillary electrophoresis, the absolute concentration of monoclonal protein was calculated from the value of serum total protein obtained on a dry chemistry analyzer (Vitros5600 Ortho clinical diagnostics).
Since the advent of capillary protein electrophoresis (CE), detection and quantification of monoclonal immunoglobulins in serum and urine have been improved to a larger extent because of less chances of variation otherwise seen due to different dye-binding capacities of proteins in agarose gel electrophoresis.[5] CE also provides better differentiation of the β region into β1- and β2-globulin fractions, thus improving further their separation.[5,6] Better resolution has been seen in CE when compared with agarose gel electrophoresis as it is based on the principle of endosmosis and also employs a high voltage (R) and which, in turns, facilitates separating the proteins into β1 and β2 fractions constituted majorly by globulin proteins transferrin, low-density lipoprotein, and complement proteins (C3,C4). The α1 fraction is majorly constituted by α1 antitrypsin and α1 acid glycoprotein (orosomucoid). Being acute-phase reactants, an increase in α1 fraction may be seen in clinical conditions associated with an acute inflammatory response like trauma, inflammatory joint disease exacerbation, burns, etc.[5] Similarly, haptoglobin and ceruloplasmin in the α2 fraction are also acute-phase reactants, but this fraction is also contributed to by α2 macroglobulin. An increase in α2 macroglobulin is characteristically seen in nephrotic syndrome because it is a large-sized protein and, hence, hardly passes through the glomerular membrane. Another reason for the rise seen in serum α2 macroglobulin is due to its increased synthesis to maintain the normal plasma oncotic pressure as a compensatory mechanism for significantly decreased serum albumin levels in nephrotic syndrome.[7] Monoclonal proteins and physiologically present serum proteins in the β1 and β2 fractions may co-migrate and, thus, contribute to the unusual elevation seen in these fractions. In patients with iron deficiency anemia, pesudomonoclonal elevation in beta fraction may be seen due to increased serum transferrin levels, and this pattern may also be seen in hemolyzed samples (a preanalytical variable) because of the comigration of free hemoglobin as released from breakdown of RBCs. For β2 fractions, in the electrophoretic pattern seen in blood samples of patients undergoing dialysis or on anticoagulant therapy (e.g., heparin), such an unusual elevation may be appreciated because of falsely high fibrinogen levels. The gamma fraction is the most common region for monoclonal protein migration; however, extremely high serum CRP levels, uremia, rheumatoid factor, or old degraded sample may also contribute to pseudo-monoclonal increase seen in this fraction. Polyclonal IgA may result in the confluence of β2 and gamma fractions depicted as β-γ bridging in the electrophoretogram.[5] CE in combination with IS helps in the identification and characterization of even weak monoclonal immunoglobulin components in SPE and in differentiating between pseudo-monoclonal proteins and paraproteins. Biochemical assays of these normally present serum proteins as well as free light chain assay and serum Ig levels may further help in confirmation of monoclonality. While both CE and agarose gel electrophoresis are 99% specific, CE has a sensitivity of 95% compared with gel electrophoresis which has 91%.[2]
SPEP gives an idea about the concentration of important serum protein fractions in addition to paraproteins if present, most commonly observed in the gamma fraction. However small monoclonal components do not always follow this and may appear in fractions other than the gamma region and which may be seen as curve irregularity on electrophoretograms. The most common immunoglobulin presenting irregularity due to their variable migration is IgA, and the possible explanation for this is their property to polymerize.[2] Sometimes, it is difficult to tell whether the irregularity is because of raised levels of proteins normally found in that fraction or because of monoclonal protein migration.[5] This dilemma can be resolved by using the technique immunoelectrophoresis (IF or IS).
IS is performed using specific antisera against both heavy and light chains, and the IS occurred during the process of immunoelectrophoresis is identified and interpreted.[6] The specific antisera binds to its respective immunoglobulin if present in the sample, and the complex formed is precipitated and thus does not migrate, causing reduction or disappearance of peak as seen in CE. This reduction or disappearance of peak, characterizing a particular type, is appreciated when original capillary SPEP trace is overlayed on trace obtained by the addition of one of each five specific antisera to the patient's serum.[6] By this method, it is possible to recognize as well as quantify monoclonal proteins. Thus, capillary electrophoresis along with IS aids in the diagnosis and management of patients with MG.
Conclusion
The M spike is seen most commonly in the gamma region. However, it is reported that at times monoclonal protein can migrate anywhere from α2 to gamma region, especially IgA which often appears in the β region. Here, we have enumerated few cases where M protein has been seen in fractions other than the gamma region. Thus, one needs to be cautious about the variable appearance of M-spike during the interpretation of SPEP as some physiological proteins if elevated can also give rise to similar spike sometimes referred as the pseudo-monoclonal pattern.
Authors' Contribution
All the authors contributed to the concepts, design, definition of intellectual content, and statistical analysis. S.P., R.S., and R.V. contributed to the literature research, manuscript preparation, and data analysis. S.P., V.K., and R.S. contributed to data acquisition. S.P., V.K., R.S., and R.V. contributed to manuscript editing. R.S., L.C., and B.C.K. contributed to manuscript review. All authors are the guarantors of this paper.
Conflict of Interest
None declared.
References
- Multiple myeloma: a case of atypical presentation on protein electrophoresis. Indian J Clin Biochem. 2012;27(01):100-102.
- [CrossRef] [PubMed] [Google Scholar]
- Challenges of measuring monoclonal proteins in serum. Clin Chem Lab Med. 2016;54(06):947-961.
- [CrossRef] [PubMed] [Google Scholar]
- The role of serum protein electrophoresis in the detection of multiple myeloma: an experience of a corporate hospital. J Clin Diagn Res. 2012;6(09):1458-1461.
- [CrossRef] [PubMed] [Google Scholar]
- Should routine laboratories stop doing screening serum protein electrophoresis and replace it with screening immune-fixation electrophoresis? No quick fixes: counterpoint. Clin Chem Lab Med. 2016;54(06):967-971. (CCLM)
- [CrossRef] [PubMed] [Google Scholar]
- Peaks and tails: evaluation of irregularities in capillary serum protein electrophoresis. Clin Biochem. 2018;51:48-55.
- [CrossRef] [PubMed] [Google Scholar]
- An unusual pattern in serum protein electrophoresis to take in mind: a case report. Pract Lab Med. 2021;24:e00200.
- [CrossRef] [PubMed] [Google Scholar]
- Illustrated Textbook of Clinical Chemistry. (2nd). London: Gower Medical Publications; 1992. p. :210-221.
- [Google Scholar]


