
Translate this page into:
Urinary Nephrin is a Sensitive Marker to Predict Early Onset of Nephropathy in Type 2 Diabetes Mellitus
Address for correspondence: Murugan Mannangatti, PhD, Department of Biochemistry, Arupadai Veedu Medical College and Hospital, Vinayaka Mission University Research Centre, Pondicherry, 607402, India (e-mail: avmcbiochemistryedu@gmail.com).
This article was originally published by Thieme Medical and Scientific Publishers Pvt. Ltd. and was migrated to Scientific Scholar after the change of Publisher.
Abstract
Objective
The present study has been designed to evaluate urinary nephrin that best predicts the occurrence of renal dysfunction in type 2 diabetes mellitus patients and its correlation with clinical parameters of nephropathy.
Materials and Methods
A total of 80 type 2 diabetes mellitus and 40 age- and gender-matched healthy controls were recruited. Biochemical and clinical parameters were analyzed in all the study participants. Analysis of variance was performed to compare the differences between the groups. Pearson's correlation analysis was used to analyze the association of nephrin with clinical parameters of nephropathy. Receiver operating characteristic curves were constructed to study the diagnostic accuracy of markers to identify diabetic nephropathy.
Results
The levels of nephrin were significantly elevated in both groups of type 2 diabetes mellitus patients when compared with healthy individuals (p = 0.0001). The urinary nephrin was positively correlated with hemoglobin A1c and urinary albumin creatinine ratio (r = 0.520, 0.657, p < 0.0001) and negatively correlated with estimated glomerular filtration rate (r = –0.539, p < 0.0001). The diagnostic sensitivity and specificity of nephrin for nephropathy were 100 and 88%, respectively, and urinary albumin creatinine ratio was 43 and 76%, respectively.
Conclusion
The study findings suggest that nephrin levels are strongly and positively associated with nephropathy in type 2 diabetes mellitus patients and it has a greater potential to be an early predictable marker of nephropathy than urinary albumin creatinine ratio.
Keywords
HbA1c
type 2 diabetes mellitus
urinary nephrin

Introduction
Type 2 diabetes mellitus (T2DM) caused by hyperglycemia due to defect in insulin secretion from the β cells of pancreas and inactivation of insulin leads to insulin resistance.[1] T2DM is one of the leading disorders in the world, where 415 million people were affected by the year 2015 and it is estimated to reach 650 million by 2030; in the Indian scenario 65 million were affected by the year 2013 and it is estimated to reach 103 million by the year 2030.[2,3] T2DM leads to many micro- and macrovascular complications, this in turn affect many organs like the kidney, retina of the eye, brain, lungs, and heart, etc. and most of the diabetic people are affected with nephropathy. Diabetic nephropathy (DN) is the major microvascular complication in patients with T2DM due to hyperglycemia in the blood and hypoglycemia in the skeletal muscles leading to excess mobilization of lipids and proteins resulting in the production of reactive oxygen species and reduced antioxidants.[4-6] Currently, urinary albumin is used for the diagnosis of nephropathy in patients with T2DM. However, some of the recent researchers reported that microalbuminuria is not a gold standard, sensitive and specific, biomarker for diagnosis of nephropathy in patients with T2DM, because it also elevates in other disorders like obesity, hypertension, different types of kidney problems, etc. In addition to that some of the patients diagnosed with microalbuminuric stage are directly converting into normoalbuminuric stage due to treatment modalities.[7-9]
Along with that some of the recent studies found podocyte proteins to play an a important role in the early prediction and progression of nephropathy, as such urinary nephrin is the one of the anchoring proteins of foot process of the podocytes in the kidney, urinary excretion nephrin levels are used for early detection of nephropathy in patients with T2DM. Nephrin is the transmembrane protein of the immunoglobulin super family and also it is a very essential component of slit diaphragm between the foot processes of the podocytes in the kidney.[10] The physiological action of nephrin is to maintain the size selectivity of the slit diaphragm and form a network of interdigitating foot processes of the podocytes in the kidney to prevent leaking of proteins.[11] Dysregulation of nephrin due to hyperglycemia in podocytes lead to nephrinuria particularly in T2DM patients with normoalbuminuric patients, preceding microalbuminuria.[12] However, very few studies have been done on urinary nephrin and also examined the relationship between urinary nephrin, hemoglobin A1c (HbA1C), urinary albumin, and estimated glomerular filtration rate (eGFR) in South Indian population and a study is required to evaluate sensitive and specific biomarker (urinary albumin and nephrin) for early detection of nephropathy in T2DM patients. Hence, in the present study we aimed to investigate the levels of urinary nephrin and correlate with urinary albumin and eGFR to predict early onset and progression of nephropathy in T2DM.
Materials and Methods
This is a case–control study conducted in Basaveshwara Institute of Medical Sciences and Research Centre, Chitradurga, Karnataka, India, and Arupadai Veedu Medical College, Puducherry, India, from 2018 to 2021. A total 120 subjects with age group of 30 to 70 years were included in the study. Among these, 80 T2DM subjects were again divided into two groups: group 2: 40 T2DM patients with normoalbuminuria (duration of DM < 5 years, HbA1c: 6–7.5%, and albumin creatinine ratio [ACR]: < 30 mg/dL); group 3: 40 T2DM patients with microalbuminuria (duration of DM 5–10 years, HbA1c: 7.6–10.5%, and ACR: 30–299 mg/dL) (►Fig. 1). Additionally, we recruited age- and gender-matched healthy controls considered as group 1 (n = 40). All the T2DM subjects included in the study were diagnosed with different stages of nephropathy according to the American Diabetic Association criteria and Kidney Disease Improving Global Outcomes criteria[13,14]; patients smoking, alcoholism, liver diseases, hypertension, cardiovascular, cerebrovascular, thyroid, peripheral vascular diseases, and those in treatment on thiazolidine and anti-inflammative were excluded from the study.
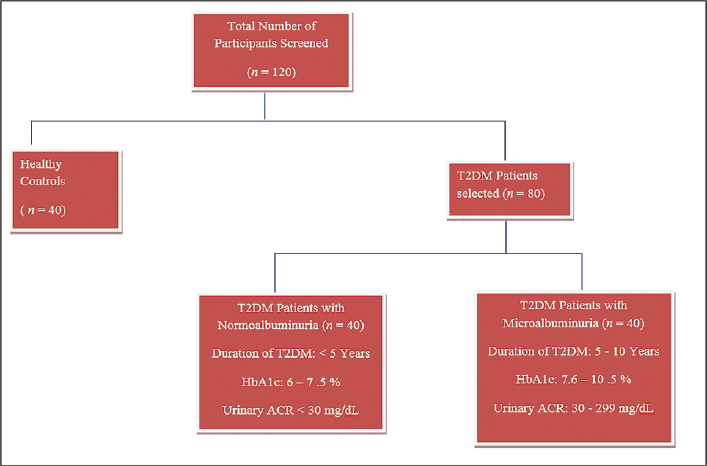
- Selection of study subjects.
Seven milliliters of fasting (overnight 8–12 hours) venous blood sample and 3 mL of postprandial blood sample were collected from all the subjects after obtaining informed consent from. Two milliliters of blood sample was transferred into tube containing anticoagulant sodium fluoride, 2 mL transferred into tube containing anticoagulant ethylenediaminetetraacetic acid, and remaining 3 mL transferred into plain tube. Anticoagulant tubes were separated immediately and plain tube was allowed to rest for 10 minutes at room temperature for clotting. All the samples were centrifuged at 3,000 revolutions per minute (RPM) for 10 minutes, after centrifugation separated samples (plasma and serum) were transferred into properly labeled aliquots and stored at deepfreeze at –80°C until biochemical analysis was done. Along with the blood sample urine sample was also collected from all the subjects, centrifuged at 3,000 RPM for 10 minutes, and after centrifugation of urine sample, 1 mL was separated into labeled aliquots, stored at deepfreeze at –50°C and the remaining urine sample was immediately processed for urinary albumin and creatinine.
Plasma fasting blood sugar (FBS), postprandial blood sugar (PPBS), glycosylated HbA1c, serum urea, and creatinine were analyzed by using laboratory standard methods, eGFR was calculated by using Chronic Kidney Disease-Epidemiology Collaboration formula, urinary ACR was analyzed by using immunoturbidimetric method, and urinary nephrin was analyzed by using enzyme-linked immunosorbent assay.
Statistical Analysis
The data were statistically analyzed by using Microsoft Excel spreadsheets, IBM Statiscal Package for the Social Sciences (SPSS) Version 20.0, and Medcalc (Version 12.1, Ostend, Belgium). First, the normality of the three groups of data distribution was tested using the Kolmogorov–Smirnov test. Continuous variables are expressed as mean ± standard deviation. Comparisons between the three groups were analyzed by using one-way analysis of variance (ANOVA). Pearson's correlation analysis was done to test the correlation of urinary nephrin with other biochemical parameters. Receiver operating characteristic (ROC) curves were constructed to study the diagnostic accuracy of the markers to identify DN in the normoalbuminuric group when compared with healthy controls. A cutoff value with the best combination of sensitivity and specificity was determined from the ROC curve. Marker positivity in the groups studied were calculated based on values above the upper limit of the 75% confidence intervals of the median values of the markers and the ROC-derived cutoff values. A p-value of less than 0.05 was considered as statistically significant.
Results
►Table 1 shows the plasma FBS, plasma PPBS, serum urea, serum creatinine, HbA1c, comparison of the routine biochemical parameters, and urinary biomarkers across the study groups. There is statistically significant elevation of plasma FBS, PPBS, HbA1c, serum urea, creatinine, urinary ACR, and nephrin in patients with T2DM compared with healthy controls, respectively, p-value of 0.0001.
| Parameter | Group 1 (n = 40) | Group 2 (n = 80) | p-Value |
|---|---|---|---|
| Age (y) | 48.10 ± 9.56 | 49.57 ± 7.58 | 0.431a |
| Height (feet) | 3.66 ± 0.55 | 3.40 ± 0.52 | 0.022a |
| Weight (kg) | 74.47 ± 11.97 | 82.55 ± 14.01 | 0.028a |
| BMI (kg/m2) | 20.42 ± 2.09 | 24.61 ± 4.54 | 0.0001b |
| FBS (mg/dL) | 90.63 ± 7.31 | 156.17 ± 31.76 | 0.0001b |
| PPBS (mg/dL) | 114.70 ± 13.39 | 225.68 ± 73.64 | 0.0001b |
| Serum urea (mg/dL) | 23.07 ± 9.71 | 43.08 ± 18.44 | 0.0001b |
| Serum creatinine (mg/dL) | 0.99 ± 0.19 | 3.54 ± 2.71 | 0.0001b |
| HbA1c (%) | 4.31 ± 0.76 | 7.06 ± 1.30 | 0.0001b |
| eGFR (mL/min) | 91.43 ± 13.93 | 57.01 ± 40.91 | 0.0001b |
| Urinary ACR (mg/dL) | 14.34 ± 4.73 | 116.21 ± 107.07 | 0.0001b |
| Urinary nephrin (ng/mL) | 0.52 ± 0.20 | 2.48 ± 1.21 | 0.0001b |
Abbreviations: ACR, albumin creatinine ratio; BMI, body mass index; eGFR, estimated glomerular filtration rate; FBS, fasting blood sugar; HbA1c, hemoglobin A1c; PPBS, postprandial blood sugar; T2DM, type 2 diabetes mellitus.
Note: Group 1 is the healthy control, group 2 has type 2 diabetes.
a Not significant at the 0.05 probability level.
b Highly significant at the 0.05 probability level.
►Table 2 shows the comparison of the routine biochemical parameters and urinary biomarkers across the study groups by one-way ANOVA. There is statistically significant elevation of plasma FBS, PPBS, HbA1c, serum urea, creatinine, urinary ACR, and nephrin in the two groups of T2DM subjects compared with healthy controls, respectively, p-value of 0.0001. It was also observed that T2DM subjects with microalbuminuria have high level of urinary nephrin then T2DM subjects with normoalbuminuria, respectively, p-value of 0.0001, which shows statistically highly significant relation.
| Parameter | Group 1 (n = 40) | Group 2 (duration of DM < 5 y [n = 40]) | Group 3 (duration of DM 5–10 y [n = 40]) | p-Value |
|---|---|---|---|---|
| Age (y) | 48.10 ± 9.56 | 46.03 ± 5.91 | 53.10 ± 7.49 | 0.002a |
| Height (feet) | 3.66 ± 0.55 | 3.36 ± 0.52 | 3.43 ± 0.53 | 0.004* |
| Weight (kg) | 74.47 ± 11.97 | 77.13 ± 14.24 | 87.97 ± 11.65 | 0.078 |
| BMI (kg/m2) | 20.42 ± 2.09 | 23.01 ± 2.95 | 26.20 ± 5.29 | 0.0001b |
| FBS (mg/dL) | 90.63 ± 7.31 | 135.80 ± 15.49 | 176.53 ± 30.89 | 0.0001b |
| PPBS (mg/dL) | 114.70 ± 13.39 | 175.37 ± 20.71 | 276.00 ± 73.24 | 0.0001b |
| Serum urea (mg/dL) | 23.07 ± 9.71 | 26.97 ± 9.06 | 59.20 ± 8.48 | 0.0001b |
| Serum creatinine (mg/dL) | 0.99 ± 0.19 | 0.97 ± 0.21 | 6.11 ± 1.13 | 0.0001b |
| HbA1c (%) | 4.31 ± 0.76 | 6.07 ± 0.47 | 8.04 ± 1.11 | 0.0001b |
| eGFR (mL/min) | 91.43 ± 13.93 | 95.09 ± 19.71 | 18.93 ± 4.05 | 0.0001b |
| Urinary ACR (mg/dL) | 14.34 ± 4.73 | 15.41 ± 6.69 | 217.02 ± 47.49 | 0.0001b |
| Urinary nephrin (ng/mL) | 0.52 ± 0.20 | 1.64 ± 0.53 | 3.34 ± 1.12 | 0.0001b |
Abbreviations: ACR, albumin creatinine ratio; BMI, body mass index; DM, diabetes mellitus; eGFR, estimated glomerular filtration rate; FBS, fasting blood sugar; HbA1c, hemoglobin A1c; PPBS, postprandial blood sugar.
a Significant at the 0.05 probability level.
b Highly significant at the 0.05 probability level.
►Table 3 illustrates significantly increased levels of urinary nephrin along with increasing age in T2DM patients, respectively (p < 0.001).
| Parameter | 31–40 y (n = 11) | 41–50 y (n = 36) | 51–60 y (n = 27) | 61–70 y (n = 6) | p-Value |
|---|---|---|---|---|---|
| Urinary nephrin (ng/mL) | 1.57 ± 0.86 | 3.27 ± 0.78 | 3.04 ± 1.41 | 3.56 ± 1.22 | 0.001a |
Abbreviation: T2DM, type 2 diabetes mellitus.
a Significant at the 0.05 probability level.
►Table 4 shows the correlation of urinary nephrin with other routine biochemical parameters of the subjects by using Pearson's correlation analysis. We observed that urinary nephrin was positively significantly correlated with HbA1c and urinary ACR (r = 0.520, 0.657, respectively, p = 0.0001) and negatively correlated with eGFR (r = –0.539, respectively, p < 0.0001).
| Parameter | HbA1c | Urinary ACR | eGFR | |
|---|---|---|---|---|
| Urinary nephrin (ng/mL) | r | 0.520 | 0.657 | –0.539 |
| p-Value | 0.0001a | 0.0001a | 0.0001a | |
Abbreviations: ACR, albumin creatinine ratio; eGFR, estimated glomerular filtration rate; HbA1c, hemoglobin A1c.
Note: r is the rho factor.
a Significant at the level of 0.05.
►Fig. 2 shows the graphical representation of urinary nephrin distribution in all the three groups of study subjects. Significantly elevated level of urinary nephrin in T2DM subjects with normoalbuminuria and microalbuminuria was observed then in healthy controls.
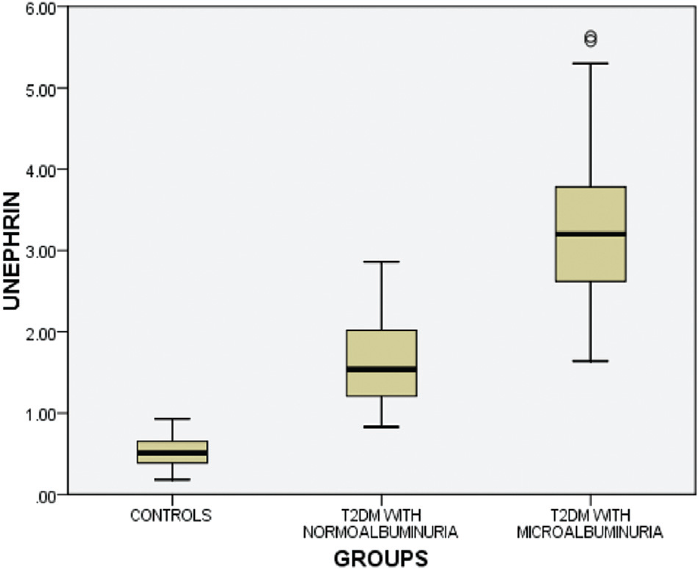
- Distribution of urinary nephrin levels in three groups of study subjects.
►Fig. 3 shows the distribution of urinary ACR levels in different groups of study subjects. T2DM subjects with microalbuminuria have significantly increased levels of urinary albumin when compared with T2DM subjects with normoalbuminuria and healthy controls.

- Distribution of urinary albumin creatinine ratio (ACR) levels among the study subjects.
►Fig. 4 shows eGFR levels in the two groups of T2DM subjects and healthy controls and was compared between groups. Significantly decreased eGFR levels were observed in T2DM subjects with microalbuminuria then in T2DM subjects with normoalbuminuria and healthy controls.
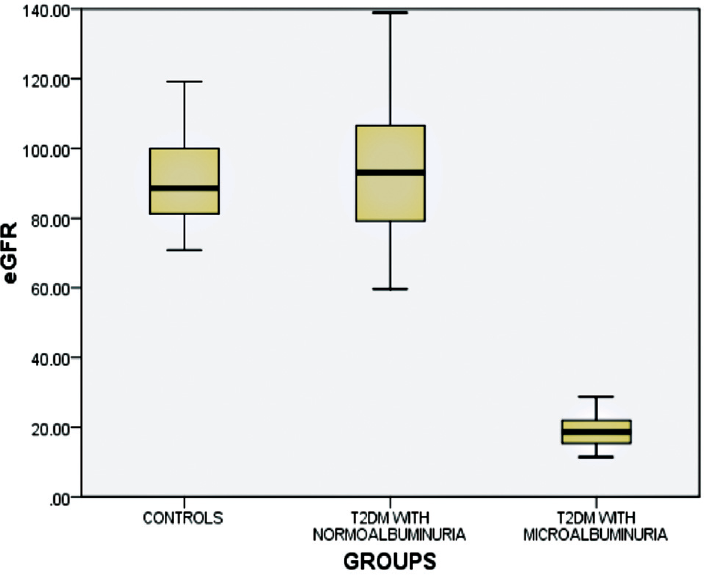
- Distribution of estimated glomerular filtration rate (eGFR) levels among the study subjects.
Discussion
Diabetic kidney disease (DKD) is one of the major microvascular complications in patients with T2DM and nowadays more than 40% of the DKD patients progress to end-stage renal disease.[15] In this condition damage of glomerular filtration barrier and tripartite system have fenestrated endothelial cells of glomerular basement membrane (GBM) and podocytes of kidney. The physiological action of these barriers is selective, filtration of water and solutes, and impermeable to leaking of macromolecules like proteins.[16,17] In T2DM patients, hyperglycemia in the blood and hypoglycemia in tissues trigger lipolysis and proteolysis resulting in the production of reactive oxygen species and advanced glycation end products. These will bind to the advanced glycation end product receptors and trigger downstream signaling facilitating generation of free radicals, activating inflammatory cells, increasing synthesis of angiotensin II, and production of growth factors like vascular endothelial growth factors and transforming growth factor beta, finally leading to proteinuria.[18,19]
Urinary albumin estimation is used for testing the functional capacity of kidney, when patients show less than 30 mg/dL of albumin it is called normoalbuminuria, 30 to 299 mg/dL of albumin is microalbuminuria, and more than 300 mg/dL is macroalbuminuria, it depends on the duration of diabetes and further determined by eGFR.[20] Some of the recent studies reported that urinary microalbuminuria is not a sensitive and specific biomarker for detection of nephropathy in T2DM patients because it has low sensitivity and larger variability. Our study has shown statistically significant elevation of urinary ACR levels in T2DM patients with microalbuminuria when compared with T2DM patients with normoalbuminuria and healthy controls, p-value less than 0.0001 (►Table 2). However, earlier studies have reported that mean arterial blood pressure, plasma concentration of FBSs, HbA1c, aldosterone, atrial natriuretic peptide, vasopressin, and angiotensin II are also risk factors for proteinuria. Additionally, recent studies revealed that T2DM patients with microalbuminuria reverted to normoalbuminuria.[21,22,23]
If DN can be detected before the appearance of microalbuminuria, early intervention can be started to halt or reverse the process. Glomerular biomarker of renal injury is being studied as alternative markers for prediction of DN risk. Some of the recent studies found sensitive and specific biomarker for early detection of nephropathy in T2DM patients. Nephrin is a protein located in the podocytes of GBM of the kidney. Nephrin plays a vital role in podocytes and slit diaphragm to prevent excretion of protein in urine, but minimal structural alterations in podocytes lead to excretion of nephrin in urine prior to proteinuria. The studies are very limited and some of the studies found significantly elevated levels of urinary nephrin in T2DM and other studies reported the urinary nephrin levels were decreased in patient with T2DM.[24-27] The present study also analyzed urinary nephrin, and significantly elevated levels were observed in patients in both groups of T2DM when compared with healthy controls and we also found significantly increased levels of urinary nephrin in T2DM patients with normoalbuminuria when compared with healthy controls. Similarly, other studies also reported podocytes are present in the GBM of kidney and play a good role in maintaining glycocalyx of glomerulus and maintained the slit diaphragm size by specific proteins like nephrin and they also suggested that elevated levels of urinary nephrin were useful for early detection of nephropathy in T2DM patients.
We also found that urinary nephrin was positively correlated with blood sugars, glycosylated hemoglobin, urea, creatinine, and urinary albumin (►Table 4). Similarly, another recent study also reported that association of proximal tubule dysfunction with podocytes damage and dysfunction of proximal convoluted tubule proteins could be validated as an early diagnosis and progression of nephropathy in patients with T2DM.[28,29] Elevated levels of urinary nephrin in T2DM patients with normoalbuminuria stage and increased levels of more than two times in T2DM patients with microalbuminuria showed disease progression toward end-stage kidney disease.
The diagnostic utility of urinary ACR, eGFR, and urinary nephrin for the detection of early DN was compared between group 1 and group 2 by ROC curve analysis (►Table 5). Among these urinary ACR and eGFR there was no significant area under the curve (AUC), with sensitivity ranging from 43.33 to 46.67 and specificity 76.67 to 73.33, respectively, p-values 0.68 and 0.61 and the urinary nephrin showed a statistically significant AUC with sensitivity ranging from 100% and specificity from 93%, respectively, while p-value is less than 0.0001 (►Fig. 5).

- Receiver operating characteristic (ROC) curve analysis of estimated glomerular filtration rate (eGFR), urinary albumin creatinine ratio (ACR), and urinary nephrin.
| Parameter | AUC | 95% CI for AUC | Sensitivity (%) 95% CI | Specificity (%) 95% CI | p-Value |
|---|---|---|---|---|---|
| Urinary ACR (mg/dL) | 0.532 | 0.398–0.662 | 43.33 | 76.67 | 0.683a |
| eGFR (mL/min) | 0.538 | 0.405–0.668 | 46.67 | 73.33 | 0.616a |
| Urinary nephrin (ng/mL) | 0.993 | 0.928–1.000 | 100.00 | 93.33 | 0.0001b |
Abbreviations: ACR, albumin creatinine ratio; AUC, area under the curve; CI, confidence Interval; eGFR, estimated glomerular filtration rate; ROC, receiver operating characteristic.
a Not significant.
b Highly significant.
Univariate linear regression analysis was done by using eGFR as dependent variable and urinary ACR and urinary nephrin as independent variables and showed a significant inverse association. Along with that we also analyzed urinary ACR as dependent variable and urinary nephrin as the independent variable and showed a direct association. The scatter plots showed a relationship between eGFR, urinary ACR, and urinary nephrin (r = 0.87, 0.65, and 0.66, respectively, p-values < 0.001) (►Fig. 6). Hence, based on these findings urinary nephrin is identified as the best marker for diagnosis of DN then urinary ACR.

- Univariate linear regression analysis for early diagnosis of diabetic nephropathy.
Conclusion
The outcome of this study showed that urinary nephrin might be a better marker than urinary ACR for predicting early onset of nephropathy in patients with T2DM, because urinary nephrin levels elevated and there was no change in urinary ACR levels in T2DM patients with normoalbuminuria.
Authors' Contributions
V.G. contributed to study design, selection of subjects, collection of samples, processing, data analysis, and writing manuscript. M.M. contributed to assisting in the study design, selection of subjects, collection of samples, processing, data analysis, and writing manuscript. V.K.G. contributed to assisting in the study design, selection of subjects, collection of samples, processing, data analysis, and writing manuscript.
Ethical Approval
The subcommittee constituted by institutional ethical committee, Basaveshwara Medical College and Hospital, Chitradurga, Karnataka, India has reviewed and discussed my protocol on 28/03/2019 to conduct the research project (Ref. BMC&H/IEC/2018–2019/07).
Conflict of Interest
None declared.
Funding
None.
References
- Determination of serum adiponectin levels in type 2 diabetes patients of the Saudi population in the Al-Jouf region. Rom J Diabetes Nutr Metab Dis. 2020;3:1-10.
- [Google Scholar]
- Adiponectina and body mass index in type 2 diabetes mellitus. Int J Contemp Med Res. 2020;4:1-4.
- [Google Scholar]
- Prevalence of diabetes and its determinants in the young adults Indian population-call for yoga intervention. Front Endocrinol. 2020;11:1-9.
- [CrossRef] [PubMed] [Google Scholar]
- The role of novel biomarkers in predicting diabetic nephropathy: a review. Int J Nephrol Renovasc Dis. 2017;10:221-231.
- [CrossRef] [PubMed] [Google Scholar]
- Therapy with atorvastatin versus rosuvastatin reduces urinary podocytes, podocyte-associated molecules, and proximal tubule dysfunction biomarkers in patients with type 2 diabetes mellitus: a pilot study. Ren Fail. 2017;39(01):112-119.
- [CrossRef] [PubMed] [Google Scholar]
- Urinary podocin level as a predictor of diabetic kidney disease. J Nephropathol. 2019;8(03):26.
- [CrossRef] [Google Scholar]
- Normoalbuminuric renal-insufficient diabetic patients: a lower-risk group. Diabetes Care. 2007;30(08):2034-2039.
- [CrossRef] [PubMed] [Google Scholar]
- The inflammatory and hemostatic cardiovascular risk marke during acute hyperglycemic crisis in type 1 and type 2 diabetes. J Med Biochem. 2019;38(02):126-133.
- [CrossRef] [PubMed] [Google Scholar]
- Urinary nephrin is earlier, more sensitive and specific marker of diabetic nephropathy than microalbuminuria. J Med Biochem. 2020;39(01):83-90.
- [CrossRef] [PubMed] [Google Scholar]
- FinnDiane Study Group. Polymorphisms in the nephrin gene and diabetic nephropathy in type 1 diabetic patients. Kidney Int. 2003;63(04):1205-1210.
- [CrossRef] [PubMed] [Google Scholar]
- Dysregulated nephrin in diabetic nephropathy of type 2 diabetes: a cross sectional study. PLoS One. 2012;7(05):e36041.
- [CrossRef] [PubMed] [Google Scholar]
- Standards of medical care in diabetes. Diabetes Care. 2017;40(01):S1-S135.
- [CrossRef] [Google Scholar]
- US renal data system 2016 annual data report: epidemiology of kidney disease in the United States. Am J Kidney Dis. 2017;69(3, Suppl 1):A7-A8.
- [CrossRef] [PubMed] [Google Scholar]
- K/DOQI clinical practice guidelines for chronic kidney disease: evaluation, classification, and stratification. Am J Kidney Dis. 2002;39(2, Suppl 1):S1-S266.
- [Google Scholar]
- International Diabetic Nephropathy Study Group. The early natural history of nephropathy in type 1 diabetes: II. Early renal structural changes in type 1 diabetes. Diabetes. 2002;51(05):1580-1587.
- [CrossRef] [PubMed] [Google Scholar]
- Temporal profile of diabetic nephropathy pathologic changes. Curr Diab Rep. 2013;13(04):592-599.
- [CrossRef] [PubMed] [Google Scholar]
- AGE, RAGE, and ROS in diabetic nephropathy. Semin Nephrol. 2007;27(02):130-143.
- [CrossRef] [PubMed] [Google Scholar]
- Podocyte vascular endothelial growth factor (Vegf164) overexpression causes severe nodular glomerulosclerosis in a mouse model of type 1 diabetes. Diabetologia. 2011;54(05):1227-1241.
- [CrossRef] [PubMed] [Google Scholar]
- A study of association of urinary nephrin with albuminuria in patients with diabetic nephropathy. Indian J Nephrol. 2021;31(02):142-148.
- [CrossRef] [PubMed] [Google Scholar]
- Diabetic nephropathy: diagnosis, prevention, and treatment. Diabetes Care. 2005;28(01):164-176.
- [CrossRef] [PubMed] [Google Scholar]
- Markers of diabetic nephropathy. J Diabetes Complications. 1998;12(01):43-60.
- [CrossRef] [PubMed] [Google Scholar]
- Urinary proteases degrade albumin: implications for measurement of albuminuria in stored samples. Ann Clin Biochem. 2010;47(Pt 2):151-157.
- [CrossRef] [PubMed] [Google Scholar]
- Triptolide combined with irbesartan synergistically blocks podocyte injury in a type 2 diabetes rat model [in Chinese] Zhonghua Nei Ke Za Zhi. 2012;51(02):117-122.
- [Google Scholar]
- Diagnostic sensitivity of biomarkers in assessing the occurrence and progression of diabetic nephropathy. Eur J Mol Clin Med. 2021;8(03):1-18.
- [Google Scholar]
- Use of protein: creatinine ratio in a random spot urine sample for predicting significant proteinuria in diabetes mellitus. Nepal Med Coll J. 2010;12(02):100-105.
- [Google Scholar]
- Nephrinuria associates with multiple renal traits in type 2 diabetes. Nephrol Dial Transplant. 2011;26(08):2508-2514.
- [CrossRef] [PubMed] [Google Scholar]
- Expression of human nephrin mRNA in diabetic nephropathy. Nephrol Dial Transplant. 2004;19(02):380-385.
- [CrossRef] [PubMed] [Google Scholar]
- Proximal tubule dysfunction is associated with podocyte damage biomarkers nephrin and vascular endothelial growth factor in type 2 diabetes mellitus patients: a cross-sectional study. PLoS One. 2014;9(11):e112538.
- [CrossRef] [PubMed] [Google Scholar]
- Assessment of nephrin and podocin levels in the urine of patients with diabetes mellitus. Nephrology (Saint-Petersburg). 2017;21(02):33-40.
- [CrossRef] [Google Scholar]


