
Translate this page into:
Effect of internal audit-guided intervention on quality indicators in the processing and reporting of complete hemogram

*Corresponding author: Prabhu Manivannan, Department of Pathology, Jawaharlal Institute of Postgraduate Medical Education and Research, Puducherry, India. drprabhumanivannan@gmail.com
-
Received: ,
Accepted: ,
How to cite this article: Muhammed E, Babu V, Manivannan P, Nair NS. Effect of internal audit-guided intervention on quality indicators in the processing and reporting of complete hemogram. J Lab Physicians. doi: 10.25259/JLP_307_2024
Abstract
Objectives:
The internationally accepted standard for clinical laboratories is an International Organization for Standardization 15189. In this study, we evaluated the effect of internal audit guided intervention on quality indicators in the processing and reporting of complete hemogram samples.
Materials and Methods:
We conducted the study in two phases and recruited 38,129 hemogram samples. We assessed five quality parameters and the results obtained (Phase I) were audited, appropriate interventions and amendments were done over the next 2 months. In the Phase II, the same quality parameters were analyzed and compared the results of Phases I and II.
Statistical analysis:
The continuous variables were compared using a paired “t”-test (Parametric variables). All statistical analyses were carried out at a 5% level of significance, with P < 0.05 considered statistically significant.
Results:
The sample rejection rate had substantially reduced by 54%. Internal quality control results showed significant improvement, and there was a substantial increase in critical value entries (nearly 3 times) in Phase II. However, the turn-around time was slightly increased in Phase II (173 min vs. 130 min). Overall, the internal audit guided intervention helped us in external quality assurance services by improving the z-score (standard score) for both accuracy and precision testing.
Conclusions:
This study improved our laboratory techniques, including quality control, and better documentation, and ensured the delivery of high-quality reports.
Keywords
Complete hemogram
Internal audit
International Organization for Standardization 15189
Quality indicators

INTRODUCTION
Laboratories play an absolutely essential role in the overall quality of healthcare. All laboratories ensure that results are accurate and timely, allowing patients to get the best care as quickly as possible. The major decisions depend entirely on laboratory test results; therefore, the utmost priority is always a high-quality report from the laboratory.[1] The quality of the laboratory indicates that the services are free from mistakes. This can be achieved by enrolling the laboratories in an accreditation program.[2]
Accreditation is the process of an independent evaluation of conformity assessment against recognized standards to ensure impartiality and competence.[2,3] Accreditation is often compulsory in the Western world, whereas in India, it remains voluntary. The apex body for accreditation in India is the National Accreditation Board for Testing and Calibration Laboratories (NABL) which is a Constituent Board of Quality Council of India.[4] It usually assesses the technical competence of medical and calibration laboratories, proficiency testing (PT) providers, and reference material producers through third-party evaluations. These authorities inspect laboratories to check their compliance with the International Organization for Standardization (ISO) 15189 and the International Electrotechnical Commission (IEC) standard 17025.[5,6]
The audit is defined as an “independent, systematic and recording process for acquiring evidence and estimating it impartially to determine the extent to which necessary criteria are satisfied.”[6,7] Laboratory auditing has two components, namely, management and technical components and also comprises internal and external audits. An external audit is usually composed of assessments done by authorities from outside the laboratories, whereas an internal audit is usually conducted by the authorities working in one particular portion of the laboratory assessing another area within the same laboratory. These audits provide valuable details regarding the performance of the laboratory and the compliance requirements.[7,8]
The aims and objectives of this study were to determine and verify the compliance of our laboratory with the requirements of the quality management system, including analytical methods, standard operating procedures (SOP), the quality manual, and internal laboratory policies. In addition, this study also aimed to assess the impact of the internal audit-guided intervention on the process and reporting of hemograms in accordance with ISO 15189 and NABL specific document 112.
MATERIALS AND METHODS
Study setting
The present study was carried out over 1 year, from January 2019 to December 2019, in the hematology laboratory, Department of Pathology at a tertiary care center in Southern India. All hemogram samples were handled according to SOPs, and analyses were performed using the Sysmex XT-2000i hematology analyzer.
Study design and participants
Interventional study involving humans in a single group.
Sample size calculation
Based on data from the past 2 years in our laboratory, approximately 180 samples per day were expected to be recruited during an 8-month study period, conducted in two phases (Phases I and II).
Sampling technique
Consecutive samples were received for a complete hemogram in our laboratory.
All samples received in our laboratory for complete hemogram on all working days between 9 am and 4.30 pm during weekdays and between 9 am and 1 pm on Saturdays.
This study was carried out in two phases in the main hemogram laboratory after obtaining ethical clearance from the Institute Ethics Committee (JIP/IEC/2018/405). We conducted an internal audit to assess technical requirements in accordance with ISO 15189:2012 and NABL specific document 112.
The following quality indicators were analyzed as parameters:
Number of rejected samples and their reasons
Internal quality control (IQC) results
Number of critical value entries
Turnaround time (TAT)
Performance in PT/external quality assurance services (EQAS).
During the initial 4 months of the Phase I study, we collected data on quality indicators and compared them against NABL standards. Corrective measures were taken if these data did not meet the NABL requirements, and necessary amendments were made to techniques and documentation in the next 2 months.
During the next 4 months of the Phase II study period, we analyzed the data on the same quality indicators to assess the effects of the previous changes made in Phase I. At the end of the study period, we compiled and compared the data from Phase I and Phase II.
Data management and statistical analysis
Categorical data were expressed as frequency and percentage and continuous data were expressed as mean with standard deviation or median with interquartile range, depending on the distribution of the collected data. Continuous variables were compared using a paired “t”-test for parametric data. All statistical analyses were carried out at a 5% level of significance, and P < 0.05 was considered as statistically significant.
RESULTS
All samples received during the study period in the hematology laboratory for a complete hemogram were recruited in this study. A total of 38,129 samples were included in the study during the two phases of the study period (Phase I: January–April 2019 and Phase II: September–December 2019), handled according to our SOP, and analyzed using the Sysmex XT-2000i hematology analyzer.
We conducted an internal audit on the technical requirements in the processing and reporting of complete hemograms in accordance with ISO 15189:2012 and NABL-specific document 112. The following quality indicators were analyzed as parameters and compared between Phase I and Phase II.
Number of rejected samples and their reasons
During the Phase I period, we rejected samples according to our previous laboratory protocol, whereas minor amendments were made in Phase II, and samples were rejected in accordance with ISO 15189:2012 and NABL-specific document 112 guidelines.
During Phases I and II, we rejected 781 and 281 samples, respectively, based on various reasons. We compared the number of rejected samples in Phases I and II [Table 1] and their reasons and percentages are highlighted in Figure 1a. The major reason was that patients were not enrolled in the hospital information system (HIS) in both phases. This issue could not be reduced in our study, because most of the patients almost always outnumbered the bed availability. These patients were either waitlisted for the want of bed or under observation, and hence, the rejection rate did not decrease even in Phase II.
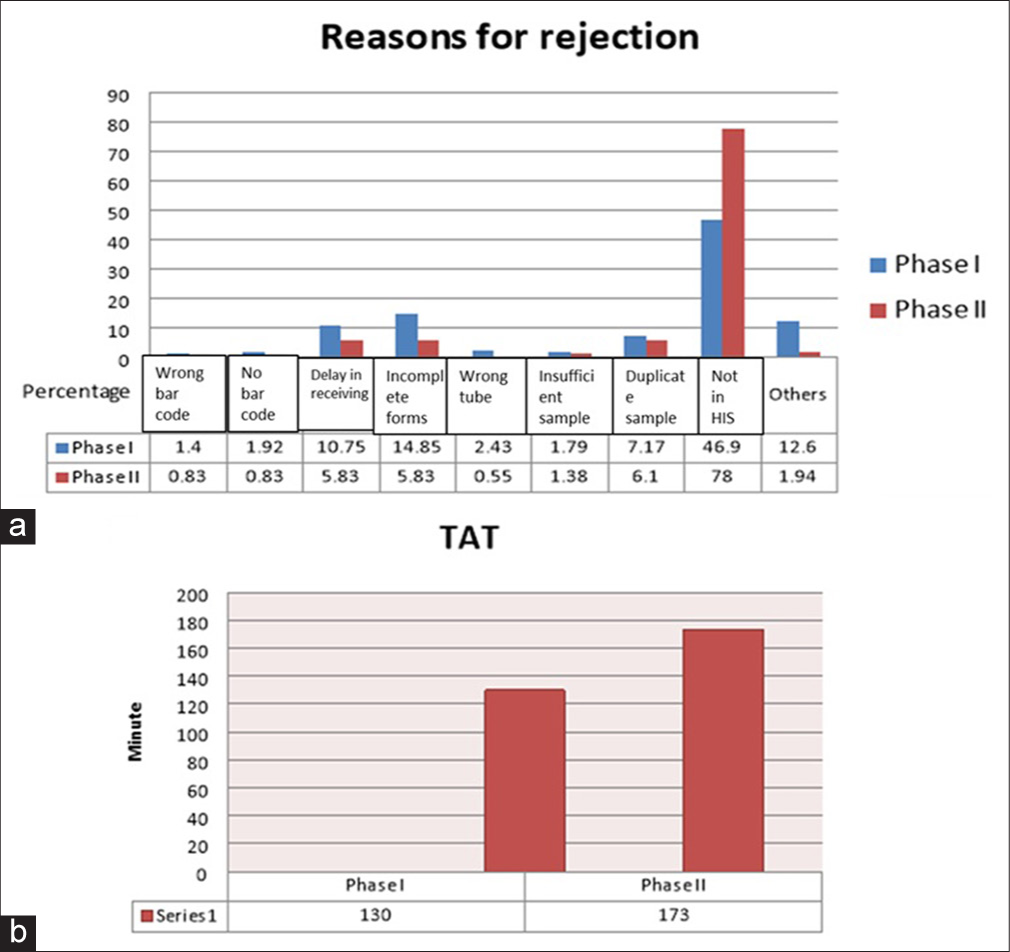
- (a) Comparison of percentage of rejected samples and their reasons in Phases I and II; and (b) comparison of Phases I and II on the basis of turnaround time. TAT: Turn around time.
| Reasons for rejection | Phase I (January-April 2019) |
Phase II (September-December 2019) | Reduction in percentage between Phases I and II (%) |
|---|---|---|---|
| Wrong bar code | 11 | 03 | 73 |
| No bar code | 15 | 03 | 80 |
| Delay in receiving the samples | 84 | 21 | 75 |
| Incomplete form | 116 | 21 | 82 |
| Wrong tubes | 19 | 02 | 90 |
| Insufficient sample | 14 | 05 | 65 |
| Duplicate sample | 56 | 22 | 61 |
| Not assigned in HIS | 367 | 281 | 23 |
| Others (sample and form mismatch, clotted sample) | 99 | 07 | 93 |
| Total | 781 | 365 | 54 |
HIS: Hospital information system
After giving adequate training to all the laboratory personnel according to NABL guidelines, we could able to significantly reduce the various rejection reasons by a total of 54%. These included sample and form mismatch (93%), wrong (90%)/no barcodes (80%) on the requisition form, incompletely filled forms (82%), delays in receiving samples (75%), samples received in wrong tubes (90%), insufficient (65%), duplicate (61%), or clotted samples (93%) [Table 1 and Figure 1a].
Internal quality control (IQC) results
In our laboratory, IQC was carried out using three levels of QC samples, namely, L1, L2, and L3 (L1: low-value reference QC, L2: normal-value reference QC, and L3: high-value reference QC). A random sampling technique was used every third day to assess IQC results in Phases I and II. Only major reportable parameters, such as red blood cell (RBC) count, hemoglobin (HGB), hematocrit (HCT), mean corpuscular volume (MCV), mean corpuscular hemoglobin (MCH), MCH concentration, total white blood cell (WBC) count, and platelets (PLT), were analyzed.
Based on the data presented in Tables 2-4, it was clear that in Levels I, II, and III, all parameters were considered significant except RBC count (P = 0.651), HCT (P = 0.074), and MCV (P = 0.144), respectively. During the study period, there was no major breakdown in the hemogram counter in our hematology laboratory.
| Parameters | Group | N | Mean | SD | CV (%) | P-value |
|---|---|---|---|---|---|---|
| WBC | WBC (1)* | 40 | 3.15 | 0.06 | 1.90 | 0.000 |
| WBC (2)* | 40 | 3.05 | 0.07 | 2.29 | ||
| RBC | RBC (1) | 40 | 2.29 | 0.05 | 2.18 | 0.651 |
| RBC (2) | 40 | 2.29 | 0.02 | 0.87 | ||
| HGB | HGB (1) | 40 | 5.87 | 0.12 | 2.04 | 0.000 |
| HGB (2) | 40 | 5.56 | 0.09 | 1.16 | ||
| HCT | HCT (1) | 40 | 17.65 | 0.34 | 1.92 | 0.000 |
| HCT (2) | 40 | 17.14 | 0.28 | 1.63 | ||
| MCV | MCV (1) | 40 | 77.02 | 2.00 | 2.59 | 0.000 |
| MCV (2) | 40 | 74.77 | 0.74 | 0.98 | ||
| MCH | MCH (1) | 40 | 25.63 | 0.83 | 3.23 | 0.000 |
| MCH (2) | 40 | 24.39 | 0.31 | 1.27 | ||
| MCHC | MCHC (1) | 40 | 33.25 | 0.85 | 2.55 | 0.000 |
| MCHC (2) | 40 | 32.62 | 0.44 | 1.34 | ||
| PLT | PLT (1) | 40 | 65.68 | 8.07 | 12.28 | 0.005 |
| PLT (2) | 40 | 73.53 | 11.83 | 16.08 |
| Parameters | Group | N | Mean | SD | CV (%) | P-value |
|---|---|---|---|---|---|---|
| WBC | WBC (1)* | 40 | 7.38 | 0.16 | 2.16 | 0.004 |
| WBC (2)* | 40 | 7.23 | 0.21 | 2.90 | ||
| RBC | RBC (1) | 40 | 4.33 | 0.03 | 0.69 | 0.000 |
| RBC (2) | 40 | 4.37 | 0.03 | 0.68 | ||
| HGB | HGB (1) | 40 | 12.39 | 0.38 | 3.06 | 0.000 |
| HGB (2) | 40 | 12.04 | 0.09 | 0.74 | ||
| HCT | HCT (1) | 40 | 35.86 | 0.98 | 2.73 | 0.074 |
| HCT (2) | 40 | 35.56 | 0.56 | 1.57 | ||
| MCV | MCV (1) | 40 | 82.92 | 2.37 | 2.85 | 0.000 |
| MCV (2) | 40 | 81.28 | 0.83 | 1.02 | ||
| MCH | MCH (1) | 40 | 28.63 | 0.95 | 3.31 | 0.000 |
| MCH (2) | 40 | 27.52 | 0.30 | 1.09 | ||
| MCHC | MCHC (1) | 40 | 34.54 | 0.74 | 2.14 | 0.000 |
| MCHC (2) | 40 | 33.87 | 0.56 | 1.65 | ||
| PLT | PLT (1) | 40 | 231.53 | 11.30 | 4.88 | 0.001 |
| PLT (2) | 40 | 250.45 | 27.24 | 10.87 |
| Parameters | Group | N | Mean | SD | CV (%) | P-value |
|---|---|---|---|---|---|---|
| WBC | WBC (1)* | 40 | 18.63 | 0.25 | 1.34 | 0.000 |
| WBC (2)* | 40 | 18.37 | 0.22 | 1.19 | ||
| RBC | RBC (1) | 40 | 5.24 | 0.04 | 0.76 | 0.000 |
| RBC (2) | 40 | 5.32 | 0.04 | 0.75 | ||
| HGB | HGB (1) | 40 | 16.46 | 0.27 | 1.64 | 0.042 |
| HGB (2) | 40 | 16.35 | 0.13 | 0.79 | ||
| HCT | HCT (1) | 40 | 47.23 | 0.91 | 1.92 | 0.024 |
| HCT (2) | 40 | 47.63 | 0.54 | 1.13 | ||
| MCV | MCV (1) | 40 | 89.98 | 2.14 | 2.37 | 0.144 |
| MCV (2) | 40 | 89.44 | 0.80 | 0.89 | ||
| MCH | MCH (1) | 40 | 31.40 | 0.70 | 2.22 | 0.000 |
| MCH (2) | 40 | 30.70 | 0.40 | 1.30 | ||
| MCHC | MCHC (1) | 40 | 34.89 | 0.65 | 1.86 | 0.000 |
| MCHC (2) | 40 | 34.32 | 0.49 | 1.42 | ||
| PLT | PLT (1) | 40 | 537.23 | 19.82 | 3.68 | 0.001 |
| PLT (2) | 40 | 558.10 | 26.35 | 4.72 |
Number of critical value entries
Table 5 showed a significant increase (almost 3 times) in the critical value entries during Phase II. There was no change in the malarial parasite reporting across both phases. However, there was a 50% decrease in the HGB critical value entries in Phase II, while all other parameters showed a significant increase in Phase II.
| Critical value entries | Phase I | Phase II | Variation in percentage between Phases I and II (%) |
|---|---|---|---|
| HGB <3.0 g/dL | 10 | 05 | 50 |
| ANC <500 cells/cu.mm | 99 | 288 | 290 |
| Platelet count <20,000 cells/cu. mm | 28 | 45 | 160 |
| Malarial parasite | 03 | 03 | 100 |
| Blasts/Atypical cells | 39 | 163 | 417 |
| Presence of schistocytes (01%) | 04 | 39 | 975 |
| Total | 183 | 543 | 296 |
100% – No change, <100% – reduction, and 100% – increment in entries. HGB: Hemoglobin, ANC: Absolute neutrophil count
Turn around time (TAT)
The HIS provides an option to export data in Excel format, allowing for the automatic calculation of TAT for individual samples. To avoid bias due to outliers, stratified random sampling was performed by selecting every 50th sample for TAT calculation. Based on this randomization, we selected 20 samples per week and calculated the average TAT. Figure 1b shows the average TAT in our laboratory for both phases.
The average TAT during Phase I and II study period were 130 and 170 min, respectively. This slight delay of 40 min was still acceptable according to NABL criteria.
External quality assurance services (EQAS)
In our laboratory, we received an EQAS sample from the All India Institute of Medical Sciences, New Delhi, at 3 months intervals. Table 6 highlights the z-score (standard score) comparison between two phases. In Phase I, overall precision testing was acceptable. However, in accuracy testing, except RBC and MCH, which were out of acceptable range, all other results were within the acceptable range. Both accuracy and precision testing were within the acceptable range in Phase II.
| Parameter | Group | Accuracy testing | Precision testing |
|---|---|---|---|
| WBC | WBC (1)* | −0.31 | 1.15 |
| WBC (2)* | −1.4 | −1.01 | |
| RBC | RBC (1) | −3.16 | 1.28 |
| RBC (2) | −0.66 | 0.54 | |
| HGB | HGB (1) | 1.57 | 0 |
| HGB (2) | 0.39 | −1.35 | |
| HCT | HCT (1) | −0.77 | 0.54 |
| HCT (2) | −0.74 | 0.34 | |
| MCV | MCV (1) | 0.71 | 0.67 |
| MCV (2) | −0.54 | −0.34 | |
| MCH | MCH (1) | 4.81 | 0.67 |
| MCH (2) | 1.08 | 0.9 | |
| MCHC | MCHC (1) | 1.39 | 0 |
| MCHC (2) | 0.84 | 0 | |
| PLT | PLT (1) | −2.09 | 0.13 |
| PLT (2) | 0.84 | 0.58 |
DISCUSSION
A major portion of medical conclusions relies on results from laboratory medicine; therefore, quality holds the highest priority in the laboratory.[1-3] Quality controls in the laboratory were to identify, cut down, and fix the errors in the analytical process before releasing results, thereby improving the quality of laboratory results.[3-10] An internal audit is the process in which the staff working in one area of the laboratory assesses another area within the same laboratory.[9,10]
Quality indicators are required to systematically monitor and evaluate the laboratory’s contribution to patient care.[1-3,9,11] In our study, we mainly focused on technical quality indicators, including the number of rejected samples and their reasons, IQC results, critical value entries, TAT and reasons for delay in dispatching the reports, and finally, EQAS. The first indicator was directly related to pre-analytical variables.[1-3] The IQC and critical value indicators were directly related to analytical phase, while TAT spans around all the three phases of laboratory work-up.[1-3,9-16] Finally, EQAS was directly related to overall performance by the laboratory in comparison with other participating laboratories in the country.[9-12,17]
In Phase I, we processed and reported complete hemogram samples according to our usual laboratory protocol. We analyzed the result of Phase I, documented the deviation, and then implemented the amended protocol in accordance with NABL and ISO guidelines.[1,4-6] After Phase II, we compared the results of both phases to identify the impact of our internal audit.
After providing adequate training to all laboratory personnel pertaining to various pre-analytical variables, we were able to significantly reduce the sample rejection rate by 54% overall. The various reasons for rejection that showed improvement included sample and form mismatches (93%), wrong (90%) or no bar code (80%) in the requisition forms, incompletely filled forms (82%), delay in receiving the samples (75%), samples received in wrong tubes (90%), insufficient (65%), duplicate (61%), and clotted samples (93%).
Our study results closely matched those of Makubi et al.,[15] who conducted an audit on hematology and blood transfusion. They screened 195 laboratory request forms and found out that 100% of those forms did not have complete information such as unique ID number, time of collection, and clinical history. In addition, 82% of specimens were improperly labeled, and 65% of samples did not contain the proper amount of blood.
In this study, the only major reason that could not be reduced in either phase was patients not being enrolled in the HIS. This was because most of the patients almost always outnumbered the bed availability. Many of these patients were either waitlisted for the want of bed or under observation and hence could not bring down this issue even in Phase II.
Regarding the IQC results, we encountered a systematic error in most reportable parameters during Phase I. After doing minor adjustments but not performing a full calibration,[9-11] we demonstrated that all parameters showed significant improvement in Levels I, II, and III, except RBC count (P = 0.651), HCT (P = 0.074), and MCV (P = 0.144), respectively. However, during the study period, there was no major break down in the hemogram counter in our hematology laboratory.
There was a significant increase in the critical value entries[1-3] during Phase II by almost 3 times. However, there was no change in the malarial parasite reporting across both phases. The reason which we presume is that the prevalence of malarial parasite remains the same throughout the year. Notably, there was a 50% decrease in Hb critical value entries in the Phase II, while all other parameters were significantly increased. We could not figure out the exact reason for drop in the Hb critical value entries.
The average TAT during Phase I and II study period were 130 and 170 min, respectively. This delay was expected and primarily due to stringent adherence rejection criteria, strict IQC measures, and the subsequent reporting process in the HIS. Although, TAT increased in Phase II, the quality of results becomes much greater in Phase II. Joshi et al.[16] strongly recommend using an abnormal flagging system in hematology analyzers to be correlated with manual blood smears to avoid false-negatives to improve the performance in a hematology laboratory. This might affect the average TAT. From the above analysis, it is evident that Phase II was more successful than Phase I in terms of EQAS, with improvements in both accuracy and precision testing. The Clinical Laboratory Improvement Amendments (CLIA) guideline[17] helped us in amendments and implementing minor changes, which resulted in better z-score and enhanced overall quality management in our laboratory.
We analyzed changes in laboratory practices to determine whether they are improving in accordance with NABL and ISO guidelines. Our study results were very similar to those of Anjarani et al.[18] conducted in Tehran, Iran. They analyzed the degree of agreement in the terms of quality with national standard guidelines between government and private hospital laboratories. They included 164 questions in the checklist and concluded that standard guidelines were prominently implemented in private hospital laboratories than in government hospital laboratories. They pointed out that lack of encouragement; sincerity and management pressure were the main factors for the poor performance of public health laboratories in their study.[18]
Similarly, the major limitation of this study was the lack of motivation among staff members, which was the primary reason for improper entries in the registers. Continuous monitoring by higher officials became necessary to maintain standards. In addition, this internal audit was performed in 2019 using ISO 15189:2012, while further amendments were released in 2022. Therefore, future studies are warranted using ISO 15189:2022.[6]
We found that this internal audit significantly improved the quality of processing and reporting complete hemograms. It also provided opportunities for improving our own standards and enhanced patient management and care. We strongly recommend that these audits continue, not only in the hemogram laboratory but across all laboratory departments, to ensure continual improvements in our standards.
CONCLUSIONS
This study improved our existing laboratory techniques, including quality control, better documentation, and ensures high-quality reporting. It concludes that the outcomes of internal audits are very important for essential amendments needed to improve the quality management system.
Author contribution:
MZ, VB, PM, SN: Material preparation, data collection and analysis; MZ, VB: Writing the first draft of the manuscript. All authors commented and corrected the previous versions of the manuscript, contributed to the study conception and design, and read and approved the final manuscript.
Ethical approval:
The research/study was approved by the Institutional Review Board at JIPMER, Puducherry, approval number JIP/IEC/2018/405, dated 26th December 2018.
Declaration of patient consent:
The authors certify that they have obtained all appropriate patient consent.
Conflicts of interest:
There are no conflicts of interest
Use of artificial intelligence (AI)-assisted technology for manuscript preparation:
The authors confirm that there was no use of artificial intelligence (AI)-assisted technology for assisting in the writing or editing of the manuscript and no images were manipulated using AI.
Financial support and sponsorship: Nil.
References
- Specific criteria for accreditation of medical laboratories (NABL 112A) 2024. :1-110. Available from: https://nabl-india.org/nabl/index.php?c=publicaccredationdoc&m=index&docType=both&Itemid=199 [Last accessed on 2024 Oct 30]
- [Google Scholar]
- Laboratory organization, management and safety In: Bain BJ, Bates I, Laffan MA, Lewis M, eds. Dacie and Lewis practical haematology (12th ed). London: Churchill Livingstone Elsevier; 2017. p. :511-32.
- [CrossRef] [Google Scholar]
- International Organization for Standardization (ISO/IEC 17025: 2017) General requirements for the competence of testing and calibration laboratories Available from:https://www.iso.org/standard/66912.html [Last accessed on 2024 Oct 30]
- [Google Scholar]
- International Organization for Standardization (ISO/IEC 17000:2020) Available from:https://www.en-standard.eu/bs-en-iso-iec-17000-2020-conformity-assessment-vocabulary-and-general-principles/?msclkid=09e65ac0e9db1351b09e3d0ca2b69683 [[Last accessed on 2024 Oct 30]
- [Google Scholar]
- Medical laboratories-particular requirements for quality and competence. Available from: https://www.iso.org/obp/ui/#iso:std:iso:15189:ed-3:v2:en [Last accessed on 2024 Oct 30]
- [Google Scholar]
- Medical laboratories-particular requirements for quality and competence. Available from: https://www.iso.org/obp/ui/en/#iso:std:iso:15189:ed-4:v1:en [Last accessed on 2024 Oct 30]
- [Google Scholar]
- Guidelines for good clinical laboratory practices (GCLP) In: Indian council of medical research (2nd ed). New Delhi: ICMR; 2021. p. :1-78.
- [Google Scholar]
- Guidelines on integrated public health laboratories. 2021. Available from: https://nhsrcindia.org/sites/default/files/Guidelines%20on%20integrated%20public%20health%20laboratories-dt%2007%20jan.pdf [Last accessed on 2024 Oct 30]
- [Google Scholar]
- Clinical audit in the laboratory. J Clin Pathol. 2009;62:593-7.
- [CrossRef] [PubMed] [Google Scholar]
- CLSI assessments: Laboratory internal audit program; Approved guideline In: CLSI document QMS15-A (2nd ed). United States: Clinical and Laboratory Standard Institute; 2022. p. :1-14.
- [Google Scholar]
- The impact of laboratory accreditation in patient safety and quality care. J Bras Patol Med Lab. 2023;59:16-23.
- [Google Scholar]
- A proposed set of metrics to reduce patient safety risk from within the anatomic pathology laboratory. Lab Med. 2017;48:195-201.
- [CrossRef] [PubMed] [Google Scholar]
- Accreditation, setting and experience as indicators to assure quality in oncology biomarker testing laboratories. Br J Cancer. 2018;119:605-14.
- [CrossRef] [PubMed] [Google Scholar]
- A review on quality management system in laboratory testing. World J Biol Pharm Health Sci. 2024;19:173-88.
- [CrossRef] [Google Scholar]
- Audit of clinical-laboratory practices in haematology and blood transfusion at Muhimbili National Hospital in Tanzania. Tanzan J Health Res. 2012;14:257-62.
- [CrossRef] [PubMed] [Google Scholar]
- Evaluation and correlation of abnormal cell flagging of automated haematology analyzer with peripheral blood film at a hematology laboratory in tertiary care oncology centre. Int J Cur Res Rev. 2020;12:20-5.
- [CrossRef] [Google Scholar]
- Clinical Laboratory Improvement Amendments of 1988 (CLIA) proficiency testing regulations related to analytes and acceptable performance. Federal Register. 2019;84:1536-67. Available from:https://www.federalregister.gov/documents/2022/07/11/2022-14513/clinical-laboratory-improvement-amendments-of-1988-clia [Last accessed on 2024 Oct 28]
- [Google Scholar]
- Establishment of national laboratory standards in public and private hospital laboratories. Iran J Public Health. 2013;42:96-101.
- [Google Scholar]


