Translate this page into:
Sigma Metrics: A Valuable Tool for Evaluating the Performance of Internal Quality Control in Laboratory
This article was originally published by Thieme Medical and Scientific Publishers Pvt. Ltd. and was migrated to Scientific Scholar after the change of Publisher.
Abstract
Background
Six Sigma is a widely accepted quality management system that provides an objective assessment of analytical methods and instrumentation. Six Sigma scale typically runs from 0 to 6, with sigma value above 6 being considered adequate and 3 sigma being considered the minimal acceptable performance for a process.
Methodology
Sigma metrics of 10 biochemistry parameters, namely glucose, triglycerides, high-density lipoprotein (HDL), albumin, direct bilirubin, alanine transaminase, aspartate transaminase, urea nitrogen, creatinine and uric acid, and hematology parameters such as hemoglobin (Hb), total leucocyte count (TLC), packed cell volume (PCV), mean corpuscular volume (MCV), mean corpuscular hemoglobin (MCH), mean corpuscular hemoglobin concentration (MCHC), and platelet were calculated by analyzing internal quality control (IQC) data of 3 months (June–August 2019).
Results
Sigma value was found to be > 6 for triglyceride, HDL, Hb, TLC, and MCH, signifying excellent results and no further modification with respect to IQC. Sigma value was between 3 and 6 for glucose, albumin, creatinine, uric acid, PCV, and MCHC, implying the requirement of improvement in quality control (QC) processes. Sigma value of < 3 was seen in AST, ALT, direct bilirubin, urea nitrogen, platelet, and MCV, signifying suboptimal performance.
Discussion
Six Sigma provides a more quantitative framework for evaluating process performance with evidence for process improvement and describes how many sigmas fit within the tolerance limits.
Thus, for parameters with sigma value < 3, duplicate testing of the sample along with three QCs three times a day may be used along with stringent Westgard rules for rejecting a run.
Conclusion
Sigma metrics help assess analytical methodologies and augment laboratory performance.
Keywords
biochemistry
hematology
quality
Sigma

Introduction
Six Sigma is a management strategy that seeks to identify and remove the causes of defects (errors), thereby improving the quality of process outputs.[1] Quality control (QC) is the foundation for ensuring accuracy and precision of the analytical process and detection of immediate error. It involves two basic types of schemes—external QC (EQC) and internal QC (IQC).[2]
EQC analyzes and reports of control samples given by an external agency periodically while IQC ensures continuous monitoring of the analytical system by QC measures conducted in house at regular intervals. Therefore, it guarantees the results are reliable before they are released. In 1981, James O. Westgard proposed several statistical process control rules used with Levey–Jennings chart for evaluating QC performance. He proposed that both EQC and IQC, if used alone, are not enough for assessing the exact number of defects or errors in a laboratory.[3] Therefore, using these QC measures along with Six Sigma will help the laboratory to give more accurate results.
Six Sigma is about defects or, if we translate into International Organization for Standardization (ISO) terminology, nonconformances. For the laboratory, we are more comfortable thinking about false positives, false negatives, and outliers as the manifestations of our errors. Six Sigma is a technique or metric to measure the performance of processes as a rate of defects-per-million opportunities (DPM or DPMO) and then minimize these defects.[3,4] To reduce variation within a program, Six Sigma strategy involves measurement of an error followed by analysis which eventually leads to formulation of strategies to improve the process and control the errors.
To eliminate or reduce all variation in a process is the ultimate goal of Six Sigma, in its simplest distillation. For example, variation in a process leads to wasted effort and resources on retesting and workarounds. Reducing defects reduces costs, and improves performance and profitability. A process must try achieving the goal of Six Sigma to deliver both quality and efficiency. The quantitative goal of Six Sigma is to create a process that minimizes variation until six standard deviations can fit within the tolerance limit. Approximately three defects will occur per million opportunities at the level of Six Sigma performance (world-class quality performance).[5,6]
Objectives
The objectives of this study are as follows:
To analyze the QC of both biochemistry and hematology analytes using sigma metric method.
To plan the frequency of IQC according to the results of Six Sigma metric analysis.
Material and Methods
The study was conducted at the Department of Laboratory Medicine, Command Hospital Air Force, Bengaluru, Karnataka, India. We analyzed Sigma metrics of 16 parameters (eight parameters each in biochemistry and hematology) using Siemens Automated Biochemistry Analyzer and Sysmex Automated Haematology Analyser (Xt2000i). IQC data of 16 analytes was analyzed retrospectively over a period of 3 months from Jun 2019 to August 2019. Two levels of QC materials (L1 and L2) were assayed before commencing reporting of patient samples every day. The instruments were calibrated regularly. The biochemistry analytes assessed were aspartate transaminase (AST), glucose, cholesterol, triglyceride, urea, albumin, alkaline phosphatase (ALP), and total bilirubin. The hematology parameters analyzed included hemoglobin, while blood cell (WBC), red blood cell (RBC), hematocrit, MCV, MCH, MCHC, and platelet count.
Sigma value was calculated with the following formulas:
Total allowable error (TEa): It is the total allowable difference from accepted reference value seen in the deviation of single measurement from the target value. TEa values of various parameters were taken from Clinical Laboratories Improvement Act (CLIA) guidelines.
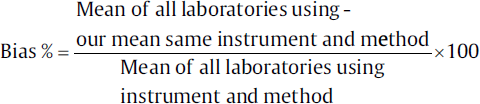
Bias: Bias is the systematic difference between the expected results obtained by the laboratory's test method and the results that would be obtained from an accepted reference method. Bias was derived as follows:
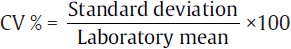
Coefficient of variance (CV): CV% is the analytical coefficient of variation of the test method. CV is calculated as follows:
Sigma metrics were calculated from CV, percentage bias, and TEa for the parameters by the following formula:
Σ(σ) = (TEa− bias)/CV%
The results of all the eight biochemistry analytes and eight hematology analytes were tabulated in ►Tables 1 to 3.
| Analyte | June 2019 | July 2019 | August 2019 | TEa | ||||||
|---|---|---|---|---|---|---|---|---|---|---|
| CVL1 | CVL2 | Bias | CVL1 | CVL2 | Bias | CVL1 | CVL2 | Bias | ||
| AST | 1.52 | 1.09 | 5.0 | 2.25 | 1.9 | 7.0 | 0.2 | 0.6 | 6.12 | 20 |
| Cholesterol | 1.3 | 0.66 | 0.75 | 4.4 | 2.5 | 3.9 | 2.2 | 2.4 | 7.26 | 10 |
| Glucose | 1.4 | 2.4 | 5.8 | 3.7 | 3.5 | 1.1 | 1.6 | 1.8 | 4.8 | 10 |
| Triglyceride | 1.34 | 3.9 | 0.14 | 1.9 | 1.8 | 0.21 | 1.9 | 1.5 | 4.49 | 25 |
| Urea | 6.72 | 6.25 | 4.4 | 8.08 | 5.06 | 2.03 | 11.05 | 4.5 | 0.19 | 10 |
| Albumin | 1.34 | 0.68 | 0.68 | 1.21 | 1.08 | 3.77 | 0.8 | 1.5 | 6.57 | 10 |
| ALP | 1.1 | 3.31 | 3.31 | 2.71 | 2.0 | 6.59 | 1.6 | 2.0 | 9.4 | 20 |
| Total | 6.6 | 4.5 | 6.06 | 5.45 | 2.3 | 9.8 | 7.09 | 0.9 | 17.8 | 20 |
| Analyte | June 2019 | July 2019 | August 2019 | TEa | ||||||
|---|---|---|---|---|---|---|---|---|---|---|
| CVL1 | CVL2 | Bias | CVL1 | CVL2 | Bias | CVL1 | CVL2 | Bias | ||
| WBC | 1.4 | 2.0 | 0.2 | 1.6 | 2.7 | 0.4 | 1.8 | 2.8 | 1.0 | 15 |
| RBC | 0.6 | 0.5 | 0.9 | 0.7 | 0.9 | 0.9 | 0.5 | 0.5 | 0.7 | 6 |
| HGB | 0.7 | 0.9 | 1.8 | 0.7 | 1.1 | 2.5 | 0.8 | 0.5 | 1.8 | 7 |
| HCT | 0.8 | 0.6 | 4.8 | 0.9 | 1.3 | 2.4 | 0.7 | 0.7 | 3.5 | 6 |
| MCV | 1.5 | 0.6 | 3.3 | 1.0 | 0.6 | 1.5 | 1.8 | 0.5 | 2.8 | 7 |
| MCH | 0.8 | 0.9 | 0.3 | 0.7 | 1.1 | 0.8 | 0.8 | 0.6 | 0.8 | 7 |
| MCHC | 2.0 | 1.1 | 0.5 | 1.7 | 1.0 | 0.6 | 1.9 | 0.7 | 1.5 | 10 |
| Plt | 1.4 | 3.1 | 1.0 | 1.7 | 4.0 | 1.8 | 2.8 | 1.3 | 0.9 | 20 |
| Sigma metrics | L1 | L2 |
|---|---|---|
| < 3 | Cholesterol, total bilirubin, urea, platelet | Glucose, urea, alkaline phosphatase, Hct |
| 3–6 | Glucose, albumin, Hct, MCV, MCHC | Cholesterol, albumin, total bilirubin, WBC, HGB |
| > 6 | AST, triglycerides, alkaline phosphatase, WBC, RBC, HGB, MCH | AST, triglycerides, MCV, MCH, Plt, RBC |
Discussion
To overcome the serious errors originating in clinical laboratories, a new perspective and approach seems to be essential. All laboratory procedures are prone to errors because in many tests, the rate of human intervention is higher than expected. It appears that the best solution for analyzing problems in clinical laboratories is the application of Six Sigma methodology.[7]
The number of errors or defects per million products or tests is a measure of the performance of a laboratory. Sigma metrics are being adopted as a universal measure of quality, and we can measure the performance of testing processes and service provision using sigma metrics.[6]
Method validation studies and application of QC samples have considerably reduced the error rates of the analytical phase.[8,9] A simple technique that we can use in our laboratories is to translate the method validation results into sigma metrics.[6,10] Performance is characterized on a sigma scale, just as evaluating defects per million; values range from 2 to 6, where “state-of-the-art” quality is 6 or more. In terms of Six Sigma performance, if a method has a value less than 3, that method is considered to be unreliable and should not be used for routine test purposes. A method with low sigma levels would likely cost a laboratory a lot of time, effort, and money to maintain the quality of test results.[7]
In our study we analyzed sigma values of eight biochemistry analytes from June 19 to August 19. Similar study was performed by Adiga et al[1] wherein sigma values of 15 biochemistry analytes were calculated and documented. The results of Adiga et al's study are given in ►Table 4.
| Sigma metrics | L1 | L2 |
|---|---|---|
| < 3 | Urea, ALT, BD, BT, Ca, creatinine | Urea, AST, BD |
| 3–6 | Glucose, AST, cholesterol, uric acid, total protein | ALT, cholesterol, BT, calcium, creatinine, glucose |
| > 6 | Triglyceride, ALP, HDL, albumin | TG, uric acid, ALP, HDL, albumin, total protein |
Nanda et al[2] performed a similar study wherein Sigma metrics were calculated from CV, percentage bias, and TEa for 13 biochemistry parameters—glucose, urea, creatinine, total bilirubin, total protein, albumin, uric acid, total cholesterol, triglycerides, chloride, serum glutamic oxaloacetic acid transaminase (SGOT/AST), serum glutamic pyruvic transaminase (SGPT/ALT), and ALP (►Table 5).
| Sigma metrics | Parameter |
|---|---|
| < 3 | Total bilirubin, uric acid, SGOT, SGPT, and ALP |
| 3–6 | Glucose, creatinine, triglycerides, urea |
| > 6 | Total protein, albumin, cholesterol, chloride |
Thus, we divided the Six Sigma values of all parameters (L1 and L2 values) into three categories:
Parameters with sigma value < 3.
Parameters with sigma value between 3 and 6.
Parameters with sigma value > 6.
We have sigma values < 3 for cholesterol, total bilirubin, urea, platelet (Plt) (L1), glucose, urea, alkaline phosphatase, and haematocrit (Hct) (L2). A very stringent IQC has to be followed for these parameters; the frequency of IQC should be increased and corrective action should be taken for these parameters. Upgraded analyzers and better methodologies may help in achieving sigma values. Thus, sigma metrics values are useful in setting the IQC acceptability criteria.
The frequency of IQC and the criteria for rejection of each QC run for each of the categories mentioned earlier was designed as follows:
Tests > 6 sigma value (excellent tests)—evaluate with two-level QC once a day and 1:3 SD rule.
Tests with sigma values between 3 and 6—evaluate with two-level QC once a day (1:2.5 SD rule).
Tests with sigma values < 3 sigma—evaluate with two- or three-level QC two times a day plus combination of Westgard rules (13S/22S/R4S/41S).
While validating the above tests against Westgard rules, probability of false rejection and probability of error detection must be kept in mind. The term probability of false rejection (Pfr) is used to describe a situation where there are no analytical errors present except for the inherent imprecision or random error of the method. Probability of error detection (Ped) is the term used to describe an analytical error which occurs in addition to the inherent random error. It is desirable to have a high probability of error detection and a low probability of false rejection.1 A test should ideally have high Ped and low Pfr.
Conclusion
Sigma metric analysis is an easy and effective tool for laboratories to determine the performance of their current methods and QC design. Sigma metrics can be used as a guideline by laboratories for planning QC frequency accordingly. This result is an optimized testing process that fulfills the quality required for appropriate test interpretation.
Conflict of Interest
None declared.
References
- Sigma metrics in clinical chemistry laboratory—a guide to quality control. Al Ameen J Med Sci. 2015;8(04):281.
- [Google Scholar]
- Quantitative application of sigma metrics in medical biochemistry. J Clin Diagn Res. 2013;7(12):2689-2691.
- [CrossRef] [PubMed] [Google Scholar]
- et al Quality control by Six Sigma. Biochem Med (Zagreb). 2018;28(02):020904.
- [CrossRef] [PubMed] [Google Scholar]
- ISO 15189:2012 Medical Laboratories—Requirements for Quality and Competence. Zurich, Switzerland: International Standards Organization (ISO); 2012.
- [Google Scholar]
- Evaluating laboratory performance on quality indicators with the six sigma scale. Arch Pathol Lab Med. 2000;124(04):516-519.
- [CrossRef] [PubMed] [Google Scholar]
- Six Sigma Quality Design and Control. (2nd). Madison, WI: Westgard QC Inc; 2006. p. :338.
- [Google Scholar]
- Six Sigma as a quality management tool: evaluation of performance in laboratory medicine. www.intechopen.com. Published August 16, 2010
- [Google Scholar]
- The running of standards in clinical chemistry and the use of the control chart. J Clin Pathol. 1952;5(04):305-311.
- [CrossRef] [PubMed] [Google Scholar]
- The use of control charts in the clinical laboratory. Am J Clin Pathol. 1950;20(11):1059-1066.
- [CrossRef] [PubMed] [Google Scholar]
- Quality management. In: Burtis CA, Ashwood ER, Bruns DE, eds. Tietz Textbook of Clinical Chemistry and Molecular Diagnostics. St Louis, MO: Elsevier Saunders Inc; 2006. p. :485-529.
- [Google Scholar]