
Translate this page into:
Sigma Metric Evaluation of Drugs in a Clinical Laboratory: Importance of Choosing Appropriate Total Allowable Error and a Troubleshooting Roadmap
Address for correspondence: Rashmi Rasi Datta, MD, Department of Biochemistry, Atal Bihari Vajpayee Institute of Medical Sciences (ABVIMS), Dr. Ram Manohar Lohia Hospital, Room No. 20, Nursing Home Lab ABVIMS and Dr. RML Hospital, New Delhi 110001, India (e-mail: rashmi8datta@gmail.com).
This article was originally published by Thieme Medical and Scientific Publishers Pvt. Ltd. and was migrated to Scientific Scholar after the change of Publisher.
Abstract
Objectives
Stringent quality control is an essential requisite of diagnostic laboratories to deliver consistent results. Measures used to assess the performance of a clinical chemistry laboratory are internal quality control and external quality assurance scheme (EQAS). However, the number of errors cannot be measured by the above but can be quantified by sigma metrics. The sigma scale varies from 0 to 6 with “6” being the ideal goal, which is calculated by using total allowable error (TEa), bias, and precision. However, there is no proper consensus for setting a TEa goal, and influence of this limiting factor during routine laboratory practice and sigma calculation has not been adequately determined. The study evaluates the impact of the choice of TEa value on sigma score derivation and also describes a detailed structured approach (followed by the study laboratory) to determine the potential causes of errors causing poor sigma score.
Materials and Methods
The study was conducted at a clinical biochemistry laboratory of a central government tertiary care hospital. Internal and external quality control data were evaluated for a period of 5 months from October 2019 to February 2020. Three drugs (carbamazepine, phenytoin, and valproate) were evaluated on the sigma scale using two different TEa values to determine significant difference, if any.
Statistical Analysis
Bias was calculated using the following formula: Bias% = (laboratory EQAS result − peer group mean) × 100 / peer group mean Peer group mean sigma metric was calculated using the standard equation: Sigma value = TEa − bias / coefficient of variation (CV)%.
Results
Impressive sigma scores (> 3 sigma) for two out of three drugs were obtained with TEa value 25, while with TEa value 15, sigma score was distinctly dissimilar and warranted root cause analysis and corrective action plans to be implemented for both valproate and carbamazepine.
Conclusions
The current study evidently recognizes that distinctly different sigma values can be obtained, depending on the TEa values selected, and using the same bias and precision values in the sigma equation. The laboratories should thereby choose appropriate TEa goals and make judicious use of sigma metric as a quality improvement tool.
Keywords
six sigma
internal quality control
external quality control
total allowable error

Introduction
The diagnostic laboratories are faced with a continuous challenge to deliver dependable results despite increased workloads and limited resources. Around 70% of the patient-related decisions are based on the laboratory-generated results.[1] The estimated error rate in the total testing procedure is 30 to 75% for preanalytical, 4 to 30% for analytical, and 9 to 55% for postanalytical phase.[2] Thus, stringent quality control is an essential requisite to deliver consistent results and contribute toward improved patient care.
Quality is defined as conformance to the requirements of the end users[3] and is assessed in terms of accuracy (closeness to the true value), precision (reproducibility of a test result), sensitivity, and specificity.[4] Measures used to assess the performance quality in a clinical chemistry laboratory are internal quality control (IQC) and external quality assurance scheme (EQAS).
IQC material should have a matrix identical to the patients’ sample and is run as per the accreditation body guidelines. This is interpreted using control charts (Levy–Jennings) and by application of Westgard rules. It confirms that the analytical system is working smoothly, and acts as a check to ensure that the results are reliable enough to be released.
External quality control involves analyzing and reporting of samples supplied by an external agency, at a predefined time interval, usually once a month. It is interpreted by Z-score or standard deviation index.
However, the exact number of errors done by the laboratory during the analytical phase cannot be measured by running internal and external QCs, but they can be quantified with the help of sigma metrics.[5,6] This has emerged as a popular quality management tool for process improvement[7] and can be applied where the process outcome is quantifiable.
The sigma scale varies from 0 to 6 with “6” being the ideal goal of all processes. A method can exceed Six Sigma if variability is sufficiently low as to decrease the defect rate.[8] Employing sigma metrics enables assessment of the quality of laboratory testing and aids in deciding the number of QC that is required to maintain the desired quality. Consequently, both diagnostic equipment manufacturers and clinical laboratories have implemented this approach to reduce operational defects and improve test performance quality.[9-12]
Sigma metrics is calculated by using total allowable error (TEa), bias, and precision. Imprecision is expressed as coefficient of variation (CV%), while bias signifies trueness of the value. The data can be routinely calculated through the use of internal quality controls, in case of imprecision, and through either EQA or peer group programs or, rarely, through direct comparison to reference materials or methods.[13]
To know how a method performs, the laboratory needs to have a tolerance limit, which is commonly referred to as TEa. When the difference between a result and its corresponding true value exceeds the TEa, then the result is erroneous and termed as an outlier. This signifies the medically significant difference from the true value of what is happening with the patient.[14] However, there is no proper consensus for setting a TEa goal for an assay. TEa value selection can lead to significant differences in the evaluation of sigma score[14] as well as have a substantial impact on laboratory operational routines. The influence of this limiting factor during routine laboratory practice and sigma calculation has not been adequately determined.
Stating the above, we aimed to gauge the process performance of three routinely assayed drugs in our laboratory—carbamazepine, phenytoin, and valproate—on the sigma scale using TEa values from different sources while keeping the bias and precision values same for each analyte.
The study evaluates the impact of the choice of TEa value on sigma score derivation and describes a detailed structured approach (followed by the study laboratory) to determine the potential causes for obtaining a poor sigma score and the necessary corrective action plans that can be implemented to rectify and prevent recurrence.
Materials and Methods
The study was conducted at a clinical biochemistry laboratory of a central government tertiary care hospital. Vitros 5600 (Ortho Clinical Diagnostics, USA) dry chemistry analyzer was used for assay of the drugs (carbamazepine, phenytoin, and valproate), based on the principle of reflectance spectrophotometry. Both internal and external quality control data were monitored and evaluated for a period of 5 months from October 2019 to February 2020.
Single level of internal quality control (Bio-Rad Lyphocheck Assayed Clinical Chemistry Control) was assayed daily prior to reporting patient results and internal quality control was processed as per the manufacturer's guidelines. Controls were mixed thoroughly prior to use and repeat freeze/thaw cycles of open vials were avoided.
Precision, expressed as CV%, was determined for the three drugs using a 20-day protocol performed as per CLSI guideline EP5-A2.[15] Usage of a single reagent lot was ascertained for each assay.
Bias was estimated based on the difference between the EQAS result obtained from laboratory's test method and peer group mean. It was computed for each parameter using the following formula:

TEa is a quality concept used to define acceptable analytical performance without generating variation in results that would impact clinical decision-making. It combines both imprecision and bias (trueness) of a method to calculate the impact on a test result.[13] The sigma metrics for the drugs were calculated using TEa goals from different industry standards (►Table 1) to comprehend the effect of TEa on estimates of sigma metrics.
| S. no. | Parameters | October sigma score | November sigma score | December sigma score | January sigma score | February sigma score | Mean sigma score | ||||||
|---|---|---|---|---|---|---|---|---|---|---|---|---|---|
| TEa | TEa 15 | TEa 25 | TEa 15 | TEa 25 | TEa 15 | TEa 25 | TEa 15 | TEa 25 | TEa 15 | TEa 25 | TEa 15 | TEa 25 | |
| 1 | Carbamazepine | 1.38 | 2.75 | 1.15 | 2.25 | 2.05 | 3.72 | 2.29 | 4.70 | 2.43 | 4.84 | 1.86 | 3.65 |
| 2 | Phenytoin | -1.82 | 0.51 | 1.34 | 2.63 | 1.59 | 5.65 | 1.26 | 2.25 | 1.07 | 2.06 | 0.69 | 2.62 |
| 3 | Valproate | 1.67 | 5.09 | 2.31 | 4.49 | 4.77 | 8.26 | 5.32 | 10.58 | 7.03 | 12.29 | 4.22 | 8.14 |
Abbreviations: AAB, American Association of Bioanalysts; CAP, College of American Pathologists; CFX, Canadian Fixed limits from the College of Physicians and Surgeons of Saskatchewan; CLIA, Clinical Laboratory Improvement Amendments; NYS, New York State Dept. of Health (NYSDOH) Clinical Laboratory Evaluation Program; WLSH, Wisconsin State Laboratory of Hygiene.
Sources of TEa:
Carbamazepine: TEa = 25 (CLIA, WLSH, AAB, CAP, CFX) TEa = 15 (NYS)
Phenytoin: TEa = 25 (CLIA, CAP, CFX, WLSH, AAB) TEa = 15 (NYS).
Valproate: TEa = 25 (CLIA, CAP, WLSH, AAB) TEa = 15 (NYS, CFX).
Sigma metric was calculated using the standard equation:

Results
To evaluate the role of TEa in determination of sigma values, two different TEa values for each drug assay were used.
Two sets of sigma metrics (both monthly and average) were obtained for three drug assays over a period of 5 months, using two TEa values taken from different industry standards, as made known in ►Table 1.
Quality is assessed on the sigma scale, with 3 sigma as the minimum allowable sigma for routine performance and sigma of 6 being the world class quality goal.[16] Using TEa value of 25, two out three drugs exhibited impressive average sigma metrics above 3, thus satisfying the laboratory's minimal acceptable criteria on sigma scale. However, strikingly different average sigma values were obtained for the drugs using TEa value of 15. Besides being conspicuously dissimilar, it also warranted root cause analysis and necessary corrective action to be worked upon for valproate and carbamazepine, the latter showing robust performance when the sigma metric was calculated using TEa value 25. The findings obtained clearly depicted that the appropriate choice of TEa is critical and has a significant impact on derivation of sigma score. Liberal TEa choices lead to the possibility of missing out errors while stringent values give rise to false outliers.
The above sigma values were derived from internal quality control and external proficiency testing data over a period of 5 months, as summarized in ►Table 2.
| S. No. | Parameters | October | November | December | January | February | |||||
|---|---|---|---|---|---|---|---|---|---|---|---|
| Bias% | CV% | Bias% | CV% | Bias% | CV% | Bias% | CV% | Bias% | CV% | ||
| 1 | Carbamazepine | 4.91 | 7.31 | 4.5 | 9.13 | 2.77 | 5.97 | 5.48 | 4.15 | 4.9 | 4.15 |
| 2 | Phenytoin | 22.8 | 4.29 | 4.68 | 7.72 | 11.1 | 2.46 | 2.25 | 10.12 | 4.15 | 10.12 |
| 3 | Valproate | 10.1 | 2.93 | 4.43 | 4.58 | 1.3 | 2.87 | 4.9 | 1.9 | 1.65 | 1.9 |
Discussion
Employing sigma metrics in the laboratory offers the advantage of setting up a “quality base line.” It involves quantifying the performance of the test using standard quality control methods, specifying the quality requirements for the test (TEa), analyzing the data, and computing a sigma value.[17]
Good laboratory practice (GLP) requires every individual laboratory to design their own individualized quality control plan (IQCP), based on sigma metric analysis,[18] which prevents unnecessary repeated QC runs that leads to wastage and incurs more operational costs on the institution. Subsequently, based on the sigma metric performance, laboratories can design their QC protocol for both frequency and the number of levels of daily IQC runs based on guidelines of accreditation bodies. Assays with lesser sigma values require more sophisticated control rules, and they can be chosen according to the observed quality, being customized to match each test.
In the present study, we sought to evaluate the role of the TEa values in derivation of sigma score. Sigma value was calculated from the two TEa values (25 and 15) obtained from different sources (source mentioned in ►Table 1 footnotes) for all the three drugs (carbamazepine, phenytoin, and valproate). With TEa value of 25, we obtained impressive sigma score for two out of three drugs, while distinctly dissimilar sigma values were obtained for the drugs using TEa value 15 (►Figs. 1 and 2). It also warranted root cause analysis and corrective action plan to be implemented for valproate and carbamazepine, as per the study laboratory protocol, which necessitates counteractive measures to be taken for problem analytes with a sigma score below 3. Thus, the current study evidently recognized that distinctly different sigma values can be obtained, depending on the TEa values selected and using the same bias and precision values in the sigma equation.
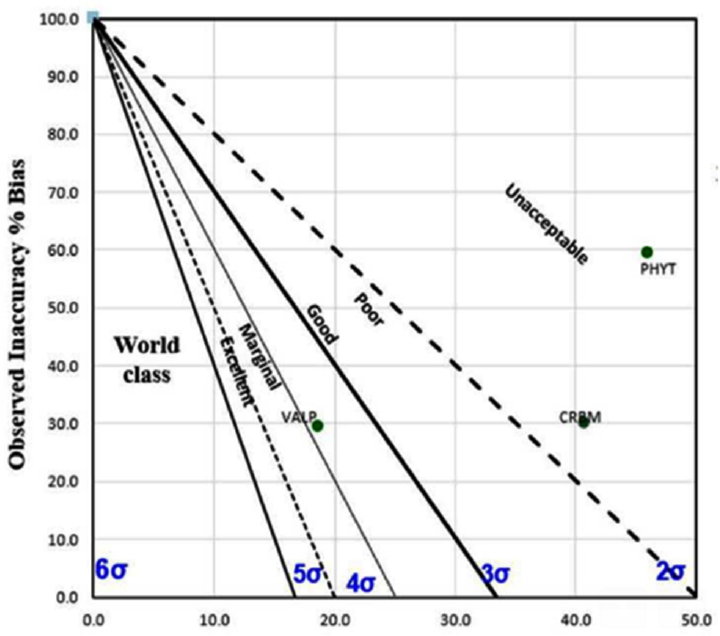
- Method decision chart with total allowable error (TEa) 15 for phenytoin, valproate, and carbamazepine.
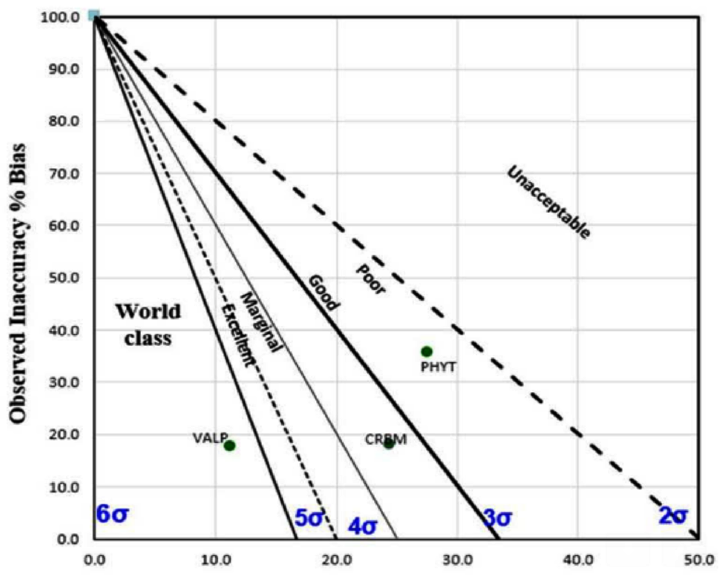
- Method decision chart with total allowable error (TEa) 25 for phenytoin, valproate, and carbamazepine.
TEa sets the limit for both combined imprecision (random error) and bias/inaccuracy (systematic error) that is permissible in a single test result to ensure clinical utility (►Fig. 3). Having a preset quality specification also ensures uniformity across multiple analyzers in the laboratory.
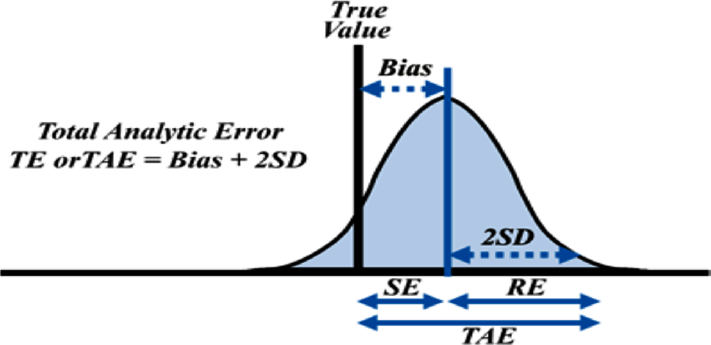
- Concept of total allowable error (TEa).
The choice of TEa is critical and has a striking impact on the sigma metric score, as distinctly illustrated by this study. Appropriateness on the choice of TEa is debatable. While the initial recommendation for a total error criterion was TEa ≥ bias + 2 SD, later papers suggested TEa ≥ bias + 4 SD,[19] while the adoption of Six Sigma concepts[20] suggested TEa ≥ bias + 5 SD and TEa ≥ bias + 6 SD.
The major limitation of the study was that only level one quality control sera was used. The imprecision is better recorded when more than one level of quality control is processed, depending on the range of reportable values and clinical use of the test.
Nevertheless, this study recommends that for any laboratory, choosing TEa from different sources appropriate for individual assays may be desirable. TEa targets should not be too liberal to give a falsely optimistic and visually appealing estimate of quality while missing out on the latent sources of errors and neither should it be too demanding to give rise to false outlier alarms. It should be also taken into consideration that TEa goals are not available for each analyte. In such instances, the laboratories are advised to define their own quality goals to implement optimal analytical quality.
Using Six sigma as quality management tool for process improvement requires detailed evaluation of the entire practices followed by the laboratory from preanalytical stage to the reporting of test results.
Since sigma metric calculation is based on IQC and EQC results, relating the errors obtained during IQC and EQC run to possible causes becomes crucial. Proficiency testing (PT) programs allow laboratories to assess and monitor the quality status of their internal procedures and practices, suitability of the diagnostic systems, as well as accountability and competency of the staff. This also allows investigating the cause of unacceptable performances, apply and monitor corrective actions for defect removal, and verify its effectiveness.[21]
Laboratory errors are often hard to discover and necessitate thorough analysis of the total testing process. The study laboratory has thereby developed a checklist which is routinely followed as per its protocol for handling analytes having poor sigma score (valproate and carbamazepine in the current study) to determine the cause of inconsistent results (►Appendix 1). Thereafter, the observed shortcomings are promptly recorded and addressed, and necessary measures are taken to prevent recurrence.
Adopting the practice of keeping a record of the errors and the strategies devised for corrective actions is essential for the laboratory. This will gradually aid to free the laboratory from similar errors in future. Up to 73% of the laboratory errors are preventable.[22] Another good practice is to store the EQAS sample under stable conditions until the PT result is generated by the EQAS provider. Assaying the material again will enable detecting random errors and help eliminate other sources of errors.
The preanalytical phase has the highest potential for errors, thus preanalytical/presurvey aspects should cover all the factors that may occur prior to sample testing and impact test result.
Analytical flaws are embedded in our total process setup and accounts for < 10% of all errors.[23] Inconsistencies during this phase gives rise to shifts, which if undetected may cause substantial patient harm if it involves the clinical decision thresholds.
Occasionally inconsistent result for a particular parameter may remain unexplained. In such cases, the error may be considered to be random or transient and requires consistent follow-up.
This study thus recommends that to achieve a world-class sigma goal of 6, individual laboratories should have judicious root cause analysis system in place and properly document their corrective and preventive action plans to understand, correct, and prevent future adverse performances.
Over and above, this study will aid individual laboratories in their choice of proper TEa goals and in working out a detailed troubleshooting action plan as a part of their quality improvement tool.
Conclusion
Sigma metrics represent a quality assurance tool that should be monitored periodically to assess changes in assay quality. However, incoherent TEa targets from diverse independent sources are a major variable in the interpretation and the application of sigma metrics. The laboratories should thereby choose appropriate TEa goals, as per their best practical and professional discernment.
Also, to make judicious use of sigma metric as a quality improvement tool, laboratories should have a detailed root cause analysis protocol in place and document their corrective and preventive action plans, with consistent follow-up of adherence to the same.
Authorship Criteria
Lokesh Kumar Sharma: conception and design, drafting the article, revising it critically for important intellectual content, and final approval of the version to be published.
Rashmi Rasi Datta: conception and design, acquisition of data, analysis and interpretation of data, and drafting the article.
Neera Sharma: revising it critically for important intellectual content and final approval of the version to be published.
Financial Support
Nil.
Ethical Approval
Not applicable.
Conflicts of Interest
None declared.
References
- Why is the laboratory an afterthought for managed care organizations? Clin Chem. 1996;42(05):813-816.
- [CrossRef] [PubMed] [Google Scholar]
- Six sigma metrics and quality control in clinical laboratory. Int J Med Res Rev. 2014;2(02):140-149.
- [CrossRef] [Google Scholar]
- Internal quality control: planning and implementation strategies. Ann Clin Biochem. 2003;40(Pt 6):593-611.
- [CrossRef] [PubMed] [Google Scholar]
- Evaluating laboratory performance with the six sigma scale. Arch Pathol Lab Med. 2000;124(12):1748-1749.
- [CrossRef] [PubMed] [Google Scholar]
- Six Sigma as a Quality Management Tool: Evaluation of Performance in Laboratory Medicine Quality Management and Six Sigma. Rijeka, Croatia: InTechOpen 2010:248-261.
- [CrossRef] [Google Scholar]
- Sigma metrics as a tool for evaluating the performance of internal quality control in a clinical chemistry laboratory. J Lab Physicians. 2018;10(02):194-199.
- [CrossRef] [PubMed] [Google Scholar]
- Designing in quality through design control: a manufacturer's perspective. Clin Chem. 1997;43(05):866-872.
- [CrossRef] [PubMed] [Google Scholar]
- The role of in vitro diagnostic companies in reducing laboratory error. Clin Chem Lab Med. 2007;45(06):781-788.
- [CrossRef] [PubMed] [Google Scholar]
- Application of the Six Sigma concept in clinical laboratories: a review. Clin Chem Lab Med. 2007;45(06):789-796.
- [CrossRef] [PubMed] [Google Scholar]
- Quality indicators and specifications for key analytical-extranalytical processes in the clinical laboratory. Five years’ experience using the Six Sigma concept. Clin Chem Lab Med. 2011;49(03):463-470.
- [CrossRef] [PubMed] [Google Scholar]
- Quality control review: implementing a scientifically based quality control system. Ann Clin Biochem. 2016;53(Pt 1):32-50.
- [CrossRef] [PubMed] [Google Scholar]
- Sigma metrics used to assess analytical quality of clinical chemistry assays: importance of the allowable total error (TEa) target. Clin Chem Lab Med. 2014;52(07):973-980.
- [CrossRef] [PubMed] [Google Scholar]
- Evaluation of precision performance of quantitative measurement methods; approved guideline. (2nd). Wayne, PA: CLSI; 2004. /std
- [Google Scholar]
- Six Sigma: The Breakthrough Strategy Revolutionizing The World's Top Corporation. New York, NY: Random House, Doubleday; 2000.
- [Google Scholar]
- Quality control. How labs can apply six sigma principles to quality control planning. Clin Lab News. 2006;32:10-12.
- [Google Scholar]
- Medical Laboratories: Particular Requirements for Quality and Comp-etence. ISO 15189. Geneva: International Organization for Standardization (ISO); 2007.
- [Google Scholar]
- Precision requirements for cost-effective operation of analytical processes. Clin Chem. 1990;36(09):1629-1632.
- [CrossRef] [PubMed] [Google Scholar]
- Six Sigma Quality Design and Control: Desirable Precision and Requisite QC for Laboratory Measurement Processes. Madison, WI: Westgard QC; 2001.
- [Google Scholar]
- The role of the external quality assessment. Biochem Med (Zagreb). 2010;20:160-164.
- [CrossRef] [Google Scholar]
- Errors in a stat laboratory: types and frequencies 10 years later. Clin Chem. 2007;53(07):1338-1342.
- [CrossRef] [PubMed] [Google Scholar]
- Mistakes in a stat laboratory: types and frequency. Clin Chem. 1997;43(8 Pt 1):1348-1351.
- [CrossRef] [PubMed] [Google Scholar]


