
Translate this page into:
A self-established method for the quantitative determination of plasma free hemoglobin utilizing the hemolysis index of Siemens ADVIA 2400 chemistry system

*Corresponding author: Haifeng Xie, Laboratory Medicine Center, Hangzhou Traditional Chinese Medicine (TCM) Hospital Affiliated to Zhejiang Chinese Medical University, Hangzhou, China. haydensure@yeah.net
-
Received: ,
Accepted: ,
How to cite this article: Xie H, Wei J, Luo X. A self-established method for the quantitative determination of plasma free hemoglobin utilizing the hemolysis index of Siemens ADVIA 2400 chemistry system. J Lab Physicians. 2024;16:582-6. doi: 10.25259/JLP_130_2024
Abstract
Objectives:
The significance of the quantitative hemolysis index (HI) obtained from the Siemens ADVIA 2400 Chemistry System remains undisclosed. This study aims to establish a method utilizing HI of Siemens ADVIA 2400 Chemistry System for the quantitative determination of plasma free hemoglobin (fHb).
Materials and Methods:
The performance of the self-established method was assessed following Clinical and Laboratory Standards Institute protocols, which included detection capability, linearity, imprecision, and trueness, using materials derived from residual whole blood samples.
Statistical Analysis:
The analysis of variance was performed using Microsoft Excel, and least-squares linear regression analysis was conducted using MedCalc (Version 20.216). A significance level of P < 0.05 was considered.
Results:
The repeatability and within-laboratory precision both exhibited a coefficient of variation below 1%. The limit of blank was determined to be 0.005 g/L, while the lower limit of detection and lower limit of quantification were found to be 0.050 g/L and 0.085 g/L, respectively. Our self-established method for determining plasma fHb demonstrated linearity across the entire assay range of 0.085~25.2 g/L with an excellent correlation coefficient (R2 = 0.9998). In the method comparison study between Siemens ADVIA 2400 and Sysmex XN-1000, our results indicated a slight bias, with only 5% (2/40) of the plots falling outside the 95% confidence interval. This suggests a high level of agreement observed between these two devices.
Conclusions:
The self-established method was evaluated as a reliable assay with robust performance for quantifying minute quantities of plasma fHb in the ADVIA 2400 chemistry system. Calibration for the HI was deemed necessary when determining plasma fHb.
Keywords
Hemolysis index
Plasma free hemoglobin
Performance evaluation
Spectrophotometry

INTRODUCTION
Hemolysis refers to the lysis of erythrocytes, which results in the release of hemoglobin into plasma. The measurement of plasma free hemoglobin (Hb) has been validated as a clinically significant biomarker in pathological conditions, including intravascular hemolysis, severe sepsis,[1] acute ischemic stroke,[2] and extracorporeal membrane oxygenation.[3]
The quantification of fHb in plasma and other solutions using a spectrometer was described decades ago, and it has since been demonstrated to be feasible.[4] Multiple spectrophotometric measurements have been utilized by automated clinical chemistry analyzers to objectively assess the hemolysis index (HI) of serum/plasma due to its simplicity and low cost. The measurement of HI is typically presented as a semi-quantitative or qualitative result within serum indices and is traditionally considered inappropriate for diagnostic purposes.[5] Nevertheless, recent studies conducted on the Abbott Alinity c and Roche Cobas chemistry analyzers have validated the quantification of fHb using HI, demonstrating methodological robustness.[6,7]
The HI was incorporated into the Siemens ADVIA 2400 chemistry system for qualitative assessment purposes initially. The value and intended usage of the quantitative HI result remains officially undisclosed. In this study, we utilized the HI of Siemens ADVIA 2400 chemistry analyzer to establish a quantitative method for determining fHb.
MATERIALS AND METHODS
Materials
The study was approved by the Institutional Ethics Committee of Hangzhou Traditional Chinese Medicine Hospital, Affiliated with Zhejiang Chinese Medical University. Blood samples used in the experiments were obtained from residual whole blood material collected using ethylenediaminetetraacetic acid-K2 anticoagulant tubes. All samples were stored at 4°C for a maximum duration of 7 days, if necessary.
Instrumentation
The measurement of plasma HI was conducted using the Siemens ADVIA 2400 chemistry system (Siemens Healthcare GmbH, Erlangen, Germany). The HI was set to quantitative mode, which measured the absorbance of plasma diluted by a factor of 4.2 (25 μL sample volume + 80 μL 0.9% saline solution) at wavelengths of 571 nm and 658 nm relative to a 0.9% saline solution and calculated using an embedded preset algorithm. The absorbance of hemolysis was adjusted in the presence of lipemia as follows: Corrected hemolysis absorbance = hemolysis absorbance - 1.1 × lipemia absorbance, while icterus theoretically did not exhibit interference at 571 nm.[8]
Preparation of standard hemoglobin solutions and quality control (QC) samples
Erythrocytes were enriched through centrifugation at 1000 g from a whole blood sample. The enriched cells were then diluted with distilled water containing a final concentration of 0.1% Triton-X100 (Sigma-Aldrich Corporation, St. Louis, America). The solution was subsequently blended using an oscillating blender to ensure thorough rupture of erythrocytes, followed by centrifugation (12000 g, 10 min) for the removal of cellular debris. The supernatant was collected as a stock solution of hemoglobin, and its concentration was determined through five repeated assays using the Sysmex XN-1000 analyzer (Sysmex America, IL, USA).
Due to the lack of reference material, the hemoglobin standard solution, calibrator, and QC samples were diluted from the stock solution with artificial plasma. The hemolysis plasma samples were stored at −20℃ until analysis and underwent a single thawing process.[9]
Upper limit of detection (ULoD)
The clinical chemistry system has a detection capability up to an optical density (OD) value of 2.5. The ULoD capability was assessed using a standard solution containing approximately 200 g/L of hemoglobin. This standard solution underwent a double ratio dilution method employing saline. Subsequently, the diluted solutions were evaluated using the HI assay, and the corresponding OD values were observed.
Calibration
To establish the standard curve for the relationship between hemoglobin concentration and quantitative HI results, a hemoglobin calibrator was prepared with a concentration set close to half of the ULoD. The ADVIA 2400 system was used to measure the HI of both the calibrator and saline (considered as 0 g/L hemoglobin) 3 times. The average of HI results was plotted on the X-axis against their corresponding hemoglobin concentrations on the Y-axis to construct the standard curve.
Linearity evaluation
To evaluate linearity in accordance with the Clinical and Laboratory Standards Institute (CLSI) protocol EP06,[10] a standard hemoglobin solution near its upper detection limit was progressively diluted with saline to generate samples containing 0%, 10%, 20%, 30%, 40%, 50%, 60%, 70%, 80%, 90%, and full concentration of the standard hemoglobin solution. The regression equation for hemoglobin concentration in relation to the HI value was derived through correlation analysis. The threshold for the coefficient of determination (R2) was set at a minimum value of >0.995.
Limit of blank (LoB) and lower limit of detection (LLoD)
The LoB and the LLoD were evaluated following the CLSI protocol EP17-A2.[11] The LoB and LLoD were determined by analyzing five blank samples (saline solution) and five low-level samples (equivalent to 10 times the estimated LoB), which were run on 7 different days, with each sample replicated twice.
Lower limit of quantification (LLoQ)
The LLoQ was determined by conducting repeat analyses on five hemoglobin samples with a low concentration of 0.085 g/L over the course of 3 separate days. Each sample was tested 4 times per day. To ensure accuracy, a coefficient of variation (CV%) below 10% was employed, aligning with both our expectations and experiences shared by peers.[7]
Precision evaluation
The precision (CV%) was evaluated following the 20 × 2 × 2 experimental designs in accordance with the CLSI-EP05-A3 guideline.[12] Therefore, four levels of QCs were measured over a span of 20 testing days, with two runs conducted per day and two replicates performed per run. The measurement repeatability and within-laboratory precision were calculated.
Trueness evaluation (method comparison)
According to the CLSI protocol EP09C-A3,[13] the trueness performance was evaluated by comparing samples of varying grades of hemolysis (n = 40) with the Sysmex XN-1000 analyzer, which could be traced back to the cyanmethemoglobin method. The results were compared using linear regression analysis based on the nonparametric Passing and Bablok method, and system differences were analyzed according to Bland and Altman. [14,15]
Statistical analysis
Microsoft Excel was used for analyzing variance, while MedCalc (Version 20.216) was employed for conducting least-squares linear regression analysis.
RESULTS
ULoD and calibration curve
The OD value of 2.08 was observed for a hemoglobin concentration of 24.75 g/L, suggesting an approximate upper limit for detectable hemoglobin concentration at around 29 g/L. Consequently, a hemoglobin calibrator was prepared at a level of 13.8 g/L. The calibration curve was determined by employing linear regression analysis, resulting in the derived equation y = 0.009x.
Detection capability and linearity
The non-parametric method was selected to estimate LoB and LLoD because the measured results exhibited an abnormal distribution in terms of variability.[16] The LoB was determined to be 0.005 g/L, while the LLoD was found to be 0.050 g/L. The LLoQ was established at 0.085 g/L. The HI method showed excellent linearity (determination coefficient R2 = 0.9998, P < 0.0001) across the range of 0–25.2 g/L, with a regression equation describing the relationship between the estimated and the measured fHb concentrations as y = 0.9579x + 0.0369. Thus, our self-established method demonstrates an analytical measurement range of 0.085~25.2 g/L for detecting fHb [Figure 1].
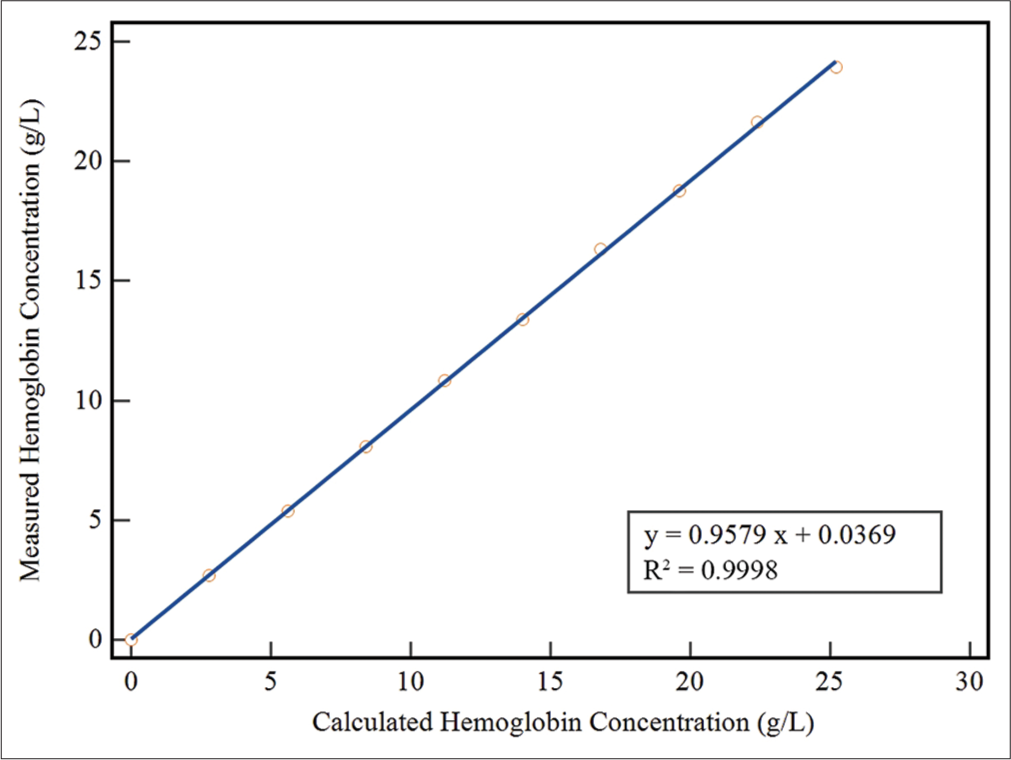
- The linearity of the self-established method was investigated by diluting a standard hemoglobin solution (28 g/L) with saline. The measured concentrations of hemoglobin in the diluted samples were plotted against their expected values. (First order regression analysis, y = 0.9579x + 0.0369, R2 = 0.9998).
Precision and trueness
The self-established method exhibited a total CV of 0.47%, 0.84%, 0.95%, and 0.54% at concentrations of approximately 22 g/L, 11 g/L, 5.5 g/L, and 2.5 g/L of fHb, respectively [Table 1].
| Precision estimates | Level 1 | Level 2 | Level 3 | Level 4 |
|---|---|---|---|---|
| Mean concentration (g/L) | 22.53 | 11.62 | 5.60 | 2.50 |
| Repeatability (CV%) | 0.33 | 0.52 | 0.69 | 0.41 |
| Within-laboratory precision (CV%) | 0.47 | 0.84 | 0.94 | 0.52 |
CV: Coefficient of variation, fHb: Free hemoglobin
The Passing and Bablok regression analysis and Bland-Altman plot are depicted in Figure 2. The regression analysis showed an excellent correlation and satisfactory agreement between the two methods, as indicated by the slope (1.04; 95% confidence interval [CI], 1.03~1.05) and intercept (−0.10; 95% CI, −0.19~−0.03). Spearman’s rank correlation coefficient was found to be r = 1 (P < 0.0001). The bias plot revealed slightly lower values for the HI assay (0.35 g/L).
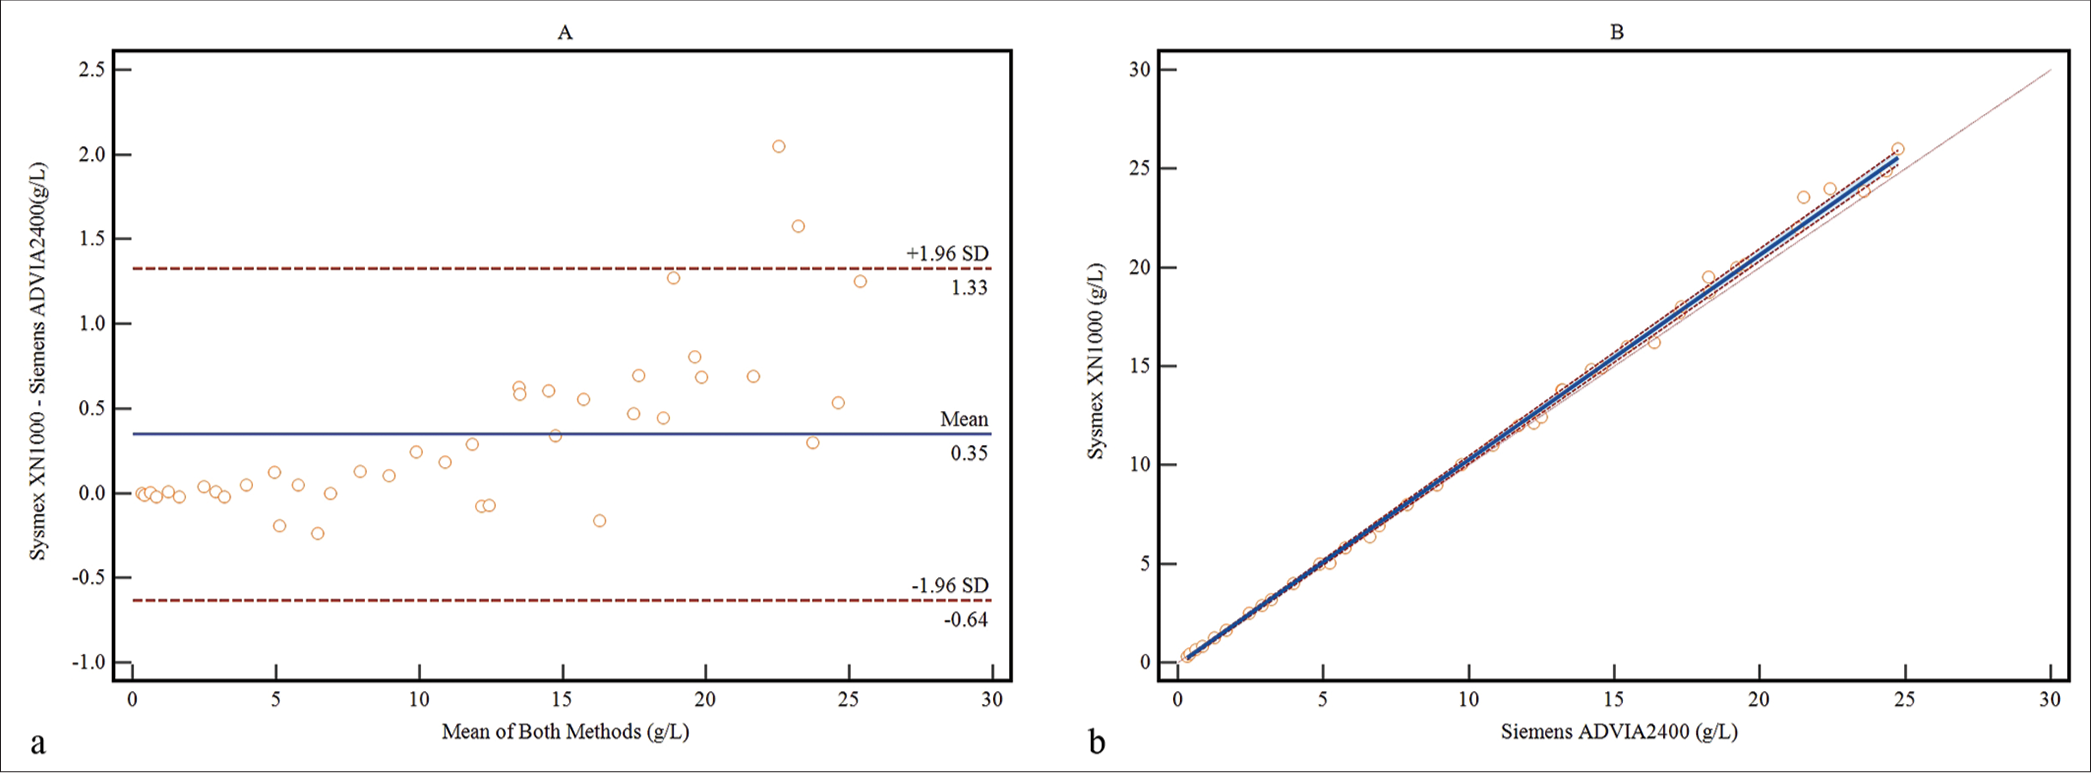
- Method comparison was conducted between the self-established method and Sysmex XN-1000 for determining the concentrations of fHb in 40 samples. (a) the Bland-Altman bias plot, (Blue line: mean bias value; Red lines: 1.96 standard deviation) and (b) regression analysis by the Passing-Bablok method (Solid line: The regression line; Dashed lines: Confidence interval for the regression line; Dotted line: x=y).
DISCUSSION
The Siemens ADVIA 2400 is capable of quantitatively determining plasma HI. However, it should be noted that the manufacturer does not interpret the quantitative results as indicative of fHb concentration. We conducted experiments to correlate the quantitative HI results obtained from ADVIA 2400 and the concentration of fHb, further validating its precision, accuracy, and linearity for assessment.
The assay demonstrated a low CV with a LoB of 0.005 g/L. The LLoQ value was determined to be 0.085 g/L, which closely approximated Abbott’s Alinity c value of 0.080 g/L.[7] The linearity study data exhibited excellent linearity (R2 = 0.9998) across the entire analytical measurement range of 0.085~25.2 g/L, surpassing Burki et al.’s validation in Abbott’s Alinity c, which only covered a range of 0.080~7.2 g/L.[7] In the method comparison study, our findings revealed a slight bias between our self-established method and the hematology analyzer. However, despite 5% (2/40) of the plots falling outside the 95% consistent limit, strong agreement was observed between the two methods. The aforementioned bias may arise from errors introduced during the process of sample dilution.
Various manufacturers may employ different wavelengths and algorithms for detecting HI.[17] Based on the regression equation of the standard curve derived from our experimental data, it is evident that there is a two-order-of-magnitude discrepancy between the quantitative results of HI obtained from Siemens ADVIA 2400 and the actual hemoglobin concentration. This difference could potentially be attributed to variations in units used to express hemoglobin concentration, such as g/L and mg/dL. If this assumption holds true, there exists an approximate 10% discrepancy between the hemoglobin concentration determined by the Sysmex XN-1000 analyzer, which can be traced back to the cyanmethemoglobin method, and the HI assay conducted by Siemens ADVIA 2400. Therefore, it is imperative to calibrate chemistry analyzers capable of providing quantitative HI results before applying them in determining fHb, ensuring consistency with hemacytometer analyzers’ results.
The presence of hemoglobin at a wavelength of 658 nm does not interfere with the detection of lipemia, while icterus does not affect the measurement of hemoglobin at a wavelength of 571 nm.[18] Considering that the absorbance of lipemia is approximately 1.1 times higher at 571 nm compared to 658 nm, the manufacturer has incorporated a correction factor into the testing process to account for this discrepancy.[8] However, it should be noted that this study did not assess interference caused by lipemia and icterus due to the reasons mentioned above. Therefore, further experimental verification is required to determine the anti-interference capability of the HI assay in ADVIA 2400.
CONCLUSIONS
The self-established quantitative HI was evaluated as a reliable assay with robust performance characteristics for quantifying minute quantities of fHb in the ADVIA 2400 chemistry system. It is highly recommended to calibrate the HI in chemistry analyzers to ensure precise and reliable results in detecting fHb.
Acknowledgments
We would like to express our gratitude to Zhi-Ming Li and other engineers from Siemens Healthineers Diagnostics (Shanghai) Co., Ltd. for their invaluable support and assistance throughout this study.
Ethical approval
The research/study approved by the Institutional Review Board at Institutional Ethics Committee of Hangzhou TCM Hospital Affiliated to Zhejiang Chinese Medical University, number No. 202210241109000379768, dated 24th October 2022.
Declaration of patient consent
Patient’s consent was not required as there are no patients in this study.
Conflicts of interest
There are no conflicts of interest.
Use of artificial intelligence (AI)-assisted technology for manuscript preparation
The authors confirm that there was no use of artificial intelligence (AI)-assisted technology for assisting in the writing or editing of the manuscript and no images were manipulated using AI.
Financial support and sponsorship
Nil.
References
- Free hemoglobin concentration in severe sepsis: Methods of measurement and prediction of outcome. Crit Care. 2012;16:R125.
- [CrossRef] [Google Scholar]
- Serum free hemoglobin as a novel potential biomarker for acute ischemic stroke. J Neurol. 2009;256:625-31.
- [CrossRef] [Google Scholar]
- Hemolysis and plasma free hemoglobin during extracorporeal membrane oxygenation support: From clinical implications to laboratory details. ASAIO J. 2020;66:239-46.
- [CrossRef] [Google Scholar]
- Direct spectrophotometry of serum hemoglobin: An Allen correction compared with a three-wavelength polychromatic analysis. Clin Chem. 1984;30:627-30.
- [CrossRef] [Google Scholar]
- Serum indices: Managing assay interference. Ann Clin Biochem. 2016;53(Pt 5):527-38.
- [CrossRef] [Google Scholar]
- Automated measurement of plasma cell-free hemoglobin using the hemolysis index check function. J Appl Lab Med. 2020;5:281-9.
- [CrossRef] [Google Scholar]
- Using the hemolysis index of Abbott's Alinity c for the measurement of plasma free hemoglobin in ECMO patients. Clin Biochem. 2022;100:67-70.
- [CrossRef] [Google Scholar]
- New serum indices normalized for ADVIA® chemistry systems USA: Siemens Healthcare Diagnostics Inc.; 2008.
- [Google Scholar]
- Local quality assurance of serum or plasma (HIL) indices. Clin Biochem. 2018;54:112-8.
- [CrossRef] [Google Scholar]
- Evaluation of linearity of quantitative measurement procedures In: CLSI guideline EP - 06 (2nd ed). United States: Clinical and Laboratory Standards Institute; 2020.
- [Google Scholar]
- Evaluation of detection capability for clinical laboratory measurement procedures (2nd ed). CLSI guideline EP17. United States: Clinical and Laboratory Standards Institute; 2012.
- [Google Scholar]
- Evaluation of precision of quantitative measurement procedures (3rd ed). CLSI guideline EP05. United States: Clinical and Laboratory Standards Institute; 2014.
- [Google Scholar]
- Measurement procedure comparison and bias estimation using patient samples (3rd ed). CLSI guideline EP09C. United States: Clinical and Laboratory Standards Institute; 2018.
- [Google Scholar]
- A new biometrical procedure for testing the equality of measurements from two different analytical methods. Application of linear regression procedures for method comparison studies in clinical chemistry, Part I. J Clin Chem Clin Biochem. 1983;21:709-20.
- [CrossRef] [Google Scholar]
- Agreed statistics: Measurement method comparison. Anesthesiology. 2012;116:182-5.
- [CrossRef] [Google Scholar]
- Partly nonparametric approach for determining the limit of detection. Clin Chem. 2004;50:732-40.
- [CrossRef] [Google Scholar]
- Plasma hemoglobin: A method comparison of six assays for hemoglobin and hemolysis index measurement. Int J Lab Hematol. 2021;43:1145-53.
- [CrossRef] [Google Scholar]
- Managing hemolyzed samples in clinical laboratories. Crit Rev Clin Lab Sci. 2020;57:1-21.
- [CrossRef] [Google Scholar]


