
Translate this page into:
Agreement of Measurement between Arterial and Venous Electrolyte Levels in Neonates in a Tertiary Care Hospital
Address for correspondence Kusuma Kasapura Shivashankar, Department of Biochemistry, JSS Medical College and JSS Hospital, MG Road, Mysuru 570004, Karnataka, India (e-mail: kusumaks@jssuni.edu.in).
This article was originally published by Wolters Kluwer - Medknow and was migrated to Scientific Scholar after the change of Publisher.
Abstract
Context
Venous or arterial blood is used for the estimation of electrolytes in neonates in neonatal intensive care unit (NICU). In addition to the measurement of blood gases and bicarbonate in the arterial blood, arterial blood gas analysis also estimates electrolytes thus circumventing the need to collect a venous sample for electrolytes. The literature survey revealed studies comparing the electrolyte levels in arterial and venous blood in adults and older children, but to our knowledge none were found in neonates, hence the study.
Aims
The aim of the study is to compare the electrolytes in arterial and venous samples in neonates in a critical care set up and derive in-house prediction equation to correlate the arterial and venous electrolytes.
Settings and Design
Hospital-based, retrospective cross-sectional study done in critically ill neonates.
Materials and Methods
All the newborns (age ≤28 days) admitted in NICU from July 2016 to June 2018 were selected for the study and data collected with the help of Hospital Information System.
Statistical Analysis
MedCalc and NCSS 12 (trial version) software was used. Deming Regression and Bland Altman analysis were performed.
Results
A strong positive correlation between the arterial and venous blood electrolytes observed. An in-house prediction equation was derived for the venous electrolytes. Deming regression analysis showed that only potassium levels are statistically equivalent between the instruments and the sample type. Bland Altman Analysis between the arterial and venous electrolytes showed a mean difference which was well within the accepted Clinical Laboratory Improvement Amendment guidelines.
Conclusion
The electrolyte levels estimated by arterial blood in neonates can be used in an interchangeable manner only for potassium levels, whereas sodium and chloride estimation necessitates one to be cautious.
Keywords
electrolytes
sodium
potassium
chloride
neonates

Introduction
Electrolyte abnormalities are most commonly encountered in critically ill patients, hence rapid and accurate evaluation is essential for focused therapies. Common causes of electrolyte disturbances in neonates are severe respiratory or metabolic disorders, hypoxia or asphyxia, shock, sepsis, and inborn errors of metabolism.1,2 Hence the aim of our study was to look for an agreement of measurement between arterial and venous electrolyte levels in neonates in a tertiary care hospital. The primary objective of our study was to compare and correlate the electrolyte (sodium, potassium, and chloride) levels in arterial blood (whole blood) and venous blood (serum) in newborns admitted in NICU. The secondary objective was to derive a prediction equation for the venous sodium and potassium levels by using arterial sodium and potassium levels.
Arterial blood gas (ABG) analysis is frequently requested investigation in any intensive care unit to identify the metabolic, respiratory, and electrolyte imbalances but conventionally serum electrolytes are more relied upon for the detection of electrolyte abnormalities.2 ABG analysis is often associated with the drawbacks such as being an invasive and painful procedure, with an increased risk of vascular injury and higher incidence of infections. Due to these factors, less invasive procedure like venous blood sampling is often preferred.3 However, the arterial blood allows blood gas analysis in addition to the measurement of electrolytes and hence circumvents the need to collect a repeat venous sample for electrolytes.
Heparin is used as a preferred anticoagulant in the estimation of ABG analysis. It has an inherent ability to interfere with electrolyte estimation due to its innate chemical properties and possible human error in dilution of the arterial sample.1 But with the advent of dry balanced/lyophilized preheparinized syringes, these factors are bypassed to a certain extent.2 Studies have shown that there is a positive correlation between arterial and venous (serum) blood electrolytes like sodium and potassium in adult age group.4 On the other hand, Gupta et al have cautioned against the use of arterial and venous electrolytes interchangeably.5
The need for our study stems from some earlier research works2-5 which have compared the electrolytes in arterial blood and venous samples in adults in a critical care set up and have recommended the usage of an in-house prediction equation to correlate the arterial and venous electrolytes. However, to our knowledge no studies have been done to compare the arterial and venous electrolyte levels in neonates. Furthermore, it was also intended to derive an in-house prediction equation so as to aid the clinicians to calculate venous electrolytes making use of arterial electrolytes. This would reduce the repeated pricks in neonates for the estimation of venous electrolytes. An ABG analysis for electrolytes also reduce the turnaround time and aids to analyze other relevant parameters such as pH, blood gases, and bicarbonate along with electrolytes.
Subjects and Methods
Study Type and Participants
The present study was a retrospective study which included neonates (aged ≤28 days) admitted in the neonatal intensive care unit (NICU) of a tertiary care hospital. The screening of data was done with the help of Hospital Information System (HIS) and data were collected from July 2016 to June 2018.
Inclusion and Exclusion Criteria
All the neonates admitted in NICU who were subjected to the ABG analysis for the first time along with venous electrolytes estimation, wherein the time difference was less than 20 minutes, were included. The neonates who did not satisfy this timeframe criterion or who had attained death or discharged against medical advice or had incomplete demographic details were excluded from the study. Hemolysis has an impact on the serum electrolyte levels. The technicians in our hospital laboratory have been trained to identify hemolyzed serum samples and the same are rejected in our laboratory when the tests requested are for electrolytes and the same are documented in a sample rejection register and a repeat sample is obtained for the estimation of electrolytes. This is one of the quality indicator captured in our laboratory. However, as it is a retrospective study, a comment on the specimens which were hemolyzed cannot be made with confidence probably due to any of these samples being missed for hemolysis by the technician or when the NICU staff (doctors/nurse) refuse to send another sample as the neonate has already had several pricks for different investigations or is of very low birthweight/or a history of use of therapeutic intervention like fluids. The data satisfying the above criteria were then further used to collect the information regarding age, sex, mode of delivery, gestational age, weight, breastfeeding, and clinical diagnosis. Institutional Ethical clearance was obtained for the study and informed consent was not obtained as this was a retrospective data collection.
A total of 960 neonates admitted in the NICU were subjected to ABG analysis at the time of admission. Among them 100 neonates fulfilled the above mentioned inclusion criteria (venous electrolytes done within 20 minutes of ABG analysis). Out of the 860 neonates, 120 had attained death, 74 were discharged against medical advice, and 116 had incomplete demographic details. Furthermore, ABG alone was estimated in 347 neonates, whereas in 203 neonates ABG and venous electrolytes estimated were more than 20 minutes apart.
Rationale for Sample Size
Based on the previous study by Nanda et al,2 the mean ± SD (standard deviation) for Na+ and K+ in arterial blood are 134 ± 12.25 and 3.6 ± 0.9 mmol/L, respectively. The mean ± SD for Na+ and K+ in venous blood are 137 ± 13.75 and 4.1 ± 0.9 mmol/L, respectively. Based on the above findings and considering an α-error of 5%, a sample size of 100 was found to be sufficient to attain a power of 70%.
Methods
Arterial blood was collected by NICU staff nurse (on instruction from pediatrician who is NICU-In charge) from radial artery (right or left side) apart from the side where intravenous (IV) cannula was placed, using commercially available 1-mL plastic syringes coated with Ca2+-LH (BD A-line Becton Dickinson Diagnostics), which recommends 0.6 mL of blood draw. The arterial blood was transported from the NICU to the clinical biochemistry section through porter on ice pack within 5 minutes of collection. Arterial blood (whole blood) electrolytes were then estimated immediately (within 5–10 minutes) using Radiometer Basic 800 series ABG analyzer (Radiometer Medical APS). Serum/plasma/whole blood estimation of electrolytes is possible on Radiometer Basic 800 series ABG analyzer.
Venous blood was collected from the cubital veins (right or left side) by the NICU staff nurse, preferably on that side where IV cannula was not placed, using red-capped BD Vacutainer Plus Plastic serum tubes which have spray-coated silica (Becton Dickinson Diagnostics) and then the vacutainers were transported to the clinical biochemistry section through the pneumatic chute system. After the receipt of the sample, it was centrifuged at 3,000 rpm for 10 minutes to separate the serum that was used to estimate the electrolytes using Diestro 103+ (Buenos Aires, Argentina) from JK Biomed Diagnostics, Bangalore. Only serum/plasma is the preferred sample type for estimation of electrolytes by Diestro 103+.
The method of estimation in both the equipments was by direct ion selective electrode (ISE). Radiometer Basic 800 ABG analyzer would be autocalibrated once in 6 hours and Diestro 103+ would be autocalibrated once in 4 hours. The Bio-Rad control and Blood Gas plus E were run every day on both the instruments and were well within normal quality control limits.
Statistical Analysis
The data collected from the HIS were entered on to a Microsoft Excel data sheet. The statistical analysis was done using Microsoft Excel Data Analysis Pack Tool, NCSS 12 (trial version) and MedCalc (trial version) software. p-Value of < 0.05 was considered statistically significant.
The electrolyte values were presented using the descriptive statistics like mean and standard deviation. Arterial and venous blood electrolyte levels were correlated using Pearson’s correlation and a simple linear regression was done to derive the prediction equation. This equation was derived making use of arterial blood electrolyte levels to predict the values of venous blood electrolytes and to see whether they form a model of good fit. Furthermore, Deming regression analysis was performed to evaluate systematic differences between arterial and venous electrolyte levels obtained amid two instruments. The Bland Altman analysis was used for analyzing the agreement between the arterial and venous blood.
Results
A total of 100 neonates aged ≤28 days were selected which fulfilled the inclusion criteria. The demographic data have been depicted in ►Table 1. Descriptive statistics such as Mean and SD for the electrolytes was represented in the ►Table 2. Pearson’s correlation between the arterial and venous blood electrolytes has been represented in ►Table 3. A simple linear regression was performed for the electrolyte levels to derive the prediction equation as depicted in the ►Table 4.
| Parameters | Demographic details | Number |
|---|---|---|
| Sex | Male: female | 55:45 |
| Type of delivery | LSCS: normal vaginal delivery | 58:42 |
| Gestational age | Term: preterm | 69:31 |
| Nutrition | Trophic feeds: breast feed | 93:07 |
| Weight | < 2.5 kg: > 2.5 kg | 50:50 |
Abbreviation: LSCS, lower segment caesarean section.
| Analyte (mmol/L) | Arterial blood | Venous blood |
|---|---|---|
| (Mean ± SD) | (Mean ± SD) | |
| Sodium | 132.31 ± 11.31 | 135.94 ± 7.12 |
| Potassium | 4.59 ± 1.01 | 4.68 ± 0.91 |
| Chloride | 107.6 ± 10.91 | 103.44 ± 7.31 |
Abbreviation: SD, standard deviation.
| N | Na+/K+/Cl– Venous | p-Value | |
|---|---|---|---|
| Na+ arterial | 100 | 0.791 | < 0.001 |
| K+ arterial | 100 | 0.651 | < 0.001 |
| Cl– arterial | 100 | 0.617 | < 0.001 |
| R | R2 | Prediction equation | ANOVA for unstandardized predicted values | |
|---|---|---|---|---|
| Na+ arterial vs. venous | 0.79 p < 0.001 | 0.63 p < 0.001 | Na+ Venous = 69.56 + 0.502*Na+Arterial | F = 163.68, p < 0.001 |
| K+ arterial vs. venous | 0.64 p < 0.001 | 0.41 p < 0.001 | K+ Venous = 1.99 + 0.59*K+Arterial | F = 72.16, p < 0.001 |
| Cl–arterial vs. venous | 0.61 p < 0.001 | 0.38 p < 0.001 | Cl– Venous = 58.90 + 0.41*Cl– Arterial | F = 60.48, p < 0.001 |
Abbreviation: ANOVA, analysis of variance.
Deming regression analysis was performed to assess systematic differences between the arterial and venous electrolyte levels which were estimated in two different instruments as represented in the ►Table 5 and ►Figs. 1A, 2A, and 3A
| Parameter | Co-eff | Std. error | 95% CI | Regression equation | |
|---|---|---|---|---|---|
| Na+ | Intercept | 52.0 | 8.11 | 35.89–68.11 | Venous Na+ = 0.63*Arterial Na+ + 52.0 |
| Slope | 0.63 | 0.06 | 0.51–0.75 | ||
| K+ | Intercept | 0.54 | 0.55 | –0.56–1.64 | Venous K+ = 0.90*Arterial K+ + 0.54 |
| Slope | 0.90 | 0.12 | 0.64–1.15 | ||
| Cl– | Intercept | 31.33 | 12.01 | 7.49–55.18 | Venous Cl– = 0.67*Arterial Cl– + 31.33 |
| Slope | 0.67 | 0.11 | 0.44–0.89 |
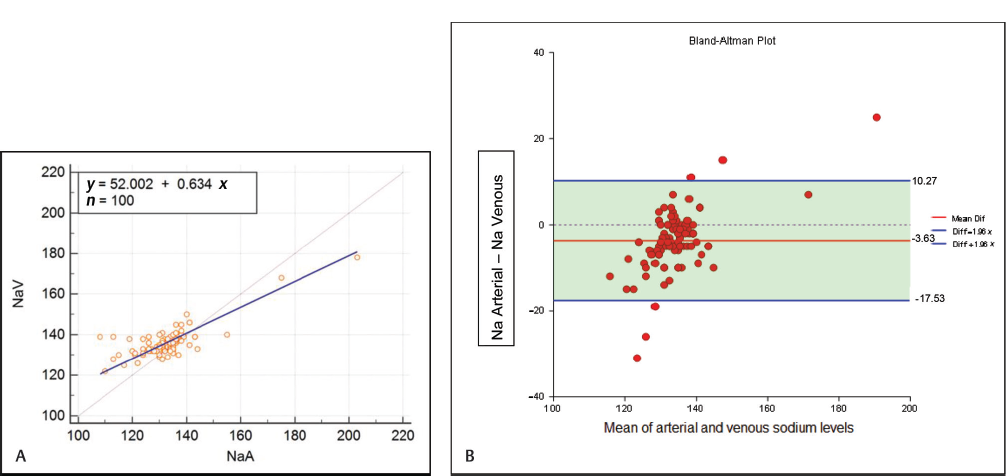
- (A) Deming regression plot between arterial and venous Na+. (B) Bland Altman analysis plot of Sodium in arterial and venous blood.
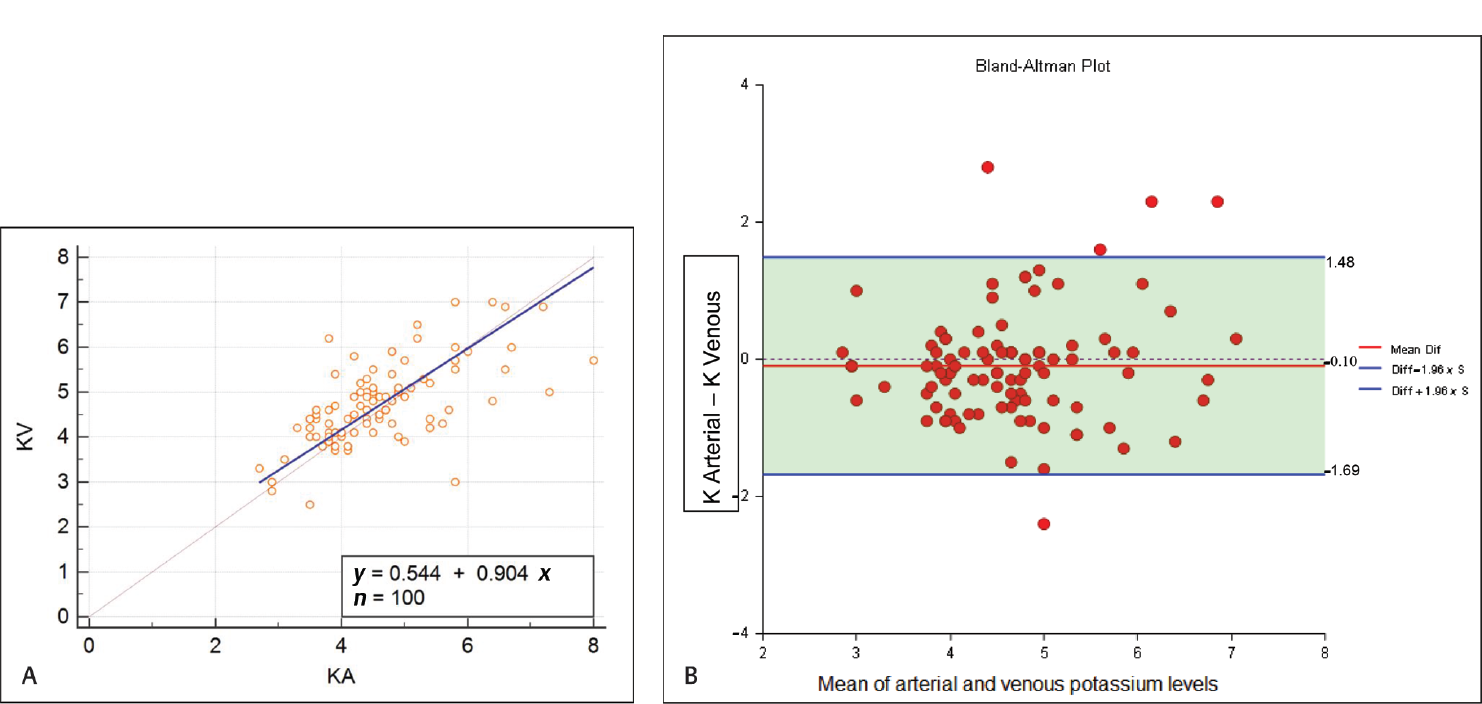
- (A) Deming regression plot between arterial and venous K+. (B) Bland Altman analysis plot of potassium in arterial and venous blood.

- (A) Deming regression plot between arterial and venous Cl– (B) Bland Altman analysis plot of chloride in arterial and venous blood.
Bland Altman Analysis was done to analyze the agreement of levels of electrolytes between the arterial and venous blood as shown in ►Table 6 and difference plot was drawn as shown in ►Figs. 1B, 2B, and 3B, respectively.
| Limits of agreement (95% CI) (in mmol/L) | Mean difference (in mmol/L) | Number of samples surpassed the limits of CLIA | |
|---|---|---|---|
| Na+ arterial vs. venous | –17.53 to 10.27 | –3.63 | 48 |
| K+ arterial vs. venous | –1.69 to 1.48 | –0.102 | 42 |
| Cl–arterial vs. venous | –12.70 to 21.02 | 4.16 | 56 |
Abbreviation: CLIA, Clinical Laboratory Improvement Amendment.
Discussion
Correction of electrolyte imbalance is never overemphasized, as managing this abnormality reverses the possible morbidity and mortality in newborns. The ABG analysis is easy and the most rapid investigation which provides distinct results in detecting any changes in the respiratory and metabolic parameters.2 Venous blood sampling is preferred for electrolyte estimation over ABG analysis as the latter is associated with a few drawbacks like pain, vascular injury, and infection. But on the other hand, ABG analysis has distinct advantages like quicker turnaround time, measurement of other critical parameters like pH, PCO2, PO2, and HCO3–, requires less volume of sample, and can be performed at the bedside (point of care test) when compared with estimation of electrolytes in venous blood at the biochemistry laboratory.
►Table 1 represents the demographic characteristics of the neonates included in the study. Approximately, 70% of the neonates were born at term but 93% of them were on trophic feeds as almost every neonate admitted in the NICU was critically ill and could not be breastfed. ►Table 2 shows the mean and SD of the arterial and venous blood electrolytes. The mean levels of sodium and potassium for the arterial blood were observed to be slightly lower when compared with the venous blood. Our findings are in coherence with similar studies which were done in adults and pediatric critically ill patients, respectively.1,59
There was a strong positive correlation observed between arterial and venous blood electrolytes as shown in ►Table 3. Hence a simple linear regression was performed as depicted in ►Table 4 to derive prediction equation to calculate the venous electrolyte levels using the arterial electrolyte values. Furthermore, it is pertinent to note that this equation needs to be standardized in house depending on the type of equipment, provided the methodology is same (Direct ISE in our set up).10,11
The R 2 value obtained while performing the simple linear regression for sodium, potassium, and chloride levels were 63, 41, and 38%, respectively (►Table 4). This lower R 2 observed was probably due to the following reasons: (1) ISE-based instruments from different manufacturers possess different electrodes, make use of different calibrators in the instruments which are known to yield Na+ and K+ values that differ by 2 to 5%; (2) hemolysis has a significant effect because of the concentration gradient present between the blood corpuscles and plasma which results in low sodium and high potassium values.4,5,12
The other specific factors which may have resulted in the low R2 in arterial blood is the occurrence of highest bias for sodium due to usage of BD dry balanced heparin syringe in addition to the effect of binding of the cations like sodium and potassium to heparin13,14 and in venous blood release of potassium ions from platelets during the separation of serum, especially if the centrifugation was done prior to clotting of blood and possible hemolysis due to transport of venous blood in pneumatic chute system.4,5,13-15
A wide difference noticed in the chloride levels and a decreased R2 of 38% between the arterial and venous blood chloride is on the account of degradation in sensitivity and specificity of the chloride ion exchange membrane due to repeated usage of heparinized samples in ABG analysis which interferes with chloride measurement and the presence of other lipophilic anions like salicylates, thiocyanates, bromides, and iodides in the blood which compete with chloride to bind to the chloride ISE.16
Deming regression analysis was performed to evaluate systematic differences between arterial and venous electrolyte levels obtained amid two instruments as depicted in ►Table 5. As shown in ►Table 5, arterial/venous potassium comparison, the CI (confidence interval) for intercept value includes 0 and CI for slope coefficient includes 1, which means that potassium results between the instruments are interchangeable. Whereas, for arterial/venous sodium and chloride comparison, the CI for intercept value does not include 0 and CI for slope coefficient does not include 1, which means that sodium estimation between the instruments is not equivalent. Deming regression analysis further confirmed the results of simple linear regression, wherein only potassium level between the two instruments was equivalent, whereas sodium and chloride levels did not match between the instruments and the probable reasons for the difference in arterial and venous sodium and chloride levels would be same as explained above.4,5,13,-16
Bland Altman analysis showed mean differences of –3.63, –0.12, and 4.16 mmol/L for Na+, K+, and Cl–, respectively, which were observed to be within Clinical Laboratory Improvement Amendment (CLIA) guidelines. The CLIA guidelines state that Na+ should be within ± 4 mmol/L, K+ should be within ± 0.5 mmol/L, and Cl should be within ± 5% (11). However, the 95% limits of agreement for sodium, potassium, and chloride were wide (►Table 6) indicating that there is a large gap in the individual values (►Figs. 1-3) between the arterial and venous blood. The number of individual samples which surpassed the CLIA limits for Na+, K+, and Cl were 48, 42, and 56, respectively. This is in agreement with the previous studies.4,11
Limitations of the Study
Our study has not explored the concordance of arterial and venous blood electrolytes across the entire range of sodium, potassium, and chloride levels (hypo, normal, and hyper electrolyte levels).
Though there are trained NICU nurses for the collection of arterial and venous sample, the possibility of preanalytical errors cannot be eliminated completely.
A comparison of the arterial and venous electrolytes between the instruments was only done and no correlation with the clinical condition of the baby (except for death of the baby) was made.
Conclusion
The preheparinized arterial (whole blood) potassium levels can be used in an inter-exchangeable manner with serum potassium whereas one needs to be cautious with regards to sodium and chloride levels or make use of the prediction equation. The estimation of electrolytes only in the arterial blood is advantageous in improving the turnaround time, resulting in an early intervention and also avoids repeated pricks for the same test (serum electrolyte) in a neonate.
Presentation at a Meeting
Presented at AMBKCCON-5th State Level Conference of Association of Medical Biochemists Karnataka Chapter; September 19, 2018; Mangalore, Karnataka, India
Acknowledgments
We acknowledge Dr. Prajwala HV, MBBS, MD (Pediatrics), Department of Pediatrics & Neonatology, JSS Hospital, JSSAHER, Mysuru for her review. We also wish to thank our students Ms. Sharanya and Ms. Rashmi from JSS Medical College, Mysuru and Mr. Mohammed Ayan, Dubai American Academy, for helping us in data collection during this project.
Conflict of Interest
None.
Source(s) of Support
Nil.
Reference
- To heparinize or not to heparinize: effect on arterial blood gas measurements. Indian J Crit Care Med. 2014;18(01):1-2.
- [CrossRef] [PubMed] [Google Scholar]
- Agreement of arterial sodium and arterial potassium levels with venous sodium and venous potassium in patients admitted to intensive care unit. J Clin Diagn Res. 2015;9(02):BC28-BC30.
- [CrossRef] [PubMed] [Google Scholar]
- Correlation between the measurements of serum and arterial blood gas (ABG) electrolytes in patients admitted to the intensive care unit at King Abdul-Aziz Medical City, Riyadh, Saudi Arabia. Am J Clin Med Res. 2015;3:55-59.
- [Google Scholar]
- Are sodium and potassium results on arterial blood gas analyzer equivalent to those on electrolyte analyzer? Indian J Crit Care Med. 2016;20(04):233-237.
- [CrossRef] [PubMed] [Google Scholar]
- Use of liquid heparin for blood gas sampling in pediatric intensive care unit: a comparative study of effects of varying volumes of heparin on blood gas parameters. Indian J Crit Care Med. 2013;17(06):350-354.
- [CrossRef] [PubMed] [Google Scholar]
- The effects of hypotension on differences between the results of simultaneous venous and arterial blood gas analysis. J Res Med Sci. 2011;16(02):188-194.
- [Google Scholar]
- Can peripheral venous blood gases replace arterial blood gases in emergency department patients? CJEM. 2002;4(01):7-15.
- [CrossRef] [PubMed] [Google Scholar]
- Plasma and serum electrolytes levels correlation in the pediatric ICU. Tanafoss. 2010;9(04):34-38.
- [Google Scholar]
- Analysis of bias in measurements of potassium, sodium and hemoglobin by an emergency department-based blood gas analyzer relative to hospital laboratory autoanalyzer results. PLoS One. 2015;10(04) e0122383
- [CrossRef] [PubMed] [Google Scholar]
- Levels of calcium, sodium, and potassium in plasma as influenced by anticoagulants. J Vet Anim Sci (Lahore). 2013;44:72-75.
- [Google Scholar]
- Electrolytes assessed by point-of-care testing—are the values comparable with results obtained from the central laboratory? Indian J Crit Care Med. 2011;15(01):24-29.
- [CrossRef] [PubMed] [Google Scholar]
- Standards and Certifications: Laboratory Requirements (42CFR493). Regulations Part 493—Laboratory Requirements. Subpart I—Proficiency Testing Programs by Specialty and Subspecialty, Section 493.931—Routine Chemistry. 2004
- [Google Scholar]
- Ion selective electrodes (ISEs) and interferences—a review. Clin Chim Acta. 2010;411(5-6):309-317.
- [CrossRef] [PubMed] [Google Scholar]
- Electrolyte-balanced heparin in blood gas syringes can introduce a significant bias in the measurement of positively charged electrolytes. Clin Chem Lab Med. 2011;49(02):249-252.
- [CrossRef] [PubMed] [Google Scholar]
- Use of a blood gas analyzer and a laboratory autoanalyzer in routine practice to measure electrolytes in intensive care unit patients. BMC Anesthesiol. 2012;12:17.
- [CrossRef] [PubMed] [Google Scholar]
- Application No. PCT/DK2004/000496, IPA No. WO 2005/005975, chloride selective electrode membrane. Available at: https://patents.google.com/patent/WO2005005975A1. Accessed January 1, 2019
- [Google Scholar]


