
Translate this page into:
Correlation between Estimated Average Glucose Levels Calculated from HbA1c Values and Random Blood Glucose Levels in a Cohort of Subjects

Address for correspondence: Pinky Garg, MD, Department of Biochemistry, North DMC Medical College and Hindu Rao Hospital, Delhi, 110007, India (e-mail: dr.pinky18@gmail.com).
This article was originally published by Thieme Medical and Scientific Publishers Pvt. Ltd. and was migrated to Scientific Scholar after the change of Publisher.
Abstract
Objective
Hemoglobin A1c (HbA1c) level remains the gold standard test for the assessment of glycemic control, and it reflects the mean glucose values in the previous 3-month period. HbA1c is expressed as a percentage, whereas the monitoring and treatment of diabetes are based on blood glucose levels expressed as mg/dL. It is appropriate to make it easy for the patient to understand both random blood sugar (RBS) and estimated average glucose (eAG) expressed with the same units. This will enhance the usefulness of eAG. This article determines the statistical correlation between eAG derived from HBA1C with RBS values both in diabetic and prediabetic subjects.
Methods
The RBS and HbA1c levels of 178 males and 283 females (12–90 years) were obtained and the eAG levels were calculated using Nathan's regression equation. The samples were divided into four groups based on HbA1c levels—group 1: HbA1c greater than 9%, group 2: HbA1c 6.5 to 9%, group 3: HbA1c 5.7 to 6.4%; and group 4: HbA1c less than 5.7%.
Results
There was a statistically significant positive correlation between RBS and eAG values for the study group 1 and 2. Also, the median values of RBS and eAG showed a significant difference (p < 0.001).
Conclusion
As the association between the RBS and eAG levels is strong in a fairly and poorly controlled diabetic population, reporting the eAG level together with the HbA1c level at no additional cost may assist in effective blood glucose control in clinical care. However, eAG and RBS values cannot be used interchangeably.
Keywords
HbA1c
glycated hemoglobin
eAG
estimated average blood glucose

Introduction
The prevalence of diabetes mellitus (DM) in India has risen from 7.1% in 2009 to 8.9% in 2019. Currently, 25.2 million adults are estimated to have impaired glucose tolerance, which is estimated to increase to 35.7 million in the year 2045. India ranks second after China in the global diabetes epidemic with 77 million people with diabetes.[1] In Delhi, capital of India, 25.2% of the population was estimated to have diabetes.[2] Among the various biochemical markers associated with DM diagnosis and management, glycated hemoglobin A1c (HbA1c) is of utmost importance owing to its utility as a reliable marker to assess timely control over the preceding 2 to 3 months.[3] It is recommended that diabetic patients have their HbA1c levels checked at least two times per year because quantitative and direct relationships have been identified between HbA1c concentration and the risk of diabetic microvascular complications.[4] Therefore, clinicians use HbA1c test results to guide treatment decisions, and the test has become the cornerstone for assessing diabetes care.[5] The conventional approach for the expression of HbA1c values is percent (%) of total hemoglobin, which is not easily comprehensible for a DM patient with nonmedical background.[6]
In 2008, Nathan et al conducted the International HbA1c-Derived Average Glucose (ADAG) trial, which established a linear dependence between HbA1c and averaged plasma glucose levels, and a simple mathematical equation for the calculation of estimated average glucose (eAG) level using the HbA1c level was introduced.[7] The relationship between HbA1C and eAG is described by the equation 28.7 × A1C – 46.7 = eAG. This equation has been extensively evaluated since then, and citing eAG values with HbA1c laboratory reports has become a common practice. Still most clinical laboratories have not yet started reporting eAG values and a widespread understanding of its utility in the medical fraternity is missing.
Objectives
To determine the statistical correlation between HBA1C with random blood sugar (RBS) values both in diabetic and prediabetic subjects.
To determine the statistical correlation between eAG derived from HbA1C using the Nathan's regression equation with RBS both in diabetic and prediabetic subjects.
To analyze the significance of eAG as opposed to HbA1C as a marker of long-term glycemic control in DM.
Materials and Methods
Study Design
This hospital-based retrospective analytical cohort study was conducted at the Clinical Laboratory, Department of Biochemistry, Hindu Rao Hospital (900-bedded tertiary care hospital), New Delhi, India after approval from the institutional ethical review committee (IEC/NDMC/2022/131).
Sample Selection and Sample Size
The study group was selected from patient reporting to the laboratory for HbA1c estimation. The simple random sampling technique was used to obtain laboratory records of both sexes in the age range of 12 to 90 years presenting as outpatients. Pregnant females and patients diagnosed with renal disorder were excluded from the study. For an estimated prevalence of 25.2% of diabetes in Delhi population[2] and with 5% absolute precision, 95% confidence interval, and 10% confounding variable, we needed a sample size of 320.
Data Collection
The random blood glucose and HbA1c levels of 461 patient samples (178 male and 283 female) were included in the study. Blood samples were taken on the same day for the determination of both RBS and HbA1c. The eAG levels (mg/dL) were calculated using the following formula: 28.7 × HbA1c – 46.7. The samples were divided into four groups on the basis of HbA1c levels as group 1: HbA1c greater than 9% (poorly controlled diabetic), group 2: HbA1c 6.5 to 9% (fairly controlled diabetic), group 3: HbA1c 5.7 to 6.4% (prediabetic), and group 4: HbA1c less than 5.7% (nondiabetic).[8]
Glucose levels were determined using the glucose oxidase method in Transasia Erba analyzer with commercially available Agappe kits. HbA1c levels were determined using high-performance liquid chromatographic method on Biorad D10 analyzer with Biorad kits.
Statistical Analysis
Presentation of categorical variables was done in the form of number and percentage (%). Quantitative data were presented as the means ± standard deviation (SD) and as median with 25th and 75th percentiles (interquartile range). Data normality was checked by using the Kolmogorov–Smirnov test. The cases in which the data was not normally distributed, we used nonparametric tests. The following statistical tests were applied for the results:
The association of the variables which were quantitative and not normally distributed in nature was analyzed using Mann–Whitney U test (for two groups) and Kruskal–Wallis test (for more than two groups). Wilcoxon signed ranks test was used for comparison of RBS (mg/dL) and eAG (mg/dL).
Spearman's rank correlation coefficient was used for correlation of RBS (mg/dL) with HbA1c (%) and RBS (mg/dL) with eAG (mg/dL).
Data entry was done in Microsoft Excel spreadsheet and the final analysis was done with the use of Statistical Package for Social Sciences (SPSS) software (ver 21.0, IBM, Chicago, Illinois, United States). A p-value of less than 0.05 was considered statistically significant.
Results
A total of 461 patients' data (178 males, 283 females) were recorded for the study. Age range was between 12 and 90 years and mean age ± SD was 46.89 ± 13.2 years. The mean ± SD values of HbA1c, eAG, and RBS of the total population were 7.8 ± 2.54%, 177.2 ± 72.89 mg/dL, and 169.53 ± 86.1 mg/dL, respectively (►Table 1, ►Fig. 1A and B). There was a statistically significant difference found in all the dependent variables (HbA1c/RBS/eAG) in two independent groups, that is, males and females (►Table 2). It showed males have significant higher values of HbA1c, RBS, and eAG as compared with females (►Fig. 2). The study sample was divided into four groups on the basis of HbA1c values (group 1 HbA1c > 9%, group 2 HbA1c 6.5–9%, group 3 HbA1c 5.7–6.4%, and group 4 < 5.7%). A nonparametric test applied to the four groups showed a statistically significant difference in their RBS and eAG values (►Table 3, ►Fig. 3). As shown in ►Table 4(Fig. 4A and B) there was a statistically significant positive correlation in both cases: RBS versus HbA1c and RBS versus eAG (r = 0.782, p ≤ 0.0001, R2 = 0.612) for the whole study sample. We also observed similar positive correlation in group 1 sample (r = 0.447, p ≤ 0.0001, R2 = 0.1998) and group 2 sample (r = 0.322, p ≤ 0.0001, R2 = 0.1037). No statistically significant relationship was observed between RBS and eAG in group 3 (r = 0.111, p > 0.05) and group 4 (r = 0.082, p > 0.05).
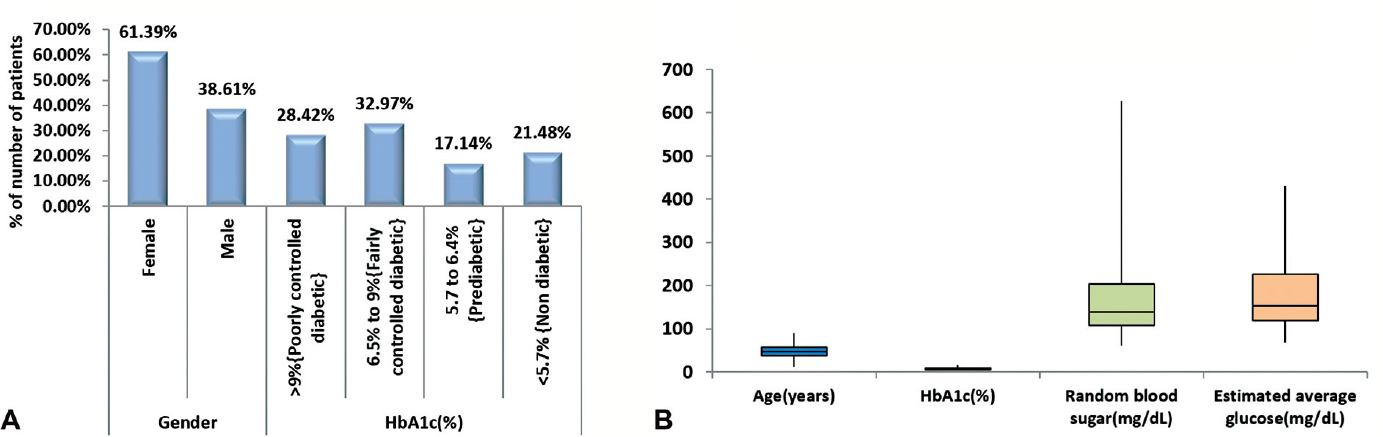
- (A) Distribution of baseline characteristics of study subjects. (B) Descriptive statistics of age (years), hemoglobin A1c (HbA1c) (%), random blood sugar (mg/dL), and estimated average glucose (mg/dL) of study subjects.

- Association of parameters with gender (nonparametric variables).

- Association of parameters with hemoglobin A1c (HbA1c) (%) (nonparametric variables).
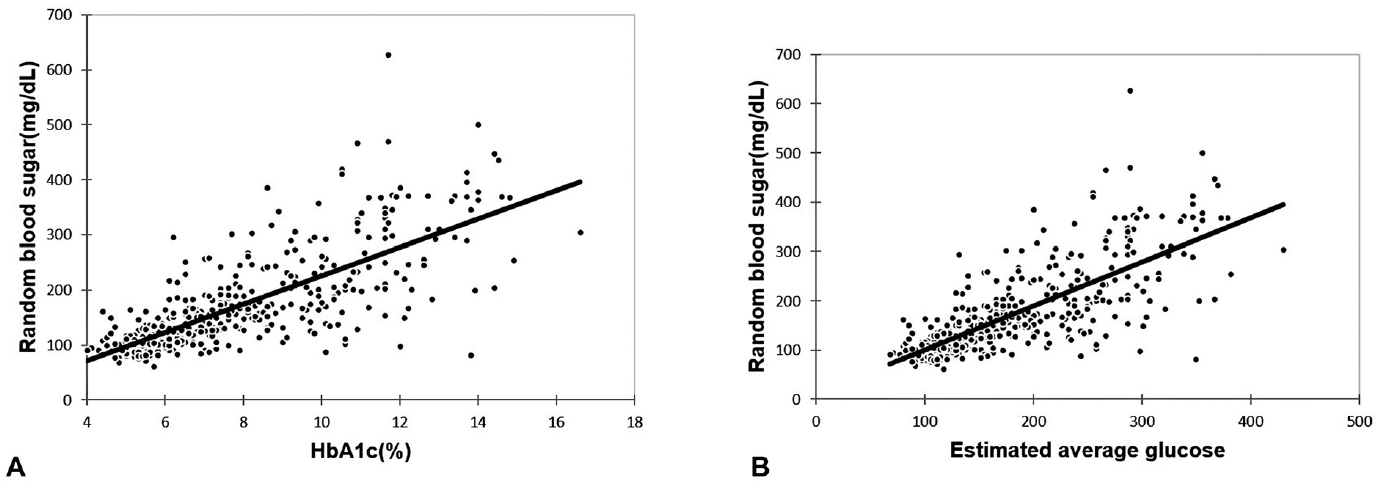
- (A) Correlation of hemoglobin A1c (HbA1c) (%) with random blood sugar (mg/dL) in total study subjects. (B) Correlation of estimated average glucose with random blood sugar (mg/dL) in total study subjects.
| Baseline characteristics | Frequency | Percentage |
|---|---|---|
| Gender | ||
| Female | 283 | 61.39 |
| Male | 178 | 38.61 |
| HbA1c (%) | ||
| > 9% (poorly controlled diabetic) | 131 | 28.42 |
| 6.5–9% (fairly controlled diabetic) | 152 | 32.97 |
| 5.7–6.4% (prediabetic) | 79 | 17.14 |
| < 5.7% (nondiabetic) | 99 | 21.48 |
| Mean ± SD | 7.8 ± 2.54 | |
| Median (25th–75th percentile) | 7 (5.8–9.5) | |
| Range | 4–16.6 | |
| Age (y) | ||
| Mean ± SD | 46.89 ± 13.2 | |
| Median (25th–75th percentile) | 47 (38–57) | |
| Range | 12–90 | |
| Random blood sugar (mg/dL) | ||
| Mean ± SD | 169.53 ± 86.1 | |
| Median (25th–75th percentile) | 139 (108–204) | |
| Range | 61–627 | |
| Estimated average glucose (mg/dL) | ||
| Mean ± SD | 177.2 ± 72.89 | |
| Median (25th–75th percentile) | 154.2 (119.76–225.95) | |
| Range | 68.1–429.72 | |
Abbreviations: HbA1c, hemoglobin A1c; SD, standard deviation.
| Parameters | Female (n = 283) | Male (n = 178) | Total | p-Value |
|---|---|---|---|---|
| Age (y) | ||||
| Mean ± SD | 45.41 ± 13.31 | 49.25 ± 12.68 | 46.89 ± 13.19 | 0.004a |
| Median (25th–75th percentile) | 45 (35–56) | 50 (41–57.75) | 47 (38–57) | |
| Range | 18–80 | 12–90 | 12–90 | |
| HbA1c (%) | ||||
| Mean ± SD | 7.53 ± 2.38 | 8.23 ± 2.73 | 7.8 ± 2.54 | 0.008a |
| Median (25th–75th percentile) | 6.8 (5.6–8.95) | 7.4 (6.1–10.075) | 7 (5.8–9.5) | |
| Range | 4.1–14.4 | 4–16.6 | 4–16.6 | |
| Random blood sugar (mg/dL) | ||||
| Mean ± SD | 162.14 ± 81.64 | 181.27 ± 91.75 | 169.53 ± 86.1 | 0.022a |
| Median (25th–75th percentile) | 134 (106.5–190) | 150 (114.25–228.75) | 139 (108–204) | |
| Range | 61–627 | 71–500 | 61–627 | |
| Estimated average glucose (mg/dL) | ||||
| Mean ± SD | 169.42 ± 68.22 | 189.56 ± 78.38 | 177.2 ± 72.89 | 0.008a |
| Median (25th–75th percentile) | 148.46 (114.02–210.165) | 165.68 (128.37–242.453) | 154.2 (119.76–225.95) | |
| Range | 70.97–366.58 | 68.1–429.72 | 68.1–429.72 | |
Abbreviations: HbA1c, hemoglobin A1c; SD, standard deviation.
a Mann–Whitney U test.
| Parameters | > 9% (poorly controlled diabetic) (n = 131) | 6.5–9% (fairly controlled diabetic) (n = 152) | 5.7–6.4% (prediabetic) (n = 79) | < 5.7% (nondiabetic) (n = 99) | Total | p-Value |
|---|---|---|---|---|---|---|
| Age (y) | ||||||
| Mean ± SD | 49.19 ± 11.52 | 50.89 ± 11.11 | 48.09 ± 11.39 | 36.76 ± 14.52 | 46.89 ± 13.19 | < 0.0001a |
| Median (25th–75th percentile) | 50 (40–56.5) | 51 (44–60) | 50 (40.5–56) | 35 (26–42) | 47 (38–57) | |
| Range | 18–80 | 21–85 | 24–78 | 12–90 | 12–90 | |
| HbA1c (%) | ||||||
| Mean ± SD | 11.25 ± 1.6 | 7.49 ± 0.73 | 6.06 ± 0.22 | 5.1 ± 0.38 | 7.8 ± 2.54 | < 0.0001a |
| Median (25th–75th percentile) | 10.9 (10–12.1) | 7.4 (6.875–8.1) | 6.1 (5.9–6.2) | 5.2 (4.85–5.4) | 7 (5.8–9.5) | |
| Range | 9.1–16.6 | 6.5–9 | 5.7–6.4 | 4–5.6 | 4–16.6 | |
| Random blood sugar (mg/dL) | ||||||
| Mean ± SD | 258.16 ± 96.56 | 162.29 ± 51.68 | 121.54 ± 32.5 | 101.65 ± 19.37 | 169.53 ± 86.1 | < 0.0001a |
| Median (25th–75th percentile) | 243 (197–322) | 151.5 (128.75–176.25) | 114 (104–127.5) | 97 (89–110.5) | 139 (108–204) | |
| Range | 82–627 | 85–385 | 61–295 | 69–164 | 61–627 | |
| Estimated average glucose (mg/dL) | ||||||
| Mean ± SD | 276.23 ± 45.87 | 168.29 ± 21.04 | 127.28 ± 6.32 | 99.67 ± 10.88 | 177.2 ± 72.89 | < 0.0001a |
| Median (25th–75th percentile) | 266.13 (240.3–300.57) | 165.68 (150.612–185.77) | 128.37 (122.63–131.24) | 102.54 (92.495–108.28) | 154.2 (119.76–225.95) | |
| Range | 214.47–429.72 | 139.85–211.6 | 116.89–136.98 | 68.1–114.02 | 68.1–429.72 | |
Abbreviations: HbA1c, hemoglobin A1c; SD, standard deviation.
a Kruskal–Wallis test.
| Variables | Random blood sugar (mg/dL) and HbA1c (%) | Random blood sugar (mg/dL) and estimated average glucose (mg/dL) | |
|---|---|---|---|
| Total study subjects | r | 0.782 | 0.782 |
| R2 | 0.612 | 0.612 | |
| p-value | < 0.0001 | < 0.0001 | |
| Female | r | 0.788 | 0.788 |
| R2 | 0.621 | 0.621 | |
| p-value | < 0.0001 | < 0.0001 | |
| Male | r | 0.763 | 0.763 |
| R2 | 0.582 | 0.582 | |
| p-value | < 0.0001 | < 0.0001 | |
| > 9% (poorly controlled diabetic) | r | 0.447 | 0.447 |
| R2 | 0.1998 | 0.1998 | |
| p-value | < 0.0001 | < 0.0001 | |
| 6.5–9% (fairly controlled diabetic) | r | 0.322 | 0.322 |
| R2 | 0.1037 | 0.1037 | |
| p-value | 0.0001 | 0.0001 | |
| 5.7–6.4% (prediabetic) | r | 0.111 | 0.111 |
| R2 | 0.0123 | 0.0123 | |
| p-value | 0.328 | 0.328 | |
| < 5.7% (nondiabetic) | r | 0.082 | 0.082 |
| R2 | 0.0067 | 0.0067 | |
| p-value | 0.422 | 0.422 | |
Abbreviation: HbA1c, hemoglobin A1c.
Note: Spearman rank correlation coefficient.
►Table 5(►Fig. 5) depicts these median values of RBS and eAG show statistically significant difference (p < 0.001).

- Descriptive statistics of random blood sugar (mg/dL) and estimated average glucose (mg/dL) of study subjects.
| Glycemic parameter | Mean ± SD | Median (25th–75th percentile) | Range | p-Value |
|---|---|---|---|---|
| Random blood sugar (mg/dL) | 169.53 ± 86.1 | 139 (108–204) | 61–627 | < 0.0001a |
| Estimated average glucose (mg/dL) | 177.2 ± 72.89 | 154.2 (119.76–225.95) | 68.1–429.72 |
Abbreviation: SD, standard deviation.
a Wilcoxon signed ranks test.
Discussion
One limitation often associated with HbA1c is the reporting units of mmol/mol and %, which differs from the usual units of blood glucose monitoring, that is, mg/dL, often creating a confusing situation for the patients as well as clinicians for comprehension.[10]
To overcome these limitations, international bodies including the American Diabetes Association and the International Diabetes Federation proposed a mathematical expression termed eAG, which facilitates comprehension of HbA1c values in units parallel to self-monitoring.[11] Various guidelines recommend reporting eAG with every HbA1c report; however, it is not widely practiced by the majority of laboratories, and advocacy is required regarding its use based on evaluation in the local population.[12] With this perspective in mind, we planned to study the association between RBS and eAG in a cohort of subjects.
This is the first study in Indian population correlating eAG values with RBS values in both diabetics and nondiabetic subjects. In this study, we found statistically significant correlation of RBS with eAG in total study subjects and diabetics (poorly controlled and fairly controlled groups) but no significant correlation was found between eAG and RBS in nondiabetic and prediabetic groups, which is similar to Kim et al findings. We also found in our study that RBS values cannot be used interchangeably with eAG values. Most of the below mentioned studies highlighted an association between eAG/HbA1c and RBS/fasting blood sugar (FBS)/postprandial blood sugar (PPBS)/self-monitored mean blood glucose (MBG) in diabetics, this association had not been checked in diabetic, prediabetic, and nondiabetic subgroups separately, possibly due to the study design which only included diabetics.
These studies represent association in patients labeled with DM divided into three groups on the basis of FBS/PPBS values as good control, moderate control, and poorly controlled glycemic state subjects, stating the statistically significant correlation of eAG with FBS and PPBS in total diabetic population under study and poorly controlled diabetic subjects. A study by Kariyawasan found a significant statistical correlation in both FBS and PPBS with eAG in the groups of patients with moderately poor control. In those with markedly poor control the FBS did not show a statistical correlation with eAG, as opposed to the PPBS.[9] Bozkaya et al have found that a strong positive correlation exists between fasting plasma glucose (FPG) levels and estimated average blood glucose levels (r = 0.757, p = 0.05).[10] Rosediani et al revealed that both PPBS and FBS correlated significantly with HbA1c but PPBS showed better correlation with HbA1c than FBS (r = 0.604 vs. 0.575).[13] Mahato et al found statistically significant correlation of eAG with FBS (r = 0.61, p < 0.001) and post prandial (PP) blood sugar levels (r = 0.65, p < 0.001).[14] Kim et al found that FPG showed a moderate correlation with eAG (r = 0.672, p < 0.001) in all subjects but when diabetic and nondiabetic subjects were divided into subgroups according to the FPG level, the correlation between eAG and FPG decreased in both subgroups as the FPG level decreased.[15] Guan et al found the relationship between HbA1c and FPG changed according to the different FPG ranges. [16] Azim et al found direct correlation between HbA1c and RBS in diabetics.[17] Ram et al found significant difference in eAG and FBS values.[18] Nkoana and Khine found a positive correlation between self-monitored MBG and HbA1c in all participants (R2 = 0.69, p < 0.0001) but clinically significant differences between MBG and eAG values.[19]
There were few limitations of this study. Notably, we did not categorized patients into type 1 and type 2 diabetics. Moreover, as the complete blood picture was not available for all subjects, anemic and other endocrine disorder cases were not excluded.
Conclusion
In conclusion, in poorly controlled diabetic care-sensitive group, eAG can serve as easily comprehensible way to determine average glucose levels with the same reporting units for self-blood glucose monitoring. This will supplement clinicians to facilitate care and counsel patients in a more convincing way. Moreover, it can serve as a useful measure for clinical laboratories of government hospitals in developing countries to enhance the quality of reporting at no added substantial cost.
Conflict of Interest
None declared.
Funding
None.
References
- IDF Diabetes Atlas. (9th). Brussels, Belgium: International Diabetes Federation; 2019.
- [Google Scholar]
- CARRS Surveillance Research Group. High burden of prediabetes and diabetes in three large cities in South Asia: the Center for cArdio-metabolic Risk Reduction in South Asia (CARRS) study. Diabetes Res Clin Pract. 2015;110(02):172-182.
- [CrossRef] [PubMed] [Google Scholar]
- Intensive blood-glucose control with sulphonylureas or insulin compared with conventional treatment and risk of complications in patients with type 2 diabetes (UKPDS 33) Lancet. 1998;352(9131):837-853.
- [CrossRef] [Google Scholar]
- Standards of medical care in diabetes–2010. Diabetes Care. 2010;33(Suppl. 01):S11-S61.
- [CrossRef] [PubMed] [Google Scholar]
- Usefulness of estimated average glucose (eAG) in glycemic control and cardiovascular risk reduction. Clin Biochem. 2020;84:45-50.
- [CrossRef] [PubMed] [Google Scholar]
- A1c-Derived Average Glucose Study Group. Translating the A1C assay into estimated average glucose values. Diabetes Care. 2008;31(08):1473-1478.
- [CrossRef] [PubMed] [Google Scholar]
- RSSDI-ESI Consensus Group. RSSDI-ESI clinical practice recommendations for the management of type 2 diabetes mellitusIndian J Endocrinol Metab. 20202020;24(01):1-122.
- [CrossRef] [Google Scholar]
- The association between Hba1c-derived estimated average glucose (eAG) with fasting blood sugar (FBS) and post prandial blood sugar (PPBS) in patients with type 2 diabetes in a cohort of patients in a tertiary care hospital in Sri Lanka. Clinics (São Paulo). 2021;3(02):x.
- [CrossRef] [Google Scholar]
- The association between estimated average glucose levels and fasting plasma glucose levels. Clinics (São Paulo). 2010;65(11):1077-1080.
- [CrossRef] [PubMed] [Google Scholar]
- Translating HbA1c measurements into estimated average glucose values in pregnant women with diabetes. Diabetologia. 2017;60(04):618-624.
- [CrossRef] [PubMed] [Google Scholar]
- Counterpoint: The reporting of estimated glucose with hemoglobin A1c. Clin Chem. 2010;56(04):547-549.
- [CrossRef] [PubMed] [Google Scholar]
- Correlation between fasting plasma glucose, post prandial glucose and glycated haemoglobin and fructosamine. Med J Malaysia. 2006;61(01):67-71.
- [Google Scholar]
- Association of estimated average glucose (eAG) with fasting, postprandial and average of fasting and PP serum glucose levels. Journal of Nepal Association for Medical Laboratory Sciences. 2012;11(01):14-18.
- [Google Scholar]
- The relationship between estimated average glucose and fasting plasma glucose. Clin Chem Lab Med. 2013;51(11):2195-2200.
- [CrossRef] [PubMed] [Google Scholar]
- The changing relationship between HbA1c and FPG according to different FPG ranges. J Endocrinol Invest. 2016;39(05):523-528.
- [CrossRef] [PubMed] [Google Scholar]
- Correlation between glycated haemoglobin and random plasma glucose levels for the screening of diabetes mellitus. Int J Pathol. 2010;8(02):59-62.
- [Google Scholar]
- Relationship between estimated average glucose (eAG) and fasting plasma glucose in a cohort of Pakistani diabetic subjects. Cureus. 2021;13(10):e18435.
- [CrossRef] [Google Scholar]
- Correlation between self-monitored mean blood glucose and average plasma glucose estimated from glycated haemoglobin in patients attending the diabetes clinic at Dr George Mukhari Academic Hospital, Pretoria, South Africa. S Afr Med J. 2020;110(05):416-421.
- [CrossRef] [PubMed] [Google Scholar]


