
Translate this page into:
Comparative Study of Calculated LDL-Cholesterol Levels with the Direct Assay in Patients with Hypothyroidism

Address for correspondence: Shrimanjunath Sankanagoudar, MBBS, MD, DNB, MNAMS, Department of Biochemistry, All India Institute of Medical Sciences (AIIMS), Basni Phase II, Jodhpur 342005, Rajasthan, India (e-mail: doc_manjunath@yahoo.co.in; sankanagoudars@aiimsjodhpur.edu.in).
This article was originally published by Thieme Medical and Scientific Publishers Pvt. Ltd. and was migrated to Scientific Scholar after the change of Publisher.
Abstract
Background
Hypothyroidism is one among the many factors that predisposes one to coronary artery disease. As low-density lipoprotein-cholesterol (LDL-C) is associated with cardiovascular risk, calculated LDL-C should have good accuracy with minimal bias. Hypothyroidism alters the lipid composition of lipoproteins by the secretion of triglyceride-rich lipoproteins, which affects the calculation of LDL-C. The present study aimed to compare 13 different formulae for the calculation of LDL-C including the newly derived Martin's formula by direct assay in patients of hypothyroidism.
Method
In this analytical cross-sectional study, a total of 105 patients with laboratory evidence of hypothyroidism, from January to June 2019, were studied, and blood samples were subjected for lipid profile analysis at central biochemistry laboratory. Calculated LDL-C was assessed by different formulae.
Result
We observed that calculated LDL-C by Friedewald's, Cordova's, Anandaraja's, Hattori's, and Chen's formulae has bias less than ± 5 compared with direct LDL-C, with Anandaraja's formula having the lowest bias (2.744) and Cordova's formula having lowest bias percentage (−1.077) among them. According to the Bland–Altman plots, the bias in Friedewald's and Anandraja's were equally distributed below and above the reference line of direct LDL-C.
Conclusion
This is the first study comparing different formulae for LDL-C calculation in patients with hypothyroidism. Anandaraja's formula was as equally effective as Friedewald's formula when used as an alternative cost-effective tool to evaluate LDL-C in hypothyroid patients. The recently proposed Martin's formula for calculated LDL-C had a higher bias when compared with Friedewald's and Anandaraja's formulae in patients with hypothyroidism.
Keywords
Anandaraja's formula
Friedewald's formula
hypothyroidism
LDL cholesterol
lipid profile
Martin's formula

Introduction
Thyroid hormones alter lipoprotein metabolism by inducing 3-hydroxy-3-methylglutaryl-coenzyme A reductase and also regulate the low-density lipoprotein (LDL) receptor (LDLR) expression at the genetic level.[1,2] In hypothyroidism, the decreased thyroid function would lower the LDLR activity as well as lipoprotein lipase activity leading to decreased catabolism of LDL, intermediate-density lipoprotein, and decreased clearance of triglyceride (TG)-rich lipoproteins.[3,4] Further, subclinical hypothyroidism leads to the greater secretion of larger TG-rich very-low-density lipoprotein (VLDL) particles from the liver when compared with euthyroid subjects and hyperthyroid subjects.[5] As TG is taken as an indirect marker of VLDL cholesterol, this leads to a bias in the calculation of LDL cholesterol (LDL-C). On cardiovascular risk assessment, patients with subclinical hypothyroidism are also found to be at increased risk.[6] Further, an altered lipid profile viz. atherogenic lipid profile was seen in patients with subclinical hypothyroidism when compared with the euthyroid subjects.[7] Therefore, the estimation of lipid profile is necessary to assess the risk of patients for cardiovascular disease and metabolic syndrome which would help in the early initiation of treatment. As LDL-C is associated with cardiovascular risk stratification, the formula for the calculation of LDL-C should have good accuracy with minimal bias. Different formulae have been devised to calculate the LDL-C from the measured lipid profile parameters, i.e., Friedewald et al,[8] Hattori et al,[9] Anandaraja et al,[10] Chen et al,[11] de Cordova and de Cordova,[12] Teerakanchana et al,[13] Ahmadi et al,[14] Delong et al,[15] Rao et al,[16] Martin et al,[17] Hata and Nakajima,[18] Puavilai et al,[19] and Vujovic et al.[20] Among these, the Friedewald formula is the most commonly used formula to calculate LDL-C.
The derivation of different formulae for the calculation of LDL-C requires these formulae to be validated in different populations as well as in different diseases before final implementation in the clinical practice. Various studies have tested the validity of Friedewald formula in various population groups[21-24] and in disease-specific cohort like metabolic syndrome cohort.[25] Attempts toward validation using different formulae in different populations have been undertaken in different countries as evidenced by the work done by Onyenekwu et al, Lee et al, and Alpdemir and Alpdemir.[26-28] Similarly, various studies have tried to validate different formulae in different diseases. To this extent, studies conducted by Fawwad et al, Karkhaneh et al, Paz et al, and Lin et al have validated them in diabetes, different metabolic health statuses, schizophrenic patients, and patients with coronary heart disease, respectively.[29-32] Alteration of lipid profile in patients with hypothyroidism has been documented by multiple studies.[33,34] However, to our knowledge, no studies have been undertaken to validate different formulae for the calculation of LDL-C in patients with hypothyroidism.
Given the altered TG content in subclinical and overt hypothyroidism, the current study aimed to compare 13 different formulae for calculated LDL-C with the direct assay in patients with subclinical and overt hypothyroidism. The comparison of calculated LDL-C in different forms of thyroid disorder or different chemistry analyzer platforms was out of this study's scope.
Materials and Methods
Study Design
This was an analytical cross-sectional study performed after obtaining approval by the institutional ethics committee on human subjects' research (AIIMS/IEC/2018/690). This study was conducted from January 2019 to June 2019. The frequency of dyslipidemia in primary hypothyroidism was found to be 91%.[35] The calculation was based on the assumption of an α error of 0.05 and a power of 90%. The estimated sample size was 89. Considering the subgroup analysis, 105 patients were recruited for the study. We calculated the sample size using the Open Epi program 9 Open Source Epidemiology statistics for Public Health, version 3.01. The samples were collected from patients with laboratory evidence of subclinical and overt hypothyroidism attending the medicine and endocrinology outpatient department of a tertiary care hospital. Patients with TG values greater than 350 mg/dL and hemolyzed blood samples were excluded from the study.
Sample Collection and Processing
Thyroid profile reports from the central biochemistry laboratory were analyzed for patients with laboratory evidence of subclinical and overt hypothyroidism. Those blood samples with thyroid hormonal values signifying subclinical and overt hypothyroidism were subjected for lipid profile analysis at the central biochemistry laboratory. The results of TG, total cholesterol (TC), high-density lipoprotein (HDL-C), and LDL-C by direct assay were analyzed in the Beckmann AU 680 clinical chemistry analyzer. Calculated LDL-C was assessed by the following formulae: LDL-C Friedewald et al, LDL-C Hattori et al, LDL-C Anandaraja et al, LDL-C Chen et al, LDL-C Cordova and Cordova, LDL-C Teerakanchana et al, LDL-C Ahmadi et al, LDL-C Delong, LDL-C Rao et al, LDL-C Martin et al, LDL-C Puavilai et al, LDL-C Hata and LDL-C Vujovic.
Lipoprotein Analysis
The serum was separated by centrifugation and analyzed on the Beckmann AU 680 autoanalyzer. TC and TG were measured enzymatically by CHOD-PAP and glycerol phosphate oxidase-peroxidase methods, respectively. TC and TG were calibrated using the system multicalibrator provided by Beckman Coulter, Inc., CA, United States. Direct LDL-C and HDL-C were measured by the selective solubilization method and the selective inhibition method. Direct LDL-C and HDL-C were calibrated using the calibrator provided with the reagent. Quality control was assessed for TC, TG, direct LDL-C, and HDL-C using 2 Levels of Liquichek Lipids Control from Bio-Rad Laboratories, Inc.
Statistical Analysis
The results were described as means, medians, and standard deviations (quantitative variables) or by frequency and percentiles (qualitative variables). Student's t test for paired samples was used to compare the results of LDL-C using different formulas and LDL-C by direct assay. Linear regression was performed to calculate the slope. Scatter-gram data, Bland–Altman diagram, and calculation of bias and difference percentage were used to evaluate results obtained using different formulae and direct assay. The underestimated and overestimated LDL-C values were compared with the direct assay values based on the existing formulae. A probability of 5% or less was considered significant.
Results
General Characteristics of the Study Participants
►Table 1 summarizes the characteristics of all 105 study participants of hypothyroidism including general characteristics, lipid profile, and baseline thyroid values.
| S. No. | Variables | Mean ± SD |
|---|---|---|
| 1. | Age, (mean ± SD) years | 40.52 ± 16.68 |
| 2. | Gender | |
| Men (number, %) | 35 (33.33%) | |
| Women (number, %) | 70 (66.67%) | |
| 3. | Total cholesterol (mean ± SD) mmol/L | 5.109 ± 1.27 |
| 4. | Triglyceride (mean ± SD) mmol/L | 1.81 ± 1.0 |
| 5. | HDL-C (mean ± SD) mmol/L | 1.14 ± 0.33 |
| 6. | LDL-C (direct) (mean ± SD) mmol/L | 3.056 ± 1.029 |
| 7. | Free T3 (median, IQR) pg/mL | 2.66, (2.36–3.05) |
| 8. | Free T4 (median, IQR) ng/dL | 0.98, (0.86–1.11) |
| 9. | TSH (median, IQR) mIU/L | 5.90, (4.53–13.05) |
Abbreviations: HDL-C, high-density lipoprotein cholesterol, IQR, interquartile range; LDL-C, low-density lipoprotein cholesterol; SD, standard deviation; TSH, thyroid-stimulating hormone.
Note: Data expressed as a mean ± standard deviation for normal distribution, median, IQR for non-normal distribution and number (percent) for categorical variables.
Comparison of an Estimated LDL-C Using the Different Formulae and Directly Measured LDL-C
Overall, there was a significant difference between calculated LDL-C and directly measured LDL-C in our study. Mean calculated LDL-C was higher than that obtained by directly measured in all formulae except Cordova's, Hattori's, and Hatta's formulae (►Table 2). All other formulae overestimated LDL-C compared with direct LDL-C. Also, Anandraja's and Chen's formulae did not show any significant difference in calculated LDL-C compared to Friedewald's formula.
| Measurement of LDL-C | Mean ± SD (n = 105) mg/dL | Mean ± SD (n = 105) mmol/L | Comparison with direct LDL-C (p-value) | Comparison with Friedewald's LDL-C (p-value) |
|---|---|---|---|---|
| LDL_Direct | 118.18 ± 39.82 | 3.05 ± 1.029 | NA | NA |
| LDL_Friedewald | 121.31 ± 40.93 | 3.13 ± 1.058 | 0.0001a | NA |
| LDL_Ahmadi | 172.38 ± 76.72 | 4.457 ± 1.983 | 0.0000a | < 0.0001a |
| LDL_Cordova | 115.06 ± 35.95 | 2.975 ± 0.929 | 0.0271a | < 0.0001a |
| LDL_Anandaraja | 120.92 ± 40.14 | 3.126 ± 1.038 | 0.0272a | 0.7413 |
| LDL_Hattori | 113.71 ± 38.44 | 2.940 ± 0.994 | < 0.0001a | < 0.0001a |
| LDL_Chen | 122.02 ± 38.97 | 3.155 ± 1.007 | < 0.0001a | 0.3244 |
| LDL_DeLong | 127.73 ± 41.83 | 3.303 ± 1.081 | < 0.0001a | < 0.0001a |
| LDL_Rao | 128.22 ± 42.79 | 3.315 ± 1.106 | < 0.0001a | < 0.0001a |
| LDL_Teerankanchcna | 127.22 ± 39.47 | 3.289 ± 1.020 | < 0.0001a | < 0.0001a |
| LDL_Martin | 125.50 ± 40.67 | 3.25 ± 1.05 | < 0.0001a | < 0.0001a |
| LDL_Hatta | 113.28 ± 40.22 | 2.93 ± 1.041 | < 0.0001a | < 0.0001a |
| LDL_Puavilai | 126.66 ± 41.66 | 3.281 ± 1.07 | < 0.0001a | < 0.0001a |
| LDL_Vujovic | 129.02 ± 42.04 | 3.342 ± 1.089 | < 0.0001a | < 0.0001a |
Abbreviations: LDL-C, low-density lipoprotein cholesterol; NA, not applicable; SD, standard deviation.
Note: Data expressed as a mean ± standard deviation of LDL-C. The different formulae used are LDL_Friedewald, LDL_Ahmadi, LDL_Cordova, LDL_Anandaraja, LDL_Hattori, LDL_Chen, LDL_DeLong, LDL_Rao, LDL_Teerankanchcna, LDL-C Martin el al, LDL-C Puavilai et al, LDL-C Hata and LDL-C Vujovic. Statistical test: Paired t-test.
a Denotes p-value < 0.05 which is considered as statistically significant.
Scatter Plots of Estimated LDL-C Using the Different Formulae and Directly Measured LDL-C
►Fig. 1 depicts the scatter plot of calculated LDL-C using Friedewald's formula and direct LDL-C, and ►Fig. 2 depicts the scatter plot of calculated LDL-C using different formulae in comparison with LDL Friedewald and direct LDL. Except for Ahmadi formula, all other formulae appeared to have comparable calculated LDL-C values compared to direct LDL-C estimation. Further, this comparable relationship was observed to be similar across all the ranges of direct LDL-C. LDL-C calculated by Ahmadi formula was found to be different from direct LDL-C estimation.
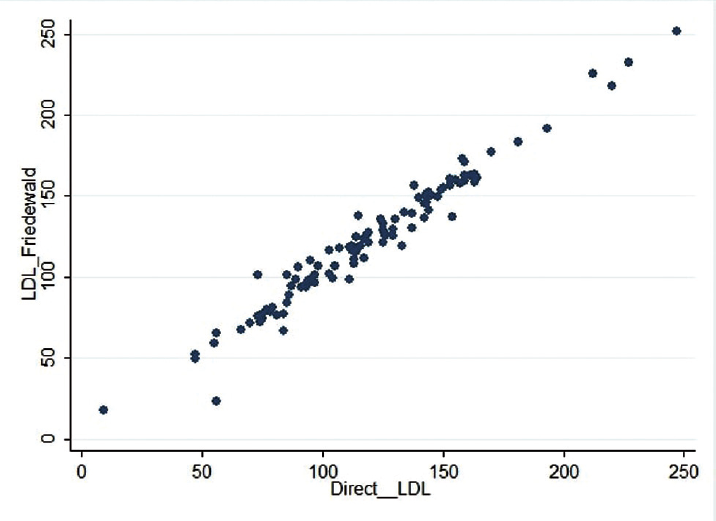
- Scatterplot of LDL-Friedewald compared to directly measured LDL-C: there was a correlation of r2 = 0.9625 and r = 0.9810.
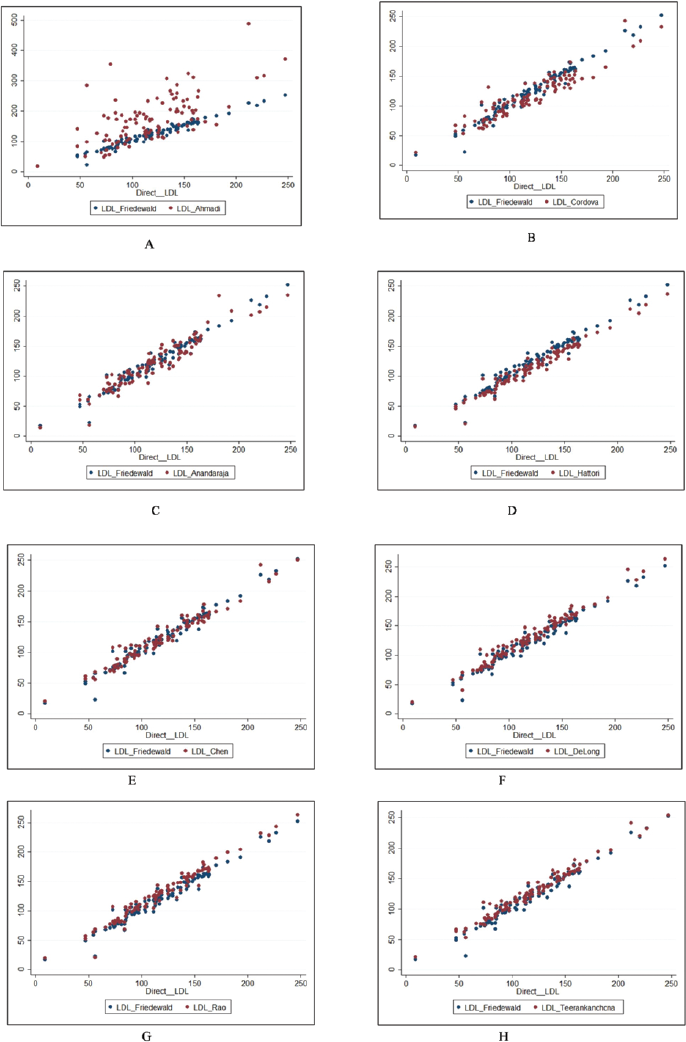
- (A-H): Scatterplot of calculated LDL-C using different formulae in comparison with LDL Friedewald and direct LDL-C.
Linear Regression of Estimated LDL-C Using the Different Formulae and Directly Measured LDL-C
Linear regression analysis showed Ahmadi's formulae having the highest slope (1.247) and lowest r2 value (0.4190). Calculated LDL-C using Cordova's formula was found to have the lowest slope (0.8435). In addition to Ahmadi's, calculated LDL-C using Friedewald's, DeLong's, Chen's, Puavilai's, and Vujovic's formulae also showed slope more than 1. All formulae found to have a good correlation against directly measured LDL-C (r2 > 0.90 and r > 0.95) except Ahmadi's (0.6473) in hypothyroid patients (►Table 3).
| Linear regression | Slope | SE | 95% CI | r2 value | r value |
|---|---|---|---|---|---|
| LDL_Friedewald | 1.008 | 0.0196 | 0.9695–1.047 | 0.9625 | 0.9810 |
| LDL_Ahmadi | 1.247 | 0.1447 | 0.9596–1.534 | 0.4190 | 0.6473 |
| LDL_Cordova | 0.8435 | 0.0316 | 0.7805–0.9064 | 0.8731 | 0.9343 |
| LDL_Anandaraja | 0.9583 | 0.0307 | 0.8972–1.019 | 0.9040 | 0.9507 |
| LDL_Hattori | 0.9468 | 0.0185 | 0.9100–0.9836 | 0.9620 | 0.9808 |
| LDL_Chen | 0.9541 | 0.0214 | 0.9115–0.9966 | 0.9506 | 0.9749 |
| LDL_DeLong | 1.032 | 0.0194 | 0.9930–1.070 | 0.9646 | 0.9821 |
| LDL_Rao | 1.053 | 0.0212 | 1.011–1.095 | 0.9598 | 0.9796 |
| LDL_Teerankanchana | 0.9745 | 0.0178 | 0.9390–1.010 | 0.9666 | 0.9831 |
| LDL_Martin | 0.9969 | 0.0218 | 0.9535–1.040 | 0.9528 | 0.9761 |
| LDL_Puavilai | 1.028 | 0.0192 | 0.9896–1.066 | 0.9651 | 0.9824 |
| LDL_Hatta | 0.9794 | 0.0243 | 0.9311–1.028 | 0.9403 | 0.9696 |
| LDL_Vujovic | 1.036 | 0.0198 | 0.9968–1.076 | 0.9634 | 0.9816 |
Abbreviations: LDL-C, low-density lipoprotein cholesterol; SE, standard error.
Note: Linear regression data expressed with slope, standard error, 95% confidence interval, r2 and r value of calculated LDL-C.
Assessment of Bias of Estimated LDL-C Using the Different Formulae and Directly Measured LDL-C
►Table 4 and ►Fig. 3 show the bias of calculated LDL-C by different formulae and direct LDL-C in the recruited patients. Calculated LDL-C using Ahmadi's was found to be the highest bias, and Anandaraja's showed the lowest bias when compared with direct LDL-C. On comparison with direct LDL-C, calculated LDL-C using Cordova's, Hattori's, and Hatta's were found to have a negative bias. The average bias was less than ± 5 for calculated LDL-C using Friedewald's, Cordova's, Anandaraja's, Hattori's, Chen's, and Hatta's formulae. The difference percentage was observed to be lowest for Cordova's followed by Friedewald's and Anandaraja's formulae. When compared with Friedewald's and Anandaraja's, Martin's formula exhibited higher bias and difference percentage in the calculation of LDL-C in hypothyroid patients.
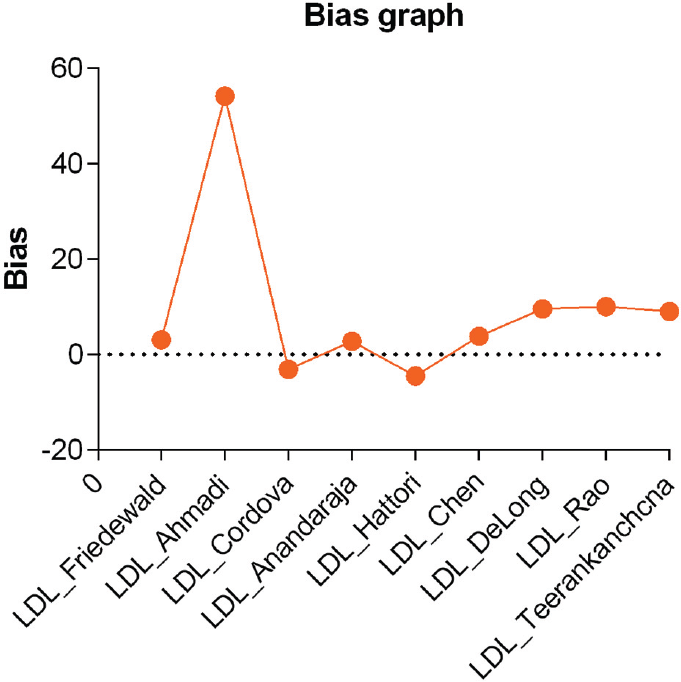
- Bias graph by different formulae and direct LDL-C.
| Calculated LDL-C | Bias (calculated – direct) | SD | Difference % ([calculated –direct]/average)*100 |
|---|---|---|---|
| LDL_Friedewald | 3.130 | 7.932 | 2.711 |
| LDL_Ahmadi | 54.20 | 59.31 | 32.59 |
| LDL_Cordova | −3.117 | 14.24 | −1.077 |
| LDL_Anandaraja | 2.744 | 12.55 | 2.438 |
| LDL_Hattori | −4.470 | 7.785 | −3.777 |
| LDL_Chen | 3.842 | 8.853 | 4.399 |
| LDL_DeLong | 9.551 | 7.974 | 8.500 |
| LDL_Rao | 10.05 | 8.830 | 8.304 |
| LDL_Teerankanchana | 9.044 | 7.287 | 8.829 |
| LDL_Martin | 7.328 | 8.838 | 6.896 |
| LDL_Hatta | −4.898 | 9.860 | −5.571 |
| LDL_Puavilai | 8.481 | 7.857 | 7.575 |
| LDL_Vujovic | 10.84 | 8.169 | 9.594 |
Abbreviations: LDL-C, low-density lipoprotein cholesterol; SD, standard deviation.
Note: Data expressed as a mean ± standard deviation of LDL-C and difference percentage.
Bland–Altman Plots for the Method Comparison of Estimated LDL-C Using the Different Formulae and Directly Measured LDL-C
►Fig. 4A–M depicts the Bland–Altman plots for estimated LDL-C using the different formulae and directly measured LDL-C. Bland–Altman plots brought out the bias present for different formulae at various levels of direct LDL-C. Friedewald's and Anandaraja's formulae appeared to estimate LDL-C levels with minimal bias when compared with direct estimation. Ahmadi's formulae displayed a trend of increasing bias with an increase in LDL-C levels. Interestingly, Cordova's formulae displayed a shift of bias from positive to negative with an increase in LDL-C levels. DeLong's, Rao's, Teerankanchana's, Martin's, Puavilai's, and Vujovic's formulae were found to have a predominantly positive bias across all levels of direct LDL-C.
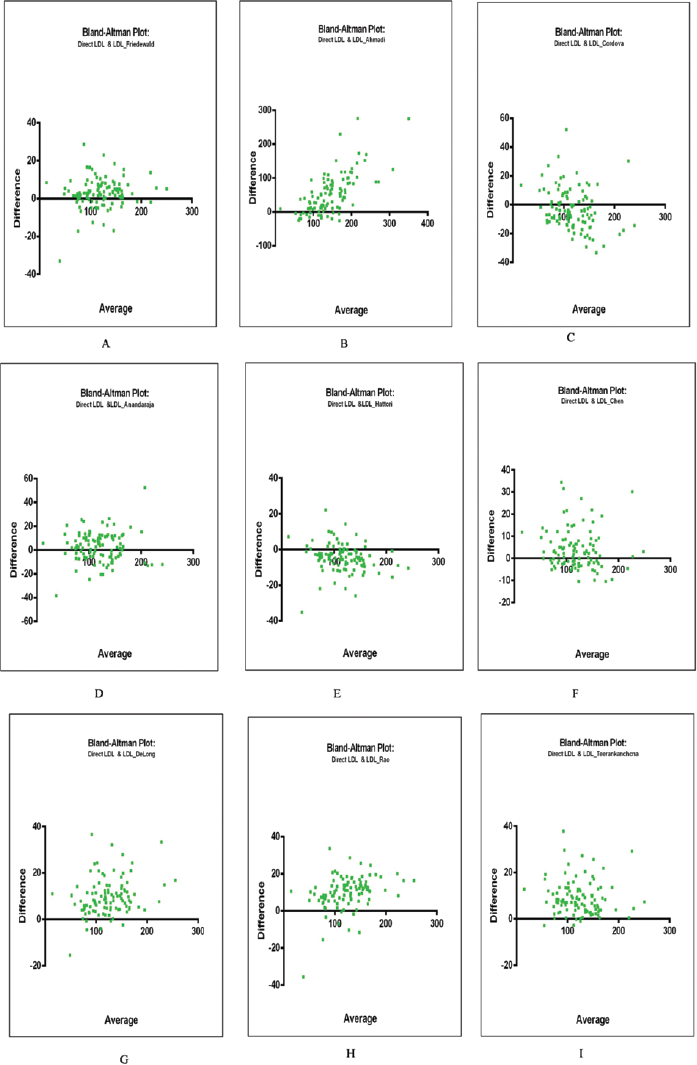
- (A-I) Bland–Altman plots of calculated LDL-C using different formulae with direct LDL-C.
Comparison of Frequency of Underestimated and Overestimated LDL-C Samples Using the Different Formulae and Directly Measured LDL-C
►Fig. 5 depicts frequency of underestimated and overestimated calculated LDL-C samples using different formulae and direct LDL-C. DeLong's, Rao's, Teerankanchana's, Martin's, Puavilai's, and Vujovic's formulae consistently overestimated LDL-C when compared with direct LDL-C. Chen's, Anandaraja's, and Cordova's showed approximately equal number of underestimated and overestimated samples. Using Friedewald's formula for the calculation of LDL-C, samples were overestimated when compared with direct LDL-C.
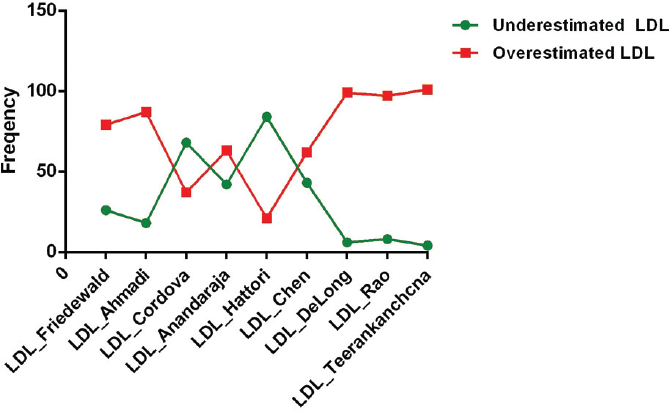
- Frequency of underestimated and overestimated calculated LDL-C and direct LDL-C.
Discussion
National Cholesterol Education Program (NCEP) Adult Treatment Panel-III (ATP) guidelines classify patients for cholesterol-lowering treatment including dietary therapy based on LDL-C levels. Hence, it is of utmost importance to accurately estimate LDL-C levels in patients prone to dyslipidemia. Increased risk for cardiovascular diseases in hypothyroidism patients due to altered lipid profiles makes it imperative to have a method of estimation of LDL-C with minimal bias. The reference method for LDL-C estimation is β quantification, but it is time-consuming and expensive which makes it not suitable for routine laboratory testing.[36,37] In 1972, Friedewald's et al published a landmark report describing a formula to estimate LDL-C as an alternative to tedious ultra-centrifugation and results of estimated LDL-C highly correlated with β quantification method. Over the past few years, many homogenous methods have been developed which are expensive and have also failed to show clear advantages in terms of performance when compared with Friedewald's calculation.[38-40] Although Friedewald's formula is the most widely used to estimate LDL-C in a clinical setup, it has its well-known limitations.[41,42] Since then, numerous efforts have been directed to address the limitations of Friedewald's formula in the general population as well as in disease-specific scenarios.[8-15] The present study was designed to evaluate the performance of 13 different formulae for calculated LDL-C in a set of Indian patients with subclinical and overt hypothyroidism.
Overall, there was a significant difference between calculated LDL-C and directly measured LDL-C in our study. We have found calculated LDL-C to be higher than directly measured LDL-C using Friedewald's, Ahmadi's, Anandaraja's, Chen's, DeLong's, Rao's, Teerankanchana's, Martin's, Puavilai's, and Vujovic's, except Cordova's, Hattori's and Hatta's formulae (►Table 2). Although no similar study has been undertaken in the hypothyroid disease cohort, Sahu et al[40] and Gasko[43] have reported similar findings, i.e., an overestimation of LDL-C by Friedewald's and Anandaraja's formulae in the general population. Some studies have reported an underestimation with calculated LDL-C to measured LDL-C.[44-47] We have found a correlation of greater than 0.950 in all calculated LDL-C and directly measured LDL-C except Ahmadi's (0.6473) in hypothyroid patients. Anandaraja et al reported the correlation of 0.97 between LDL-C measured by their formula and direct LDL-C and 0.88 between Friedewald's and directly measured LDL-C in the general population.9 In our study in the hypothyroid disease cohort, this correlation was found to be 0.950, 0.981, and 0.976, respectively, for Anandraja's, Friedewald's, and Martin's (►Table 3). Other studies have reported a correlation 0.88,[39] 0.786,[45] and 0.86,[48] respectively, in general population but not a disease-specific.
On analysis of bias of calculated LDL-C by different formulae and direct LDL-C, Ahmadi's had the highest and Anandaraja's had the lowest bias in hypothyroid patients. Calculated LDL-C using all 13 different formulae had positive bias compared to direct LDL-C except Cordova's, Hattori's, and Hatta's. Contradictorily, in the general population, Gupta et al[44] had reported negative bias in calculated LDL-C by Anandraja's and Friedewald's compared to direct LDL-C. In our study, the average bias was within ± 5 for calculated LDL-C using Friedewald's, Cordova's, Anandaraja's, Hattori's, Chen's, and Hatta's formulae (►Table 4). We found newer formulae like Martin's to have a higher bias (7.328) in patients with hypothyroidism in estimating LDL-C. We also observed that, in hypothyroid patients, Friedewald and Anandaraja formulae appeared to have a minimal bias when compared with direct estimation at different LDL-C levels. However, in the general population, Rim et al have demonstrated that Friedewald formula generally overestimates at low LDL-C range and underestimates at high LDL-C levels.[24] In contrast to our findings in hypothyroid patients, Vujovic et al have demonstrated that Anandaraja formula tends to have a negative bias on the estimation of LDL-C in the general population.[20]
From the present study, we found that apart from Friedewald's, calculated LDL-C using Anandaraja's, Chen's, and Cordova's also yield comparable results in hypothyroid patients. Both Anandaraja's and Chen's have a comparable slope and minimal bias. Further, both these formulas have a comparable number of underestimated and overestimated samples. Although Cordova's had the lowest difference percentage and minimal bias, the linear regression slope was observed to be 0.8435. This decreased slope for Cordova's was corroborated in Bland–Altman plot where the bias shifted from positive to negative with an increase in LDL-C levels. In contrast, calculated LDL-C using Friedewald's and Martin's, both having a slope of near to 1, had a higher number of overestimated samples. We also observed that formulae for the calculation of LDL-C displayed different characteristics viz. bias and correlation, in the hypothyroid disease cohort when compared with the general population. This corroborates the need for larger studies for the validation of the different formulae in overt and subclinical hypothyroid disease cohort given the altered lipoprotein metabolism and TG content in this specific disease cohort.
In the case of Anandaraja, as the formula considers only two analytes—TC and TG for calculation, it may diminish the total random error when compared with the other formulae. Since the formula does not require HDL cholesterol estimation for calculation, it can prove to be more economical also. Due to these favorable factors, Anandaraja's formula has already been approved for use in general population in Brazilian and Greek subjects.[43,49]
The present study also had several limitations that need to be addressed. First, the β-quantification method, which is considered the gold standard method for measuring LDL-C, has not been used. The data regarding treatment for hypothyroidism or any other comorbidities for the recruited subjects were not available for the study. The study needs to be validated within a larger study population.
Conclusion
As no study till now has compared the various formulae for LDL-C in hypothyroidism, this is the first such attempt to bring out the differing characteristics of formulae for LDL-C in patients with hypothyroidism when compared with the general population. All 13 formulae for calculated LDL-C have differed significantly from direct LDL-C in hypothyroid patients. When compared with Friedewald's, Anandaraja's, Chen's, and Cordova's formulae showed comparable calculated LDL-C results. Newer formulae like Martin's had higher bias and more samples were being overestimated in hypothyroidism. In conclusion, Friedewald's and Anandaraja's formulae outperformed others for estimating LDL-C against a direct measurement with Anandaraja's having a lesser bias. The Anandaraja's formulae could be used as an alternative cost-effective tool to Friedewald's to measure LDL-C when the direct measurement cannot be afforded in hypothyroid patients. The differing characteristics of various formulae in hypothyroid patients, when compared with the general population, bring into attention the role of altered lipoprotein metabolism in hypothyroidism in the calculation of LDL-C and cardiovascular risk assessment and this needs to be validated in a larger study population.
Conflict of Interest
None declared.
Funding
None.
References
- Effects of triiodothyronine and amiodarone on the promoter of the human LDL receptor gene. Biochem Biophys Res Commun. 1998;249(02):517-521.
- [CrossRef] [PubMed] [Google Scholar]
- Thyroid hormone regulation and cholesterol metabolism are connected through sterol regulatory element-binding protein-2 (SREBP-2) J Biol Chem. 2003;278(36):34114-34118.
- [CrossRef] [PubMed] [Google Scholar]
- Plasma triglyceride metabolism in thyroid disease. J Clin Invest. 1972;51(08):2103-2114.
- [CrossRef] [PubMed] [Google Scholar]
- Cholesterol metabolism in hypothyroidism and hyperthyroidism in man. J Lipid Res. 1981;22(02):323-338.
- [CrossRef] [PubMed] [Google Scholar]
- Subclinical hypothyroidism and hyperthyroidism have opposite effects on hepatic very-low-density lipoprotein-triglyceride kinetics. J Clin Endocrinol Metab. 2012;97(03):E414-E418.
- [CrossRef] [PubMed] [Google Scholar]
- Subclinical hypothyroidism: association with cardiovascular risk factors and components of metabolic syndrome. Biotechnol Biotechnol Equip. 2015;29(01):157-163.
- [CrossRef] [PubMed] [Google Scholar]
- Even mildly elevated TSH is associated with an atherogenic lipid profile in postmenopausal women with subclinical hypothyroidism. Endocr Res. 2015;40(01):1-7.
- [CrossRef] [PubMed] [Google Scholar]
- Estimation of the concentration of low-density lipoprotein cholesterol in plasma, without use of the preparative ultracentrifuge. Clin Chem. 1972;18(06):499-502.
- [Google Scholar]
- Development of approximate formula for LDL-chol, LDL-apo B and LDL-chol/LDL-apo B as indices of hyperapobetalipoproteinemia and small dense LDL. Atherosclerosis. 1998;138(02):289-299.
- [CrossRef] [PubMed] [Google Scholar]
- Low-density lipoprotein cholesterol estimation by a new formula in Indian population. Int J Cardiol. 2005;102(01):117-120.
- [CrossRef] [PubMed] [Google Scholar]
- A modified formula for calculating low-density lipoprotein cholesterol values. Lipids Health Dis. 2010;9:52.
- [CrossRef] [PubMed] [Google Scholar]
- A new accurate, simple formula for LDL-cholesterol estimation based on directly measured blood lipids from a large cohort. Ann Clin Biochem. 2013;50(Pt 1):13-19.
- [CrossRef] [PubMed] [Google Scholar]
- Comparative study of LDL-cholesterol levels in Thai patients by the direct method and using the Friedewald formula. Southeast Asian J Trop Med Public Health. 2007;38(03):519-527.
- [Google Scholar]
- The impact of low serum triglyceride on LDL-cholesterol estimation. Arch Iran Med. 2008;11(03):318-321.
- [Google Scholar]
- A comparison of methods for the estimation of plasma low- and very low-density lipoprotein cholesterol. The Lipid Research Clinics Prevalence Study. JAMA. 1986;256(17):2372-2377.
- [CrossRef] [PubMed] [Google Scholar]
- Calculation of low-density lipoprotein cholesterol with use of triglyceride/cholesterol ratios in lipoproteins compared with other calculation methods. Clin Chem. 1988;34(12):2532-2534.
- [CrossRef] [PubMed] [Google Scholar]
- Comparison of a novel method vs the Friedewald equation for estimating low-density lipoprotein cholesterol levels from the standard lipid profile. JAMA. 2013;310(19):2061-2068.
- [CrossRef] [PubMed] [Google Scholar]
- Application of Friedewald's LDL-cholesterol estimation formula to serum lipids in the Japanese population. Jpn Circ J. 1986;50(12):1191-1200.
- [CrossRef] [PubMed] [Google Scholar]
- The accuracy in using modified Friedewald equation to calculate LDL from non-fast triglyceride: a pilot study. J Med Assoc Thai. 2009;92(02):182-187.
- [Google Scholar]
- Evaluation of different formulas for LDL-C calculation. Lipids Health Dis. 2010;9:27.
- [CrossRef] [PubMed] [Google Scholar]
- Validation of the Friedewald formula for the determination of low-density lipoprotein cholesterol compared with beta-quantification in a large population. Clin Biochem. 2004;37(09):785-790.
- [CrossRef] [PubMed] [Google Scholar]
- Validation of the Friedewald formula for the estimation of low density lipoprotein cholesterol in a sub-Saharan African population. Clin Biochem. 2018;53:25-30.
- [CrossRef] [PubMed] [Google Scholar]
- Comparison of various formulae for estimating low-density lipoprotein cholesterol by a combination of ages and genders in Taiwanese adults. BMC Cardiovasc Disord. 2014;14:113.
- [CrossRef] [PubMed] [Google Scholar]
- Comparison and validation of 10 equations including a novel method for estimation of LDL-cholesterol in a 168,212 Asian population. Medicine (Baltimore). 2016;95(14):e3230.
- [CrossRef] [PubMed] [Google Scholar]
- Validation of the Friedewald formula in patients with metabolic syndrome. Cholesterol. 2014;2014 261878
- [CrossRef] [PubMed] [Google Scholar]
- Comparison of LDL-cholesterol estimate using the Friedewald formula and the newly proposed de Cordova formula with a directly measured LDL-cholesterol in a healthy South African population. Ann Clin Biochem. 2014;51(Pt 6):672-679.
- [CrossRef] [PubMed] [Google Scholar]
- Validation of the Martin method for estimating low-density lipoprotein cholesterol levels in Korean Adults: findings from the Korea National Health and Nutrition Examination Survey, 2009-2011. PLoS One. 2016;11(01):e0148147.
- [CrossRef] [PubMed] [Google Scholar]
- Comparison of Martin and Friedewald equation for estimated LDL-C in adults. Turk Kardiyol Dern Ars. 2021;49(08):619-626.
- [CrossRef] [PubMed] [Google Scholar]
- Measured versus calculated LDL-cholesterol in subjects with type 2 diabetes. Pak J Med Sci. 2016;32(04):955-960.
- [CrossRef] [PubMed] [Google Scholar]
- Evaluation of eight formulas for LDL-C estimation in Iranian subjects with different metabolic health statuses. Lipids Health Dis. 2019;18(01):231.
- [CrossRef] [PubMed] [Google Scholar]
- LDL cholesterol estimation using the Anandaraja's and Friedewald's formulas in schizophrenic patients treated with antipsychotic drugs. Clin Biochem. 2008;41(12):1002-1007.
- [CrossRef] [PubMed] [Google Scholar]
- Comparison of non-fasting LDL-C levels calculated by Friedewald formula with those directly measured in Chinese patients with coronary heart disease after a daily breakfast. Clin Chim Acta. 2019;495:399-405.
- [CrossRef] [PubMed] [Google Scholar]
- Hypothyroidism and lipid levels in a community based study (TTS) Int J Endocrinol Metab. 2015;14(01):e22827.
- [CrossRef] [Google Scholar]
- Effects of thyroid dysfunction on lipid profile. Open Cardiovasc Med J. 2011;5:76-84.
- [CrossRef] [PubMed] [Google Scholar]
- Hypothyroidism; as a cause of dyslipidemia in young predisposes to increased risk of cardiovascular disease. Prof Med J. 2017;24:36-41.
- [CrossRef] [Google Scholar]
- Measurement of low density lipoprotein cholesterol. In: Rifai N, Warnick GR, Dominiczak MH, eds. Handbook of Lipoprotein Testing. Washington: AACC Press; 1997. p. :145-60.
- [Google Scholar]
- Analytical performance of a direct assay for LDL-cholesterol: a comparative assessment versus Friedewald's formula. Anadolu Kardiyol Derg. 2005;5(01):13-17.
- [Google Scholar]
- Methods for measurement of LDL-cholesterol: a critical assessment of direct measurement by homogeneous assays versus calculation. Clin Chem. 2002;48(02):236-254.
- [Google Scholar]
- Reactions of direct LDL-cholesterol assays with pure LDL fraction and IDL: comparison of three homogeneous methods. Clin Chim Acta. 2000;295(1-2):97-106.
- [CrossRef] [PubMed] [Google Scholar]
- Comparison of two methods of estimation of low density lipoprotein cholesterol, the direct versus Friedewald estimation. Indian J Clin Biochem. 2005;20(02):54-61.
- [CrossRef] [PubMed] [Google Scholar]
- Calculated values for low-density lipoprotein cholesterol in the assessment of lipid abnormalities and coronary disease risk. Clin Chem. 1990;36(01):36-42.
- [CrossRef] [PubMed] [Google Scholar]
- Calculated low-density lipoprotein cholesterol should not be used for management of lipoprotein abnormalities in patients with diabetes mellitus. Diabetes Care. 1993;16(08):1081-1086.
- [CrossRef] [PubMed] [Google Scholar]
- Low-density lipoprotein cholesterol estimation by the Anandaraja's formula—confirmation. Lipids Health Dis. 2006;5:18.
- [Google Scholar]
- Does LDL-C estimation using Anandaraja's formula give a better agreement with direct LDL-C estimation than the Friedewald's formula? Indian J Clin Biochem. 2012;27(02):127-133.
- [CrossRef] [PubMed] [Google Scholar]
- A comparison of calculated with direct measurement of low density lipoprotein cholesterol level. JCMCTA. 2009;20:19-23.
- [CrossRef] [Google Scholar]
- A direct measurement for LDL-cholesterol increases hypercholesterolemia prevalence: comparison with Friedewald calculation. J UOEH. 2010;32(03):211-220.
- [CrossRef] [PubMed] [Google Scholar]
- Method of LDL cholesterol measurement influences classification of LDL cholesterol treatment goals: clinical research study. J Investig Med. 2010;58(08):945-949.
- [CrossRef] [PubMed] [Google Scholar]
- How should low-density lipoprotein cholesterol concentration be determined? J Fam Pract. 2002;51(11):972-975.
- [Google Scholar]
- LDL-cholesterol calculation formulas in patients with or without the metabolic syndrome. Int J Cardiol. 2007;119(03):414-415.
- [CrossRef] [PubMed] [Google Scholar]


