Translate this page into:
Assessment of Dyslipidemia, Lipid Ratios, and Atherogenic Indices as Cardiovascular Risk Factors in Prediabetic and Diabetic Subjects
This article was originally published by Thieme Medical and Scientific Publishers Pvt. Ltd. and was migrated to Scientific Scholar after the change of Publisher.
Abstract
Background
Uttarakhand is a small state in northern India that comprises mixed population with people dwelling in both hilly and plain areas. Globally, diabetes mellitus (DM) has already been considered to be a pandemic. Furthermore, cardiovascular diseases (CVD) significantly increase mortality and morbidity in patients suffering from DM. Additionally, dyslipidemia has been identified as an important marker in the development of atherosclerosis and ultimately CVD in patients of prediabetes and diabetes. Thus, the identification of subjects with dyslipidemia in prediabetes might be fruitful in lowering their progression to diabetes and ultimately in decreasing incidences of CVD. Hence, this study was undertaken to assess dyslipidemia via the calculation of atherogenic indices (AI) and lipid ratios in prediabetic and diabetic groups attending tertiary care hospital in Uttarakhand.
Materials and Methods
This study reviewed retrospective biochemical data of 500 study subjects from e-hospital software of the All India Institute of Medical Sciences, Rishikesh. All study subjects were divided into three groups: 122 controls, 137 prediabetics, and 241 diabetics based on the American Diabetes Association criteria. Study subjects were evaluated for glycated hemoglobin (HbA1c), lipid profile, and AI (total cholesterol [TC]/high-density lipoprotein cholesterol [HDLc], low-density lipoprotein cholesterol [LDLc]/HDLc, TC-HDLc/HDLc, triglycerides [TG]/HDLc).
Results
Results showed that TC, TG, LDLc, and AI were significantly higher, and HDLc was significantly decreased in prediabetic and diabetic groups compared with controls. Furthermore, HbA1c showed significant positive correlation with lipid profile and AI except atherogenic coefficient (TC-HDL/HDL).
Conclusion
In conclusion, the current study showed the presence of dyslipidemia in both prediabetic and diabetic groups underlining their importance for screening at the prediabetic stage. Hence, we also recommend screening of the prediabetic group for dyslipidemia to arrest the development of early cardiovascular complications.
Keywords
prediabetes
diabetes
dyslipidemia
atherogenic indices
cardiovascular disease

Introduction
Globally, diabetes mellitus (DM) has already been considered as a pandemic. In this, India stands out way ahead as the diabetic capital of the world with 69.1 million diabetes cases. The prevalence of diabetes in majority of Indian cities fell between 9 and 12% with a national average of 7.7% in 2016,[1] whereas the prevalence of prediabetes in India stood between 10 and 14% as against the global prevalence of 8%.[2,3] Around 70% of the prediabetes patients eventually develop diabetes if not managed early,[4,5] with the annual turnover rate being 5 to 10%.
Glycated hemoglobin (HbA1c) is formed by non-enzymatic addition of glucose to the globin part of hemoglobin and indicates glycemic control in preceding 6 to 8 weeks. The American Diabetes Association (ADA) defines prediabetes as HbA1C 5.7 to 6.4% and diabetes as greater than 6.5% HbA1C.[6] Cardiovascular disease (CVD) is the key cause of morbidity and mortality in DM, and according to some estimates, it accounts for approximately 75 to 80% of overall deaths as diabetes-associated complications.[7] Dyslipidemia, a frequent association with diabetes, plays a key role in accelerating atherosclerosis and, hence, is a chief contributor to the causation of CVD. Dyslipidemia, particularly elevated levels of low-density lipoprotein cholesterol (LDLc), elevated triacylglycerol (TG), and decreased levels of high-density lipoprotein cholesterol (HDLc), is associated with an increased risk of CVD; thus, early detection and treatment of dyslipidemia can markedly help in the prevention of cardiovascular morbidity and mortality in persons suffering from DM.[8] Recently, various indices like Castelli's risk index-I (CRI-I), atherogenic index (AI), atherogenic coefficient (AC), and surrogate marker of insulin resistance have also emerged as potential biomarkers to assess CVD risk in subjects of prediabetes and diabetes.
Mostly, in India incidences of DM occur in urban areas. Plenty of studies are available justifying the role of dyslipidemia in prediabetes and diabetes in urban areas of northern India. However, little is known about Uttarakhand regions where the problem may be exacerbated by poverty and poor access to health care facilities. Uttarakhand is a small state in northern India that comprises mixed population with people living both in hills and plain areas. People dwelling in hills owing to different climatic conditions and rough terrains have different lifestyles and metabolism as compared with people inhabiting plains. This may have bearing on risk factors associated with CVD. Therefore, this study was undertaken to compare lipid profile along with AI in prediabetic and diabetic subjects presented at the tertiary care hospital of All India Institute of Medical Sciences (AIIMS), Rishikesh, Uttarakhand.
Materials and Methodologies
Study Subjects
In this study, for review of retrospective data, ethical approval was obtained from institutional ethics committee (IEC No.: AIIMS/BIOCHEM/22/2020/213; dated: 28.4.2020) situated at AIIMS, Rishikesh, India. This retrospective study reviewed the electronic laboratory records of 500 study subjects for the analysis of blood samples received at the clinical biochemistry laboratory of AIIMS, Rishikesh, Uttarakhand, from September 2019 to February 2020. In the inclusion criteria, patients with requisition for HbA1C along with lipid profile with or without sugar and with normal kidney function test (KFT) and liver function test (LFT) were included, whereas those having altered KFT and LFT were excluded from the study. A total of 500 study subjects were selected and divided into three study groups: control, prediabetic, and diabetic subjects based on the ADA criteria that define prediabetes as HbA1C 5.7 to 6.4% and diabetes as HbA1C greater than 6.5%.[6]
Sample Collection
Electronic laboratory records were collected for the subject's data comprising of HbA1c and lipid profile (total cholesterol [TC], TG, LDLc, and HDLc) that were analyzed on a fully automated analyzer (Beckman Coulter AU680, Brea, CA, United States) in clinical biochemistry laboratory. HbA1c was analyzed by the ion-exchange chromatography method on a high-performance liquid chromatography machine (Tosoh G8, Tokyo, Japan). Two levels of internal quality controls were run on an instrument, and samples were analyzed only after satisfactory quality control results in the laboratory. During the period of study, there was no change made in equipment, reagents, calibration standards, and controls.
Following AIs were also calculated:
CRI-I=TC/HDLc
AI=LDLc/HDLc
AC=(TC–HDLc)/HDLc
Surrogate marker of insulin resistance=TG/HDLc.
Statistical Analysis
The analysis of data was done using SPSS software's version 23.0 (IBM, Armonk, NY, United States) and GraphPad Prism 6 (GraphPad Software Inc., San Diego, CA, United States). The normality of data was tested using the Kolmogorov–Smirnov test between mean ranks. Comparisons were evaluated by the Kruskal–Wallis test with post-hoc test (Dunn's multiple comparison and non-parametric analysis of variance). The Mann–Whitney U test (non-parametric data) was used to compare the available data. The association between the HbA1c and lipid profile and AI was analyzed using Spearman's correlation analysis. p-Value less than 0.05 was considered statistically significant.
Results
Clinical data of 500 study subjects enrolled at AIIMS, Rishikesh, were reported in this study. All subjects were divided into three groups. Group I of 122 control subjects, group II of 137 prediabetics, and group III of 241 diabetics were evaluated. Of the total subjects, 196 (39.2%) were females and 304 (60.8%) were males as shown in ►Table 1. Mean age (in years) of males in control, prediabetic, and in the diabetic group were 50.5±15.6, 51.8±16.5, and 54.1±14.3 years, respectively. Similarly, the mean ages of females were 49.8±13.7, 51.6±14.3, and 54.4±15.2 years in control, prediabetic, and diabetic groups, respectively. No statistically significant difference in the age of control, prediabetic, and diabetic groups was observed (►Table 1).
| Sex | % | Number (N) | Age in year (mean±SD) | Χ2 | p-Value | |
|---|---|---|---|---|---|---|
| Controls | Male | 63.9 | 78 | 50.5±15.6 | 0.8 | 0.7 |
| Female | 35.2 | 44 | 49.8±13.7 | |||
| Prediabetes | Male | 58.4 | 80 | 51.8±16.5 | ||
| Female | 41.6 | 57 | 51.6±14.3 | |||
| Diabetes | Male | 60.5 | 146 | 54.1±14.3 | ||
| Female | 39.4 | 95 | 54.4±15.2 |
Abbreviation: SD, standard deviation.
On the normality test, only TC in control and prediabetic groups and HDL, LDL, and LDL/HDL ratio in the prediabetic group were found to be normally distributed. Rest parameters were not normally distributed. Hence, non-parametric analysis was performed to find differences between mean ranks. On post-hoc analysis, TC and LDL were found to be significantly higher, and HDL was determined to be significantly lower in both prediabetic and diabetic groups as compared with the control group. However, TG, very-low-density lipoproteins (VLDL), and AI were significantly higher only in the diabetic group compared with the control group (►Figs. 1 and 2). The median (interquartile range [IQR]) values of TC in control, prediabetic, and diabetic groups were determined as 135.4 (109.2–160.6), 159.4 (137.0–187.3), and 167.7 (139.3–201.4) mg/dL, respectively. The result showed that there were significantly increased TC levels in diabetic subjects compared with prediabetic and control subjects and significantly higher TC levels in prediabetics compared with controls as shown in ►Fig. 1A. Median (IQR) values of HDL in control, prediabetic, and diabetic groups were found as 47.9 (32.7–52.3), 46.60 (36.9–57.4), and 42.85 (38.2–59.1) mg/dL, respectively, which showed that the control group had significantly higher HDL values compared with prediabetic and diabetic groups as seen in ►Fig. 1B. Furthermore, median (IQR) levels of TG in control, prediabetic, and diabetic groups were found to be 124.6 (87.1–169.1), 127.5 (92.7–197.4), and 142.2 (106.1–211.7) mg/dL, respectively, and, as shown in ►Fig. 1C, results showed that TG levels were significantly higher (p<0.01) in the diabetic group as compared with the control group. Median (IQR) values of serum LDLc were determined to be 75.35 (54.1–104.7), 92.3 (68.1–131.3), and 102.5 (75.1–137.1) mg/dL in control, prediabetic, and in diabetic subjects, respectively. LDLc levels were significantly higher (p<0.001) in diabetic and prediabetic groups in comparison to the control group as seen in ►Fig. 1D. Median levels of VLDL were found to be 25.1 (17.4–33.8), 25.5 (18.5–39.5), and 28.3 (20.0–42.6) mg/dL in control, prediabetic, and in diabetic groups, respectively. VLDL levels were significantly higher (p<0.01) in the diabetic group as compared with the control group (►Fig. 1E). The median value of CRI-I was found to be 3.1 (2.7–3.7), 3.3 (2.8–3.9), and 3.5 (3.0–4.2) in controls, prediabetics, and diabetics, respectively. The diabetic group has significantly higher (p≤0.001) values than controls (►Fig. 1). In our study, the median (IQR) value of AI (LDLc/HDLc) for controls and prediabetics was determined to be 1.8 (1.5–2.4) and 2.0 (1.5–2.5), respectively, with no significance obtained. It was found to be 2.2 (1.6–2.8) in diabetics which was significantly higher (p≤0.001) compared with controls (►Fig. 1). AC (TC-HDLc/HDLc) is a measure of all lipoproteins that are atherogenic (LDL, IDL, VLDL, Lpa) with respect to good cholesterol (HDLc). Median (IQR) levels of AC (TC-HDLc)/HDLc) in control, prediabetic, and diabetic groups were found as 2.1 (1.7–2.7), 2.3 (1.9–2.9), and 2.5 (2.0–3.2), respectively, which is significantly higher (p≤0.0009) than controls (2.3±0.9) (►Fig. 1). We found a median (range) value for the surrogate marker of insulin resistance (TG/HDLc) 3.1 (2.1–4.5) in controls, 2.9 (1.9–4.4) in prediabetics, and 3.2 (2.1–4.8) in diabetics. No significant difference could be achieved between them (►Fig. 1), as shown in ►Table 2.
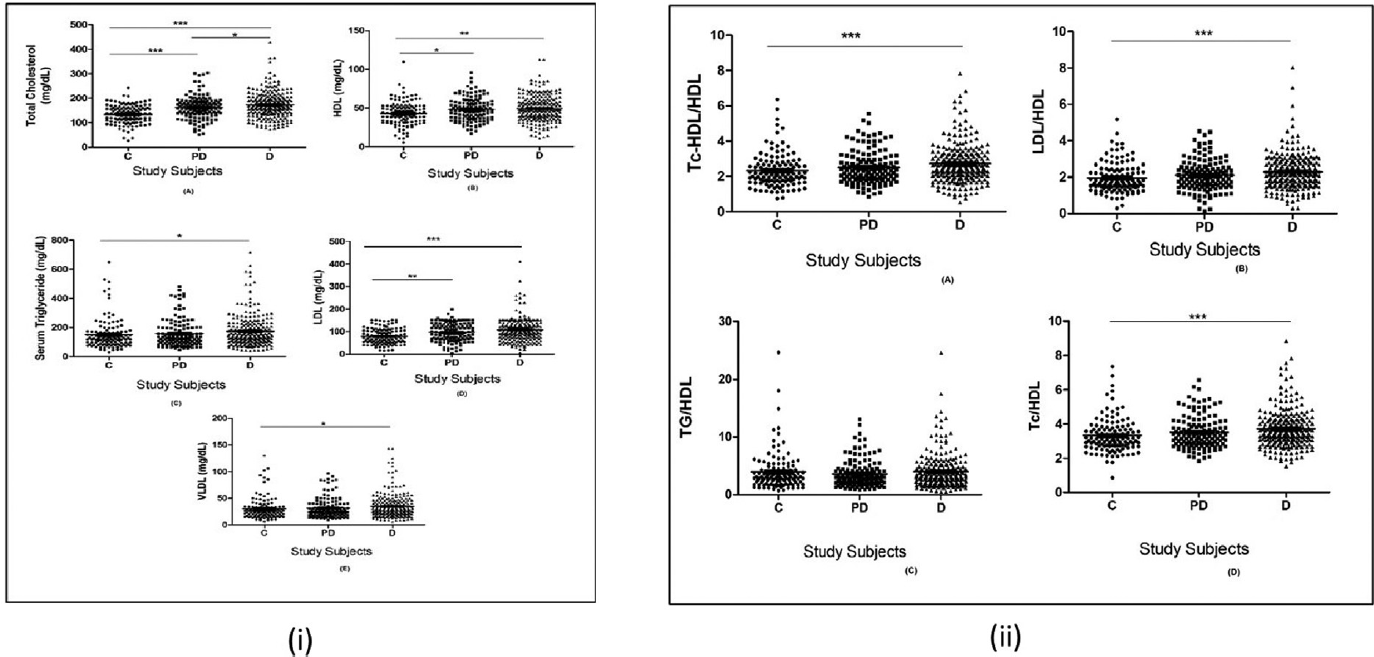
- (i) Comparison of lipid profile (A) total cholesterol (B) high-density lipoproteins cholesterol (HDLc) (C) triglycerides (TG) (D) low-density lipoproteins cholesterol (LDLc) (E) very-low-density lipoproteins (VLDL) between study subjects. C=control, PD=prediabetes, D=diabetes. (ii) Comparison of atherogenic indices between study subjects. * p≤0.05 is considered as significant.

- (i) Spearman's rank correlation analysis between HbA1c and lipid profile. (ii) Spearman's rank correlation analysis between HbA1c and atherogenic indices.
| Parameters | Controls median (IQR: 25–75%) | Prediabetes median (IQR: 25–75%) | Diabetes median (IQR: 25–75%) | p-Value (p<0.05) |
|---|---|---|---|---|
| TC (< 200mg/dL) | 135.4 (109.2–160.6) | 159.4 (137.0–187.3) | 167.7 (139.3–201.4) | < 0.0001 |
| TG (< 150mg/dL) | 124.6 (87.1–169.1) | 127.5 (92.7–197.4) | 142.2 (106.1–211.7) | ≤ 0.01 |
| HDL (40–60mg/dL) | 47.9 (32.7–52.3) | 46.6 (36.9–57.4) | 42.9 (38.2–59.1) | ≤ 0.003 |
| LDL (100–130mg/dL) | 75.4 (54.1–104.7) | 92.3 (68.1–131.3) | 102.5 (75.1–137.1) | < 0.0001 |
| VLDL (20–40mg/dL) | 25.1 (17.4–33.8) | 25.5 (18.5–39.5) | 28.3 (20.9–42.6) | ≤ 0.03 |
| Castelli's risk index-I (TC/HDL) | 3.1 (2.7–3.7) | 3.3 (2.8–3.9) | 3.5 (3.0–4.2) | ≤ 0.001 |
| Atherogenic Index (LDL/HDL) | 1.8 (1.5–2.4) | 2.0 (1.9–2.9) | 2.2 (2.0–3.2) | ≤ 0.002 |
| Atherogenic Coefficient (TC-HDL/HDL) | 2.1 (1.7–2.7) | 2.3 (1.9–2.9) | 2.5 (2.0–3.2) | ≤ 0.0009 |
| Surrogate marker of Insulin resistance (TG/HDL) | 3.1 (2.1–4.5) | 3.0 (1.9–4.4) | 3.2 (2.1–4.8) | 0.4 |
Abbreviations: HDL, high-density lipoprotein; IQR, interquartile range; LDL, low-density lipoprotein; TC, total cholesterol; TG, triglycerides; VLDL, very-low-density lipoproteins.
Furthermore, no significant differences between males and females in all study groups for HbA1c test, lipid profile, and AI were observed except for TC, HDLc, and TC-HDL/HDL. In TC, we observed significant differences between males and females in prediabetic (p≤0.04) and diabetic (p≤0.03) groups. HDLc was also found to be significant between males and females in prediabetic (p≤0.03) and diabetic (p≤0.01) groups with respect to the control group, whereas the TC-HDL/HDL ratio showed significant differences between males and females in prediabetic (p≤0.04) and diabetic (p≤0.03) groups in comparison to the control group, as shown in ►Table 3.
| Controls | p-Value | Prediabetes | p-Value | Diabetes | p-Value | ||||
|---|---|---|---|---|---|---|---|---|---|
| M | F | M | F | M | F | ||||
| HbA1C | 5.1±0.4 | 5.1±0.6 | ns | 6.0±0.2 | 6.0±0.2 | ns | 8.4±2.0 | 8.8±2.3 | ns |
| TC | 132.3±37.9 | 136.5±38.0 | 0.2 | 171.4±49.7 | 155.5±44.8 | 0.04a | 169.3±56.9 | 179.0±48.1 | 0.03a |
| TG | 151.4±102.5 | 149.6±104.0 | 0.8 | 159.9±99.4 | 156.4±90.1 | 1.0 | 174.4±107.3 | 172.4±106.4 | 0.5 |
| HDL | 47.6±15.7 | 51.8±17.9 | 0.2 | 50.9±15.9 | 46.1±14.2 | 0.03a | 42.4±16.3 | 44.3±13.9 | 0.01a |
| LDL | 84.5±48.8 | 78.0±32.4 | 0.6 | 102.5±42.4 | 92.3±38.1 | 0.2 | 106.9±52.7 | 109.3±46.9 | 0.3 |
| VLDL | 30.4±20.5 | 29.9±20.7 | 0.8 | 31.9±19.9 | 31.1±17.9 | 0.8 | 36.7±33.1 | 34.2±21.5 | 0.5 |
| TC/HDL | 3.4±0.9 | 3.3±1.0 | 0.6 | 3.5±0.9 | 3.5±0.9 | 1.0 | 3.7±1.0 | 3.7±2.2 | 1.0 |
| LDL/HDL | 2.3±2.6 | 1.8±0.8 | 0.2 | 2.1±0.9 | 2.1±0.8 | 0.8 | 2.3±0.9 | 1.2±1.0 | 0.5 |
| TC-HDL/HDL | 131.3±37.9 | 135.5±38.1 | 0.2 | 154.8±44.8 | 170.4±49.7 | 0.04a | 168.3±56.9 | 178.0±48.1 | 0.03a |
| TG/HDL | 4.5±5.1 | 3.8±3.1 | 0.2 | 3.7±2.4 | 3.5±2.3 | 0.6 | 4.3±4.7 | 3.9±3.1 | 1.0 |
Abbreviations: HDL, high-density lipoprotein; LDL, low-density lipoprotein; SD, standard deviation; TC, total cholesterol; TG, triglycerides; VLDL, very-low-density lipoproteins.
a p < 0.05 is considered as statistically significant.
Lastly, ►Table 4 showed the classification of dyslipidemia between study subjects on the basis of LDLc values as per dyslipidemia guidelines.[9] Significant differences were observed in dyslipidemia between control and prediabetic (Χ2=10.7,1; p≤0.001) groups and control and diabetic (Χ2=15.4,1; p<0.0001) groups. No significant difference was observed between prediabetic and diabetic groups (Χ2=0.2,1; p=0.6).
| LDL:<130mg/dL N (%) | LDL:>130mg/dL N (%) | Χ2 p-Value | Odd ratio (95% CI) | |
|---|---|---|---|---|
| Diabetes | 174 (34.8%) | 67 (13.4%) | 15.4, < 0.0001 | 3.5 (1.8–6.8) |
| Controls | 110 (22%) | 12 (2.4%) | ||
| Pre- diabetes | 102 (20.4%) | 35 (7%) | 10.7, ≤ 0.001 | 3.1 (1.5–6.4) |
| Controls | 110 (22%) | 12 (2.4%) | ||
| Prediabetes | 102 (20.4%) | 35 (7%) | 0.2, 0.6 | 1.1 (0.7–1.8) |
| Diabetes | 174 (34.8%) | 67 (13.4%) |
Abbreviations: CI, confidence interval; LDL, low-density lipoprotein.
Correlation of HbA1c and Lipid Profile
Spearman rank correlation analysis was performed between HbA1c and serum levels of lipid profile (TC, HDL, LDL, TG, VLDL) markers and also with AI (►Fig. 2). A significant positive correlation of HbA1c was observed with TC (r=0.29; p≤0.0001), HDL (r=0.15; p≤0.0006), LDL (r=0.24; p≤0.0001), TG (r=0.15; p≤0.0005), and VLDL (r=0.13; p≤0.0001). Significant positive correlation was observed with AI:TC/HDL (r=0.16; p≤0.0003), LDL/HDL (r=0.16, p≤0.0003), and TC-HDL/HDL (r=0.16, p≤0.0003) (►Fig. 2).
Discussion
DM is a major contributor to various illnesses and death. Improper lifestyle and dietary behavior changes result in higher incidences of diabetes. CVD significantly increases mortality and morbidity in patients suffering from DM. Additionally, dyslipidemia has been identified as an important marker in the development of atherosclerosis and, ultimately, CVD in patients of prediabetes and diabetes. Several factors affect the lipid profile like age, sex, body mass index (BMI), diabetes, etc. As there are no studies to compare lipid profile along with AI in subjects with prediabetes and diabetes in Uttarakhand, we planned to perform the current study.
The mean age of study subjects in present study is almost in coherence with another study by Chakraborty et al.[8] In our study, we found that the diabetic group has significantly higher TC levels compared with prediabetic and control (p<0.0001) groups. Chakraborty et al also showed significantly higher TC levels in the diabetic group than prediabetic and control groups.[8] The plausible explanation to this is that a higher amount of glucose results in increased synthesis of pyruvate and then citrate during the TCA cycle pathway. Citrate then ultimately moves out of mitochondria and forms acetyl-coenzyme (CoA) in the cytosol.[10] This acetyl-CoA, in the case of glucose surplus, ultimately is channeled to cholesterol synthesis. Furthermore, Kansal and Kamble observed significantly higher values of TC (184.75±46.02mg/dL) in the prediabetic study group than in controls (170.99±38.27mg/dL).[11]
In our study, we observed significantly higher TG and VLDL levels in the diabetic group compared with controls (p<0.01). Miyazaki et al revealed raised TG levels in the prediabetic group.[12] This might be due to the reduced activity of hepatic lipase and lipoprotein lipase enzymes involved in the clearance of TG from circulation, later may be due to the decreased activity of insulin. Furthermore, because of excess availability of substrates, there is an increased hepatic synthesis of VLDL and ultimately its levels in the circulation.
Furthermore, we observed significantly higher (p<0.001) LDLc levels in diabetic and prediabetic groups as compared with the control group. Shin et al also observed LDLc to be significantly higher in prediabetics than controls and showed a significant correlation between high blood glucose levels and LDLc levels.[13] Similar correlation was observed at two successive periods in the National Health and Nutrition Examination Survey study.[14] Explanation includes that increased glycemia causes the glycation of apoprotein B lysine residues, thus making it unable to be recognized by an LDL receptor and, hence, decreased catabolism of LDLc.[15,16]
In this study, the control group has significantly higher HDLc compared with prediabetic and diabetic groups. Shin et al also found significantly lower HDLc levels in prediabetic subjects compared with controls subjects.[13] Plausible explanation for decreased levels of serum HDLc is that the action of cholesterol ester transfer protein on increased VLDL leads to the formation of small HDLc, which is easily cleared from the circulation. This leads to reduction in reverse cholesterol transport by HDLc and, hence, aggravates atherosclerosis.[17]
AC is a ratio of atherogenic lipoproteins (VLDL, LDL, IDL, Lpa) with good cholesterol (HDLc). It is an indicator that reflects the atherogenic potential of the whole spectrum of lipoproteins. Non-HDLc has been considered as the second target of therapy after LDLc as per national cholesterol education program adult treatment panel III guidelines especially in individuals with hypertriglyceridemia.[18] In our study, the diabetic group recorded significantly higher AC (p≤0.0009) than the control group, whereas the prediabetic group has higher but insignificant values compared with the control group. Mahat et al in their study on the prediabetic cases in the city of Gwalior, India, found the value to be 4.87±0.87 versus 3.23±0.50 in controls.[19] In our study, diabetic subjects have significantly higher (p≤0.001) CRI-I in comparison to controls. AI in our study was found to be significantly higher in diabetic subjects compared with control and in prediabetic groups, and no significant difference was found compared with the control group. Similarly, Miyazaki et al found no statistically significant differences in AI between prediabetics and controls.[12] In this study, HbA1c was significantly positively correlated with lipid profile (TC, TG, LDLc, HDLc) as well as with AI (CRI-I, AI). High levels of lipid profile and AI are proven risk factors for CVD. This indicates that in our study, prediabetic and diabetic subjects have higher lipid profiles as well as AI compared with control subjects, whereas HDLc was decreased significantly in prediabetics and diabetics. Moreover, as HbA1c levels increased, lipid markers and AI were also found to be increased. This is the first time that the study has been done in Uttarakhand population and interesting results were obtained which are in concordance with the previously published literature. Thus, it implies that altered dietary habits and disrupted lifestyle patterns change the dynamics of relation between HbA1c and lipid indices with minimal bearing on geographical locations.
The limitation of this study is that due to the laboratory-based analysis in the current study, no clinical details of patients were considered which may have impacted generalizability of results. Furthermore, since it was a retrospective analysis, there was non-uniformity in the blood sugar sampling condition; thus, only HbA1c was considered as a determining factor for the diagnosis of patients with both prediabetes and diabetes.
Conclusion
In conclusion, this study confirms that screening and identification of subjects with dyslipidemia in the prediabetes state which precedes long before the occurrence of diabetes might lower their progression to diabetes and ultimately decrease incidences of CVD. Thus, a study in larger patient cohort and pan Indian population might validate the potential of these parameters in the identification of dyslipidemia in subjects of prediabetes in future.
Informed Consent Form
Data were retrieved from electronic laboratory records, so no informed consent form was required in this study.
Acknowledgment
I am thankful to all faculty members and technicians in the department of biochemistry, AIIMS, Rishikesh, India, for their guidance and cooperation for this study.
Conflicts of Interest
None declared.
References
- India State-Level Disease Burden Initiative Diabetes Collaborators. The increasing burden of diabetes and variations among the states of India: the Global Burden of Disease Study 1990-2016. Lancet Glob Health. 2018;6(12):e1352-e1362.
- [Google Scholar]
- ICMR–INDIAB Collaborative Study Group. Prevalence of diabetes and prediabetes (impaired fasting glucose and/or impaired glucose tolerance) in urban and rural India: phase I results of the Indian Council of Medical Research-INdia DIABetes (ICMR-INDIAB) study. Diabetologia. 2011;54(12):3022-3027.
- [CrossRef] [PubMed] [Google Scholar]
- ICMR–INDIAB Collaborative Study Group. Prevalence of diabetes and prediabetes in 15 states of India: results from the ICMR-INDIAB population-based cross-sectional study. Lancet Diabetes Endocrinol. 2017;5(08):585-596.
- [Google Scholar]
- Prediabetes: a high-risk state for diabetes development. Lancet. 2012;379(9833):2279-2290.
- [CrossRef] [PubMed] [Google Scholar]
- The Diabetes Prevention Program (DPP): description of lifestyle intervention. Diabetes Care. 2002;25(12):2165-2171.
- [CrossRef] [PubMed] [Google Scholar]
- Diagnosis and classification of diabetes mellitus. Diabetes care. 2010;33(Supplement_1):S62-S69.
- [CrossRef] [PubMed] [Google Scholar]
- Increasing prevalence of diabetes mellitus in a developing country and its related factors. PLoS One. 2017;12(11):e0187670.
- [CrossRef] [PubMed] [Google Scholar]
- Tracking lipid profile and atherogenic indices in the prediabetics of Andaman Nicobar Islands: a retrospective hospital-based study. J Family Med Prim Care. 2019;8(03):1117-1122.
- [CrossRef] [PubMed] [Google Scholar]
- Major dyslipidemia guidelines and their discrepancies: A need for consensus. American College of Cardiology Accessed August 4, 2020, at: https://www.acc.org/latest-in-cardiology/articles/2018/04/24/08/56/major-dyslipidemia-guidelines-and-their-discrepancies
- [Google Scholar]
- Acetyl-CoA and the regulation of metabolism: mechanisms and consequences. Curr Opin Cell Biol. 2015;33:125-131.
- [CrossRef] [PubMed] [Google Scholar]
- Atherogenic lipids profile relates to postprandial hyperglycemia and hyperinsulinemia due to whole body insulin resistance in prediabetic subjects. J Diabetes Mellitus. 2012;2(03):272-278.
- [CrossRef] [Google Scholar]
- Increased arterial stiffness in healthy subjects with high-normal glucose levels and in subjects with pre-diabetes. Cardiovasc Diabetol. 2011;10(01):30.
- [CrossRef] [PubMed] [Google Scholar]
- Temporal changes in concentrations of lipids and apolipoprotein B among adults with diagnosed and undiagnosed diabetes, prediabetes, and normoglycemia: findings from the National Health and Nutrition Examination Survey 1988-1991 to 2005-2008. Cardiovasc Diabetol. 2013;12(01):26.
- [CrossRef] [PubMed] [Google Scholar]
- Should triglycerides and the triglycerides to high-density lipoprotein cholesterol ratio be used as surrogates for insulin resistance? Metabolism. 2010;59(02):299-304.
- [CrossRef] [PubMed] [Google Scholar]
- Modulation of adrenal aldosterone release by oxidative modification of low-density lipoprotein. Am J Hypertens. 2010;23(10):1061-1068.
- [CrossRef] [PubMed] [Google Scholar]
- Is there a simple way to identify insulin-resistant individuals at increased risk of cardiovascular disease? Am J Cardiol. 2005;96(03):399-404.
- [CrossRef] [PubMed] [Google Scholar]
- Non-high-density lipoprotein cholesterol and guidelines for cholesterol lowering in recent history. Lab Med. 2020;51(01):14-23.
- [CrossRef] [PubMed] [Google Scholar]
- Relationship between atherogenic indices and carotid intima-media thickness in prediabetes: a cross-sectional study from central India. Med Sci (Basel). 2018;6(03):55.
- [CrossRef] [PubMed] [Google Scholar]