
Translate this page into:
Comparison Between Measured and Calculated Free Calcium Values at Different Serum Albumin Concentrations
Address for correspondence: Dr. Arnab Pal, E-mail: pal.arnab@pgimer.edu.in
This is an open access article distributed under the terms of the Creative Commons Attribution NonCommercial ShareAlike 3.0 License, which allows others to remix, tweak, and build upon the work non commercially, as long as the author is credited and the new creations are licensed under the identical terms.
This article was originally published by Medknow Publications & Media Pvt Ltd and was migrated to Scientific Scholar after the change of Publisher.
Abstract
Introduction:
Free ionic calcium is the metabolically active component of total calcium (TCa) in blood. However, most laboratories report TCa levels that are dependent on serum albumin concentration. Hence, several formulae have evolved to calculate free calcium levels from TCa after adjustment for albumin. However, free calcium can directly be measured using direction selective electrodes rather than spectrophotometric methods used in autoanalyzers.
Objectives:
This study compares the levels of free calcium obtained by measurement by direct ion selective electrode (ISE) and the one calculated as a function of TCa by formulae.
Materials and Methods:
A total of 254 serum samples submitted to clinical biochemistry laboratory of a tertiary care hospital were analyzed for total protein, albumin, and TCa by standard spectrophotometric methods and for free calcium by direct ISE. Three commonly used formulae viz. Orrell, Berry et al. and Payne et al. were used to calculate adjusted TCa. Calculated free calcium was obtained by taking 50% of these values.
Results:
A significant difference (P < 0.05) was observed between calculated free calcium by all the three formulae and measured free calcium estimated by direct ISE using paired t-test and Bland–Altman plots.
Conclusion:
Formulae for predicting free calcium by estimating TCa and albumin lacks consistency in prediction and free calcium should be evaluated by direct measurement.
Keywords
Calculated calcium
free calcium
ISE

INTRODUCTION
Calcium is the most abundant mineral of human body with highest content around 98% lying stably in bones in the form of hydroxapatite. The soluble fraction is mainly present in extracellular compartment distributed in serum and interstitial fluid. This soluble fraction exist in the following three forms: (a) Free calcium (FCa) that is the physiologically active form and is responsible for vast array of metabolic and physiological actions, (b) calcium ions bound to albumin, (c) calcium in association with organic anions such as phosphate, bicarbonate, and citrate. Any derangement in total calcium (TCa) levels may have a serious impact on neurological, renal, cardiac, and gastrointestinal functions.[1] However, Moore, Mc-lean and Hastings showed that free calcium (FCa) is the metabolically active form responsible for the biological actions of calcium and thus has key role in calcium homeostasis under both physiological and pathological conditions.[2] As calcium ion bound to albumin and organic anions are subject to variation in their values, there has always been a debate as to whether estimation of TCa or calcium adjusted for albumin (TCa_adj), or free ionised calcium (FCa_meas) measured by direct ISE is a better method and is more suitable in clinical settings.
Most modern day clinical laboratories report TCa levels using ortho-cresolphthalein complexone (oCPC) or Arsenazo III methods measured by autoanalyzers because of higher throughput. However, as TCa is affected by albumin concentrations and other bound anions, without affecting the free ionized calcium levels, there is sufficient evidence in literature suggesting development of algorithms or formulae for adjustment of calcium for different levels of albumin, pH, mass action etc.;[34567] and the free calcium to be calculated as 50% of these values.[8] Subsequently, formulae for directly calculating free calcium based on TCa, protein levels, albumin, and pH, etc., were also derived.[910] However, not much has been studied regarding the validity and agreement of these formulae derived values with directly measured free calcium values in samples with different albumin concentrations.
Taking this into consideration, the present study was planned to look into the utility of commonly used formulae for correctly predicting free calcium at abnormal as well as normal albumin concentrations and to look for agreement between these formulae based calculated free calcium levels and directly measured free calcium levels by ISE.
MATERIALS AND METHODS
Selection of clinical samples
A case controlled observational study was conducted at PGIMER, Chandigarh after required approval from the concerned Institutional Ethical Committee (Ref no. NK/2341/study/4727). Stratified selected serum samples (every 10th samples) submitted to indoor clinical biochemistry laboratory over a period of 2 months were included in the study. Only those samples were included that had pH in reference range and special care was taken to analyze the serum sample on autoanalyzer and ISE analyzer without significant delay. The criteria were then set to subgroup the samples based on albumin levels into three groups, i.e., a group with albumin less than reference range (hypoalbuminemia group), albumin in a reference range of 35–52 g/L (normoalbuminemia group) and albumin above reference range (hyperalbuminemia group).
Analytical methods and quality control
The serum samples were then analyzed for calcium by Ortho–Cresolphthalein Complexone (oCPC) method and albumin by bromocresol green (BCG) dye binding method on modular P-800 autoanalyzer (Roche Diagnostics, Germany) and then the same samples were analyzed for ionized calcium by potentiometry on combiline direct ISE analyzer (Eschweiler products, Germany). Routine quality control check was done by quality control samples provided by Roche on autoanalyzer and those provided by Eschweiler products on direct ISE analyzer. The samples were analyzed only after internal quality check were found to be satisfactory pertaining to patient samples.
The units of TCa assayed on autoanalyzer were then converted from mg/dL to mmol/L using conversion factor of 0.25 and albumin was converted from g/dL to g/L using conversion factor of ten so as to facilitate their use in formulae. The free ionized calcium as measured on direct ISE analyzer was already in units of mmol/L.
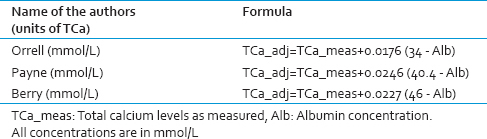
Selection of formulae
The formulae involving clinical samples of patients and involving adjustment of calcium levels based on albumin were selected from literature to obtain adjusted TCa_adj). The formulae by Orrell,[5] Berry et al.[3] and Payne et al.[7] met the aforesaid criteria and thus were included in the study. Table 1 shows these formulae in detail. The calculated free calcium (FCa_calc) was obtained by taking 50% of these values as suggested by Bushinsky and Monk.[8]
Statistical analysis
The data was entered in Microsoft excel™. Paired t-test was performed by Prism v5™ software (Graphpad software, USA) to compare between measured free calcium and calculated free calcium, obtained from the three different formulae as predicted by Orrell, Payne et al. and Berry et al. to calculate the significant difference between respective measured and calculated values. The significance level was taken at P < 0.05.
Bland–Altman plots were plotted to evaluate the level of agreement between measured and calculated values using Prism v5™ software. In this plot, % difference (% bias) between measured value and calculated value by different formulae was plotted versus an average of the values by two methods. The cut-off of mean %bias was taken as of 1.0% for free calcium as provided in “Minimum Specifications from Biological Variation Database” by Westgard.[11]
RESULTS
Measured free calcium and calculated free calcium as obtained by Orrell, Payne and Berry et al. formulae were compared using paired t-test. The mean ± standard deviation of all measured and calculated parameters are summarized in Table 2. It is observed that when all samples are considered together, calculated free calcium obtained by using all three formulae show significant differences from measured free calcium values. (Respective P values and 95% confidence interval are shown in Table 2. When individual subgroups are considered based on their albumin concentrations, a similar picture evolved in patients with hypoalbuminemia. However, in patients with albumin levels within the reference range used by the laboratory (i.e., 35–52 g/L) calculated free calcium obtained using Orrell formula showed no significant difference with measured free calcium by direct ISE. In the hyperalbuminemia group, calculated free calcium obtained using Berry et al. formula did not show significant difference from measured free calcium.
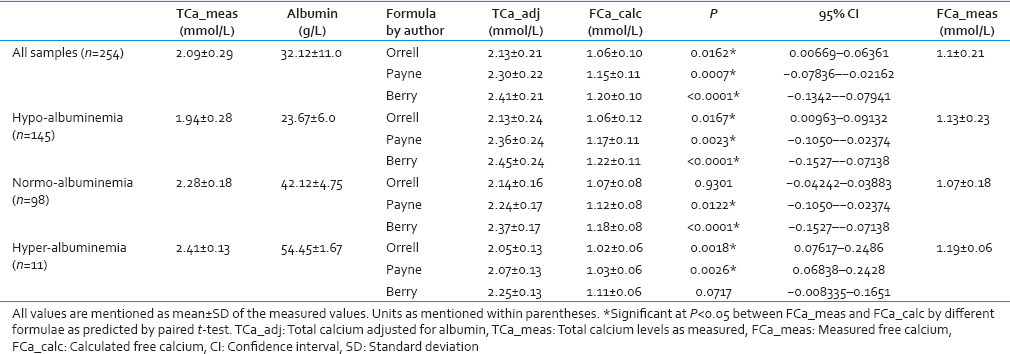
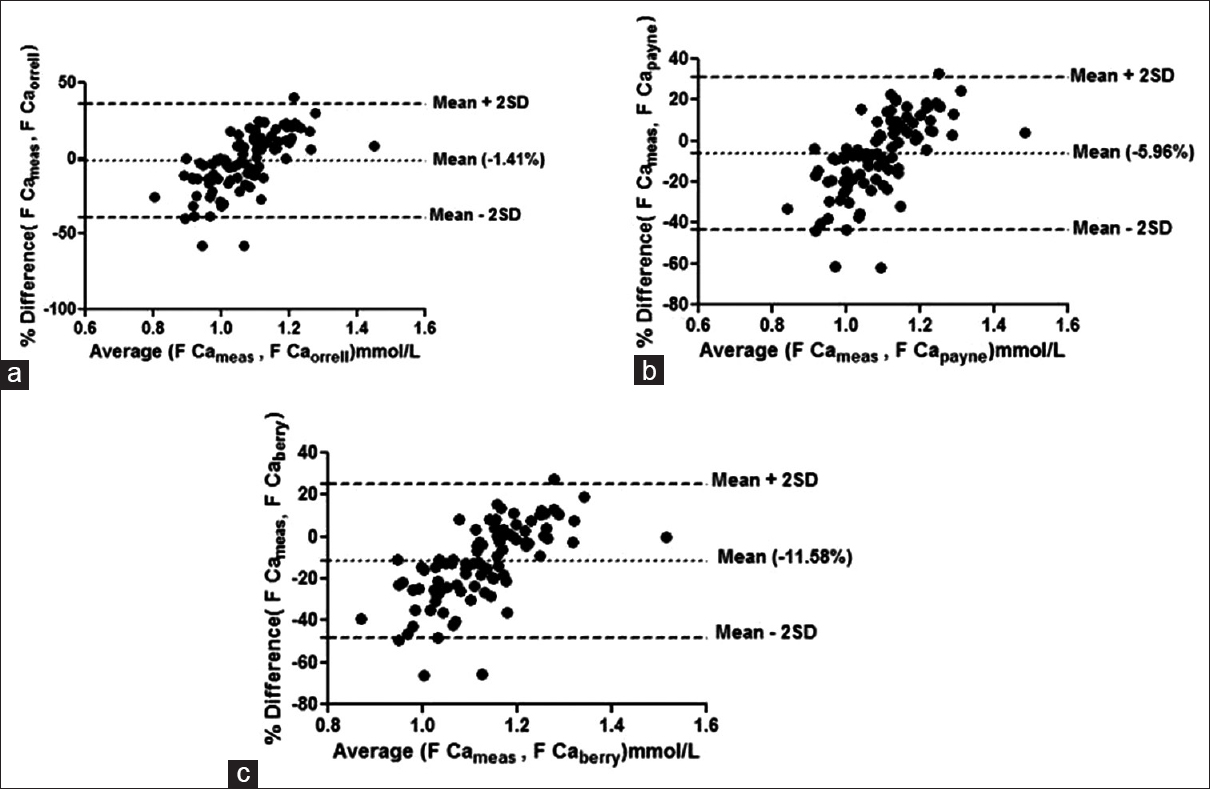
Bland–Altman plots failed to show agreement between any of the group with any of the formulae taking 1.0% bias as the cut-off for free calcium. The mean % bias between measured free calciums and calculated free calcium ranged from –11.58% to +14.67% in the different groups as shown in Figures 1–4.
- Bland–Altman plot for measured free calcium (Fca meas) and calculated free calcium (Fca_calc) by formulae given by (a) Orrell et al. (F Ca orrell), (b) Payne et al. (F Ca payne), (c) Berry et al. (F Ca berry) at the entire range of albumin. Mean % bias between measured and calculated free calcium is shown in parenthesis in respective figures
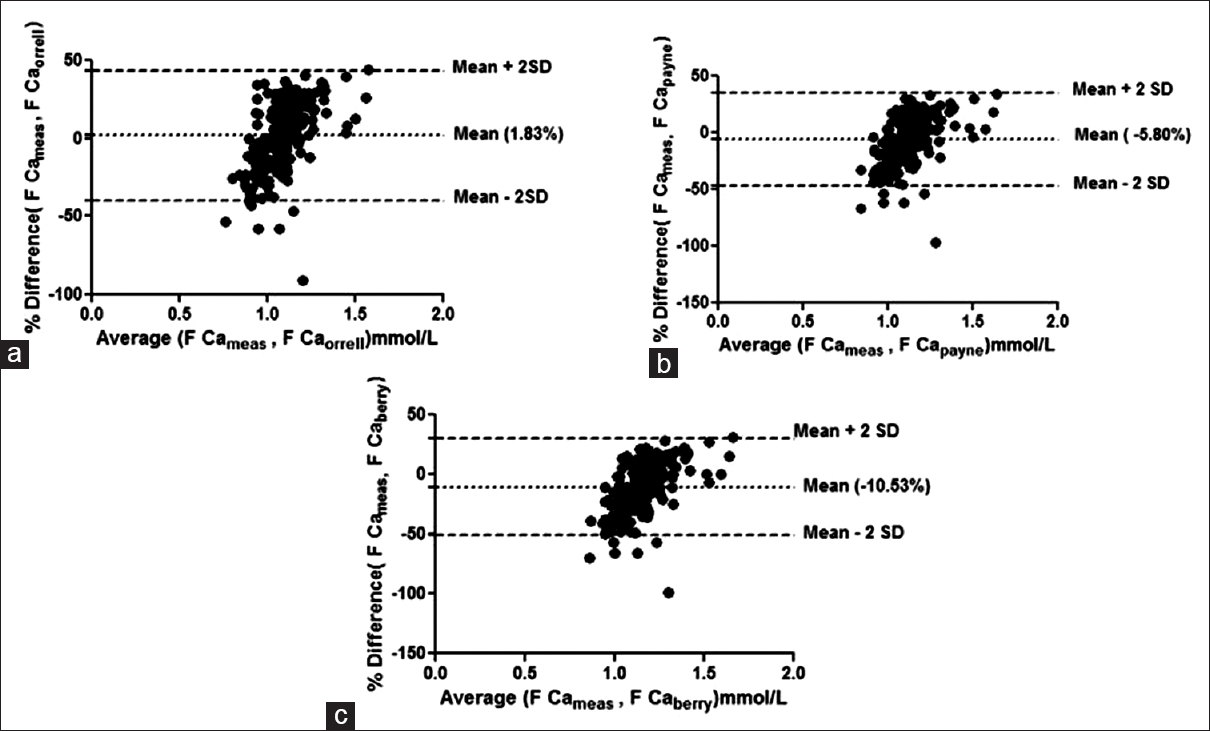
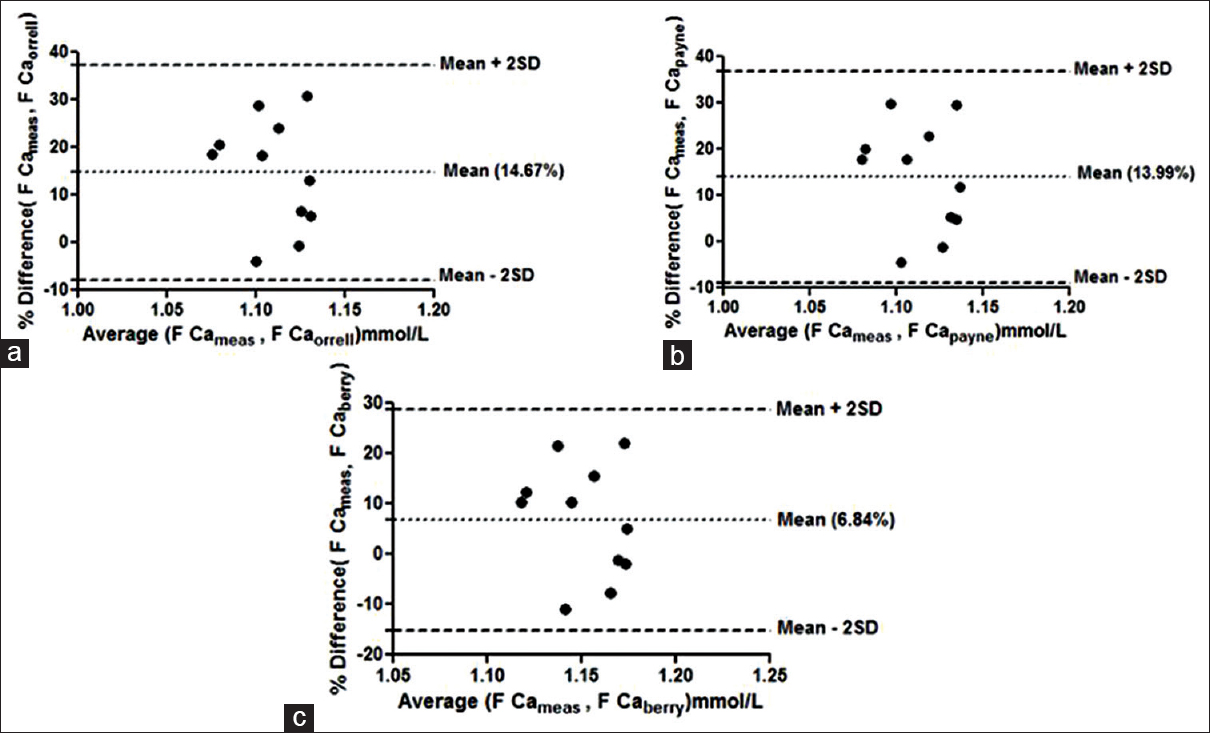
- Bland–Altman plot for measured free calcium (F Ca meas) and calculated free calcium by formulae by (a) Orrell et al. (F Ca orrell), (b) Payne et al. (F Ca payne), (c) Berry et al. (F Ca berry) at low albumin concentrations. Mean % bias between measured and calculated free calciumis shown in parenthesis in respective figures
- Bland–Altman plot for measured free calcium (F Cameas) and calculated free calcium by formulae by (a) Orrell et al. (F Caorrell), (b) Payne et al. (F Capayne), (c) Berry et al. (F Ca berry) at normal albumin concentrations. Mean % bias between measured and calculated free calciumis shown in parenthesis in respective figures
- Bland–Altman plot for measured free calcium (F Cameas) and calculated free calcium by formulae given by by (a) Orrell et al. (F Caorrell), (b) Payne et al. (F Capayne), (c) Berry et al. (F Ca berry) at high albumin concentrations. Mean % bias between measured and calculated free calciumis shown in parenthesis in respective figures
DISCUSSION
Spectrophotometry based measurement of TCa is the most commonly used technique worldwide owing to its ready availability, low cost, and resistance to variable transport and storage conditions. Besides, most modern day large clinical laboratories report TCa levels using oCPC or Arsenazo III methods measured by autoanalyzers because of higher throughput. However, it is now established that free calcium is the metabolically active and relevant fraction of TCa. It is thus very important to understand the need of estimating free ionized calcium for the management of critically ill patients with disorders of calcium metabolism especially in settings of cardiac or renal ailments. This need gave rise to formulae for calculating free calcium from measured TCa after adjustment for important factors such as albumin concentration. The current study was planned to look into the agreement between measured free calcium by direct ISE and calculated free calcium by these formulae at normal and abnormal albumin concentrations.
Our results show that measured free calcium differ significantly from calculated free calcium as obtained by all the three formulae in hypoalbuminemia group (n = 145) and also when all the samples are considered together (n = 254). Bland–Altman plots also failed to show any agreement between measured and calculated free calcium within the acceptable range in any of the groups. Calculated free calcium by Orrell and by Berry et al. however did not reveal significant differences with measured free calcium when used in normoalbuminemia and hyperalbuminemia respectively. However, none of the formula was found appropriate for usage for all values of albumin.
There have been previous reports of nonconformation of calculated free calcium values obtained using albumin-adjusted calcium with measured free calcium;[1213] however they are still being continually used. Moreover, it has also been reported that these formulae do not correlate with directly measured calcium in critically ill patients, chronic kidney disease patients, patients with hyperparathyroidism, acidemia or those receiving transfusion or hemodialyzed patients.[14151617] It is thus very important to understand the need of estimating free calcium for the management of critically ill patients with disorders of calcium metabolism especially in settings of cardiac or renal ailments. Moreover, these formulae have certain inherent drawbacks associated with them like they fail to consider all the factors responsible for affecting the complex calcium equilibria, variation in analytical parameters involved in the respective formulae affects the calculations, and different reference range for same parameters also affects the results. In one such study, determination of albumin by BCG or bromocresol purple method produced significantly different results even after using the same formula.[18]
CONCLUSION
Direct measurement of free calcium by direct ISE seems to be the better alternative despite its cost, low throughput and the necessity to maintain stringent anaerobic conditions while measurement. However, in urgent need, these formulae may be used keeping in mind the limitations and the albumin concentrations. Thus, there is clearly a need for evolving these formulae or these formulae should rather be abandoned for calculating ionized calcium.
Financial support and sponsorship
Nil.
Conflicts of interest
There are no conflicts of interest.
REFERENCES
- Ionized calcium in normal serum, ultrafiltrates, and whole blood determined by ion-exchange electrodes. J Clin Invest. 1970;49:318-34.
- [Google Scholar]
- Variation in plasma calcium with induced changes in plasma specific gravity, total protein, and albumin. Br Med J. 1973;4:640-3.
- [Google Scholar]
- Calculation of plasma ionised calcium from total calcium, proteins and pH: Comparison with measured values. Clin Chim Acta. 1983;127:305-10.
- [Google Scholar]
- Albumin as an aid to the interpretation of serum calcium. Clin Chim Acta. 1971;35:483-9.
- [Google Scholar]
- Interpretation of serum calcium in patients with abnormal serum proteins. Br Med J. 1973;4:643-6.
- [Google Scholar]
- The relation between the ultrafiltrable calcium fraction and blood pH and concentrations of total plasma calcium, albumin, and globulin. Clin Chem. 1998;44:1559-62.
- [Google Scholar]
- Minimum Specifications from Biological Variation Database. Available from: http://www.westgard.com›CLIA&Quality›QualityRequirements
- [Google Scholar]
- Failure of total calcium corrected for protein, albumin, and pH to correctly assess free calcium status. J Clin Endocrinol Metab. 1978;46:986-93.
- [Google Scholar]
- Accuracy of methods to estimate ionized and “corrected” serum calcium concentrations in critically ill multiple trauma patients receiving specialized nutrition support. JPEN J Parenter Enteral Nutr. 2004;28:133-41.
- [Google Scholar]
- Persistent ionized hypocalcemia in patients during resuscitation and recovery phases of body burns. Crit Care Med. 1981;9:454-8.
- [Google Scholar]
- Low plasma ionized calcium and response to calcium therapy in critically ill man. Anesthesiology. 1975;43:300-6.
- [Google Scholar]
- Assessment of calcium homeostasis in the critically ill surgical patient. The diagnostic pitfalls of the McLean-Hastings nomogram. Ann Surg. 1985;202:587-94.
- [Google Scholar]
- A comparison of corrected serum calcium levels to ionized calcium levels among critically ill surgical patients. Am J Surg. 2005;189:310-4.
- [Google Scholar]
- The impact of the assay for measuring albumin on corrected (‘adjusted’) calcium concentrations. Nephrol Dial Transplant. 2009;24:1834-8.
- [Google Scholar]


