
Translate this page into:
Evaluation of lipid profile in systemic lupus erythematosus and relation with interleukin-10
 , Rachita Nanda1,, Seema Shah1, Jhasaketan Meher2, Vinay Rathore3, Suprava Patel1, Eli Mohapatra1
*Corresponding author: Rachita Nanda, Department of Biochemistry, All India Institute of Medical Sciences Raipur, Chhattisgarh, India. dr.rachitananda@gmail.com
-
Received: ,
Accepted: ,
How to cite this article: Verma S, Nanda R, Shah S, Meher J, Rathore V, Patel S, et al. Evaluation of lipid profile in systemic lupus erythematosus and relation with interleukin-10. J Lab Physicians. 2024;16:379-86. doi: 10.25259/JLP-2023-8-13-(1909)
Abstract
Objectives:
To detect pattern of dyslipidemia in patients of SLE and clarify the correlation between lipid profile with disease activity, inflammatory factors, and cytokines.
Materials and Methods:
Blood collected from 65 SLE patients and 30 healthy controls measured Th-17, IL-17, IL-10 by flow cytometer.
Statistical analysis:
The relationship of lipid profile with various parameters was analyzed and stepwise logistic regression was used to assess the predictors of dyslipidemia.
Results:
The unique pattern of dyslipidemia in high disease activity was a significant decline in high density lipoprotein (HDL) and apolipoprotein A1 when compared to low disease activity. IL-10 was the strongest predictor for HDL (CI: -0.31 to -0.20, p=0.000). This is the first time a relation of IL-10 with HDL has been determined in SLE patients.
Conclusions:
IL-10 elevation is associated with decline in HDL. Since IL-10 appears to be a potential modulator of dyslipidemia in SLE, it can serve a new target for lipid metabolism to reduce cardiovascular risk in SLE.
Keywords
Apolipoprotein A1
Cardiovascular disease
High-density lipoprotein
High disease activity
Systemic lupus erythematosus disease activity index (SLEDAI)

INTRODUCTION
Systemic lupus erythematosus (SLE) is a chronic autoimmune disorder in women of childbearing age, associated with the deposition of autoantibodies in various organs such as kidneys, heart, nerves, and skin, resulting in multiorgan injury. In one morbidity and mortality weekly report released in February 2021, the morbidity of Asians with SLE was four times that of the general population.[1] According to the Lupus Foundation of America, the cause of death in SLE has given way from kidney failure to heart attacks and related cardiovascular diseases (CVDs).[2] Mortality due to cardiovascular events in SLE is mostly seen in the later course of the disease.[3] The underlying basis of such events is accelerated atherosclerosis.[3] With CVD being the leading cause of death in Asia in 2019, which was 35% of the total deaths, with 39% of these CVD deaths being premature, the added disease of SLE would indeed aggravate the situation.[4]
Dyslipidemia, an imbalance of lipids such as cholesterol, triglycerides (TG), low-density lipoprotein (LDL), and high-density lipoproteins (HDLs), is associated with adverse cardiovascular outcomes in SLE. Thus, patients of SLE with dyslipidemia have an increased risk of myocardial infarction and CVD mortality and so must be evaluated intermittently. Although LDL is suspected to be contributing to subclinical atherosclerosis in SLE, HDL is suggested to be the new target for reducing the risk of CVD in SLE.[5,6] A recent study found no genetic evidence that lipid traits were significantly associated with SLE risk, suggesting that the chronic inflammation of SLE may play a role in premature dyslipidemia.[7] The associated inflammatory response has been associated with dyslipidemia, although the underlying mechanism has not been understood.[8,9] Certain cytokines associated with SLE pathogenesis have been shown to influence lipoprotein levels. Nevertheless, medications with statin drugs have shown controversial results as they do not influence the cytokines and soluble mediators associated with SLE.[9] In fact, long-term use of statins can result in drug-induced lupus. Therefore, to reduce the risk of CVD in SLE specific immunotherapy has to be provided to these patients for which the specific intermediate molecules and cytokines have to be identified.
Recently studies have put forth multiple diverse roles of interleukin (IL)-10 on lipid profile and in SLE. The anti-inflammatory role of IL-10, protecting against atherosclerosis in acute coronary disease[10] contradicts the poor outcome in acute coronary disease.[11] Evidence of IL-10 released from B-cell has an anti-inflammatory role, inhibiting lupus pathology. However, studies give evidence that IL-10 supports the proliferation and differentiation of autoreactive B-cells to plasma cells, which produces autoantibodies in SLE.[12,13]
Due to the conflicting results regarding the relationship between dyslipidemia and IL-10, this study aimed to examine the lipid pattern in SLE and analyze their association with disease activity, inflammatory factors, and cytokines of SLE.
MATERIALS AND METHODS
Ethical standard
This cross-sectional study was conducted after Institutional Ethics Committee approval, in accordance with the ethical standards of the institution and as per the Declaration of Helsinki of Ethical Principles for Medical Research, following written informed consent from participants.
Study population
Sixty-five diagnosed patients of SLE as per Systemic Lupus International Collaborating Clinics and 30 healthy controls (HCs) with no known autoimmune disease were included in the study.[14] The patients were diagnosed by a physician from the Department of Medicine and Nephrology, who helped in the recruitment of SLE patients. Patients having viral hepatitis, diabetes mellitus Types 1 and 2, thyroid disease, or any other autoimmune disease or, if pregnant, were excluded from the study. Disease activity was assessed and measured clinically as per the total SLEDAI-2K score.[15] Demographic profiles, clinical histories, and laboratory data were documented for all participants as per the case record form. Recent lipid profile data recorded for this study included total cholesterol, TG, HDL, LDL, very LDL (VLDL), and apolipoprotein 1 (ApoA1). SLE cases with SLEDAI-2K scores >6 were categorized as those with high disease activity (HDA) and those below as low disease activity (LDA).[16]
Flowcytometric analysis and cytokine estimation
Blood samples were collected under aseptic techniques in heparinized vacutainers for flowcytometric and enzyme-linked immunosorbent assay (ELISA) analysis. Flow cytometric analysis of T helper (Th) cells 17 and Th-10 cells were done in three lasers, 10 colors Beckman Coulter Navios flow cytometer. The antibody panel used was CD-45, CD-3, CD-4, CCR-6, IL-17, and IL-10 from Invitrogen (Thermofisher, USA). CD 45 is a pan-leucocyte marker used to gate lymphocytes. Another pan T cell marker, CD3, was used for gating the T cell population from lymphocytes. CD3 is vital here because CD4 is being expressed on monocytes and will influence resolution in the case of old samples. From these CD3+ T cells, another subset of CD4+ Th cells is identified by CD3+ CD4+ phenotype. CCR-6 is a characteristic surface chemokine receptor molecule signifying the Th-17 population and is commonly used as a confirmatory marker for the Th-17 population. The CD3+ CD4+ cells were gated onto IL-17 and IL-10 plots. Here, we found heterogeneous expression of Th cells expressing IL-17 alone, IL-17, and IL-10 together, and IL-10 alone and neither IL-17 nor IL-10.
Based on the forward and side scatter properties, the singlet population was separated. Lymphocytes were gated with the help of CD45 and side scatter. The nomenclature of Th-10 was given to the group of cells with a combined expression of CD3, CD4, intracellular IL-17, and IL-10 on peripheral blood lymphocytes. To rule out the non-specific binding of monoclonal antibodies and the effect of autofluorescence, isotype-matched controls were used. Plasma IL-10 and IL-17 were estimated by sandwich ELISA (Human IL-10 ELISA kit and Human IL-17 ELISA kit manufactured by Bioassay Technology Laboratory from Zhejiang, China). IL-10 had a linearity of 5–1500 pg/mL and sensitivity of 2.59 pg/mL whereas IL-17 had a linearity of 2–600 pg/mL and sensitivity of 1.06 pg/mL.
Statistical analysis
All statistical analysis was performed in Jamovi 2.3.26 and IBM Statistical Package for the Social Sciences Statistics 20. Shapiro–Wilk test was used for the test of normality.
Accordingly, an independent t-test or Mann–Whitney U-test was performed for comparison between groups. Categorical data were compared using the Chi-square test. Partial correlation Pearson’s correlations were carried out to express the degree of correlation between the parameters. A linear logistic regression model (step-wise) was used to identify the predictors, followed by a receiver operator characteristics (ROC) curve to check for diagnostic power.
RESULTS
The study enrolled 65 adult SLE patients, recorded their demographics, disease characteristics, hematological, biochemical, and immunological markers, and compared it with the 30 HC. There was no significant difference in age, sex, or body mass index between the two groups. Hemoglobin (Hb) and platelet count were significantly lower in SLE than in controls, whereas erythrocyte sedimentation rate (ESR), C-reactive protein (CRP), urea, and creatinine were significantly elevated. Around 89% of cases were dyslipidemia in comparison to 36% in controls (P < 0.001). The mean duration of SLE was 3.38 years with a SLEDAI score of 8.66 ± 0.99, and 42 out of 65 cases and 32 out of 65 were positive for double-stranded-DNA and had nephritis, respectively. Patients had a significant decline in C3 and C4 (<0.001), and a significant increase in Th-17, IL-17, and IL-10 levels [Table 1].
| Parameter | Healthy controls (n=30) | Cases (n=65) | P-value |
|---|---|---|---|
| Demographics | |||
| Age (years) | 28.1±0.89 | 29.8±1.10 | 0.31 |
| Sex n(%) | |||
| Male | 5 (16.7) | 5 (7.7) | 0.185 |
| Female | 25 (83.3) | 60 (92.3) | |
| BMI (kg/m2) | 23.49±3.65 | 21.83±3.17 | 0.76 |
| Disease characteristics | |||
| Duration of disease (years) | 3.38±0.28 | -- | |
| SLEDAI Score | - | 8.66±0.99 | |
| Nephritis (present: Absent) | - | 32:33 | |
| Clinical features associated with organs | |||
| Renal | - | 16 (24.6%) | |
| Neurologic | - | 20 (30.8%) | |
| Serositis | - | 29 (44.6%) | |
| Hematological markers | |||
| Hb (g%) | 12.60±0.18 | 9.42±0.27 | <0.001 |
| TLC (103/mm3) | 6.30±0.27 | 7.07±0.43 | 0.378 |
| Platelets (103/µL) | 313.93±13.0 | 245.51±11.6 | <0.001 |
| Biochemical markers | |||
| ESR (mm/1st h) | 9.03±0.53 | 68.40±4.73 | <0.001# |
| CRP (mg/dL) | 4.85±0.16 | 16.31±2.4 | 0.021# |
| Urea (mg/dL) | 32.7±0.64 | 41.01±5.31 | 0.008 |
| Creatinine (mg/dL) | 0.73±0.02 | 1.21±0.14 | 0.022 |
| Lipid profile no (%) | |||
| Normal blood lipids | 19 (63.7) | 7 (10.8) | <0.001 |
| Dyslipidemia | 11 (36.7) | 58 (89.2) | |
| Immunological markers | |||
| C3 (mg/dL) | 128.0±1.59 | 55.1±3.29 | <0.001# |
| C4 (mg/dL) | 31.50±0.68 | 11.18±1.10 | <0.001# |
| Anti-dsDNA (positive: Negative) | - | 42:23 | |
| Th-17 (cells/µL) | 1.55±0.25 | 2.06±0.14 | 0.014 |
| Th-10 (cells/µL) | 1.21±0.10 | 2.22±0.26 | 0.323# |
| IL-17 (pg/mL) | 71.43±2.28 | 271.17±14.9 | <0.001# |
| IL-10 (pg/mL) | 402.39±60.15 | 740.07±32.55 | <0.001 |
Values in mean±standard error mean, #Mann–Whitney U. BMI: Body mass index, IL: Interleukin, Hb: Hemoglobin, CRP: C-reactive protein, TLC: Total leukocyte count, ESR: Erythrocyte sedimentation rate, ds-DNA: Double-stranded DNA, Th: T helper, SLEDAI: Systemic lupus erythematosus disease activity index.
Based on the disease activity index, SLE patients were categorized into HDA (n = 26) and LDA (n = 39). The clinical manifestations associated with organs (renal, neurologic, and serositis) in SLE patients with LDA and HDA are shown in Supplementary Figure 1.
A comparison of disease characteristics in LDA and HDA showed that both groups had similar disease duration, and as expected, HDA had a higher SLEDAI score at 16.70 compared to 3.33 in LDA. The Hb (P = 0.070), total leukocyte counts (P = 0.043), and platelets (P = 0.027) were low in HDA as part of the disease process. The inflammatory process was elevated in the HDA category, as evidenced by a rise in ESR and CRP compared to LDA patients. Although C4 was significantly lower (P = 0.035) in HDA, the C3 values were similar (P = 0.464). Similarly, urea (P = 0.039) and creatinine (0.011) were raised considerably in the HDA, indicating that more patients with renal involvement were seen in the HDA group. Further, the study found significantly higher levels of IL-17 and IL-10 in the HDA group compared with the reported values in the LDA group [Table 2].
| Parameter | LAD (n=39) | HDA (n=26) | P-value |
|---|---|---|---|
| Disease characteristics | |||
| Duration of disease (years) |
3.54±0.32 | 3.15±0.51 | 0.507 |
| SLEDAI score | 3.33±0.32 | 16.70±1.37 | <0.001 |
| Hematological markers | |||
| Hb (g%) | 9.83±0.31 | 8.81±0.47 | 0.070 |
| TLC (103/mm3) | 7.78±0.56 | 6.0±0.63 | 0.043 |
| Platelets (103/µL) | 266±13.2 | 215±19.8 | 0.027 |
| Biochemical markers | |||
| ESR (mm/1st h) | 62.8±6.31 | 76.6±6.96 | 0.156 |
| CRP (mg/dL) | 12.7±2.78 | 21.7±4.2 | 0.067 |
| Urea (mg/dL) | 32.1±4.64 | 54.4±10.9 | 0.039 |
| Creatinine (mg/dL) | 0.92±0.08 | 1.65±0.31 | 0.011 |
| Immunological markers | |||
| C3 (mg/dL) | 53.1±4.50 | 58.1±4.74 | 0.464 |
| C4 (mg/dL) | 12.9±1.49 | 8.57±1.02 | 0.035 |
| Th-17 (cells/µL) | 2.05±0.18 | 2.08±0.21 | 0.825 |
| Th-10 (cells/µL) | 2.62±0.36 | 1.61±0.32 | 0.055# |
| IL-17 (pg/mL) | 224±17.8 | 311±25.1 | 0.009# |
| IL-10 (pg/mL) | 308±20.5 | 973±26.9 | <0.001 |
Values in mean±standard error mean, #(Mann–Whitney U). LDA: Low disease activity, HDA: High disease activity, IL: Interleukin, Hb: Hemoglobin, CRP: C-reactive protein, Th: T helper, TLC: Total leukocyte count, ESR: Erythrocyte sedimentation rate, SLEDAI: Systemic lupus erythematosus disease activity index.
The blood lipid profile depicted by violin plots (with mean) shows a significant lowering of HDL (26.04 ± 1.26 vs. 45.31 ± 1.16) and ApoA1 (45.58 ± 1.36 vs. 73.97 ± 2.32) in HDA (P < 0.001) with no significant increase in total cholesterol (203.92 ± 13.41 vs. 194.66 ± 9.61), TG (218.85 ± 20.72 vs. 181.08 ± 8.85), LDL (136.35 ± 9.59 vs. 125.95 ± 7.13), and non-HDL (171.85 ± 12.28 vs. 159.85 ± 8.56) when compared to LDA [Supplementary Figure 2].
The SLE patients were categorized into those with (n = 32) and without nephritis (n = 33), where 14 of the lupus nephritis patients were in the HDA category, and 18 lupus nephritis were from the LDA category. A comparison of the lipid profile revealed no significant change in any of the parameters [Supplementary Table 1].
A scale reliability analysis computed the McDonald’s w to be 0.667, indicating an acceptable reliability level [Supplementary Table 2]. The correlation heatmap shows the SLEDAI score to be significantly correlated with HDL (r = −0.636, P ≤ 0.001), log ApoA1 (r = −0.558, P < 0.001), IL-10 (r = 0.795, P ≤ 0.001), and log IL-17 (r = 0.291, P = 0.019). The other relevant correlation includes a significant negative correlation of HDL to IL-10 (r = −0.754, P < 0.001) and log IL-17 (r = −0.247, P = 0.047) and a similar negative correlation of ApoA1 to IL-10 (r = −0.662, P < 0.001) and log IL-17 (r = −0.258, P = 0.038) [Figure 1].
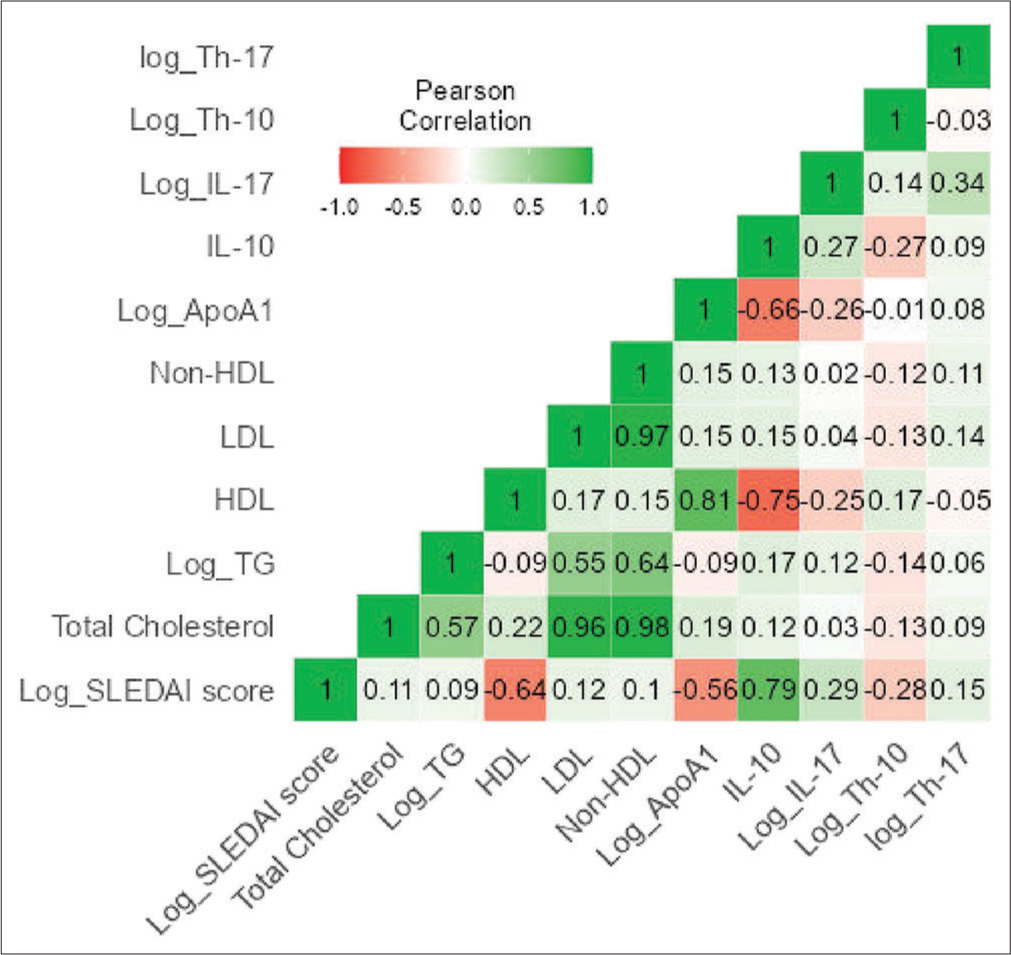
- Correlation heat map of lipid profile and immunological markers for disease activity. HDL: High density lipoprotein, LDL: Low density lipoprotein, Log_TG: logarithimic value of Triglyceride, SLEDAI: Systemic lupus erythematosus disease activity index, Log_IL: Logarithimic value of interleukin, Log_Th: Logarithimic value of T-helper cells, Log_ApoA1: Logarithimic value of Apoprotein A1.
Using linear regression, models were developed to explore the sequential relationship between HDL, IL-10, IL-17, and ApoA1 to the disease severity. HDL alone was responsible for 38% of the effect, and subsequently, the inclusion of IL-10, IL-17, and ApoA1 was responsible for 57.7%, 58.2%, and 57.5% of the severity of SLE. The model fit measures were significant for all inclusions; however, when comparing the different models, IL-10 along with HDL had a substantial effect on disease severity (ΔR2 = 0.2002, F = 30.28, P < 0.001) [Supplementary Table 3].
A combined ROC curve with predictive measures shows the accuracy (70.8%), specificity (76.8%), and sensitivity (61.5%). Thus, the combined detection of HDL, IL-10, IL-17, and ApoA1 had a higher capacity for discrimination than individual measurements with an area under the curve (AUC) of 0.831 [Figure 2].
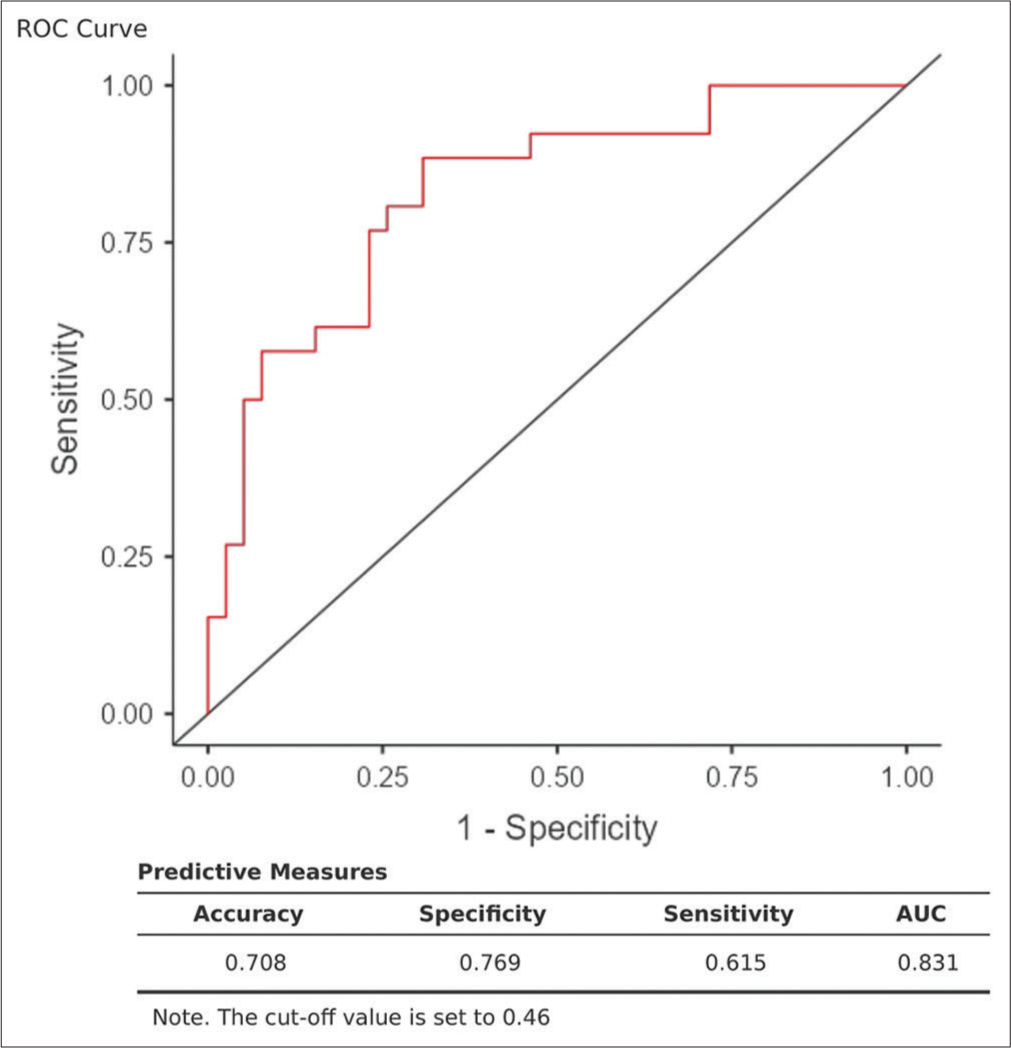
- Combined receiver operator characteristic curve with predictive measures (accuracy, specificity, sensitivity, and area under curve). ROC: Receiver operating characteristic, AUC: Area under the Curve.
The strongest predictors of HDL in SLE patients were identified using stepwise regression using various predictors such as IL-10, IL-17, Th-10, Th-17, duration of disease, nephritis, prednisolone usage, and hydroxychloroquine. IL-10 was found to be the strongest predictor (R2 = 0.568, adjusted R2 = 0.561, SE of estimate = 7.780, P = 0.000) [Table 3]. The residual scatter plot shows the scatter plot to be rectangular, where all scores are randomly scattered about the horizontal line, indicating that the linear regression model is appropriate [Supplementary Figure 3].
| ANOVAa | |||||||||||
| Model | Sum of Squares | df | Mean square | F | Sig. | ||||||
| 1 | Regression | 5020.082 | 1 | 5020.082 | 82.933 | 0.000b | |||||
| Residual | 3813.518 | 63 | 60.532 | ||||||||
| Total | 8833.600 | 64 | |||||||||
| aDependent Variable: HDL. bPredictors: (Constant), IL-10 | |||||||||||
| Coefficientsa | |||||||||||
| Model | Unstandardized Coefficients | Standardized Coefficients | t | Sig. | 95.0% confidence interval for B | Correlations | |||||
| B | Std. Error | Beta | Lower Bound | Upper Bound | Zero-order | Partial | Part | ||||
| 1 | (Constant) | 51.998 | 1.852 | 28.073 | 0.000 | 48.296 | 55.699 | ||||
| IL-10 | −0.025 | 0.003 | −0.754 | −9.107 | 0.000 | −0.031 | −0.020 | −0.754 | −0.754 | −0.754 | |
| aDependent Variable: HDL | |||||||||||
ANOVA: Analysis of variance, HDL: High-density lipoprotein, IL: Interleukin, df: Degree of freedom. In a multiple regression analysis “a” indicates the dependent variable and “b” indicates the predictor variable. F: It is a measure of the ratio of the variances, Sig: Significance, B: Regression coefficients for the standardized data.
DISCUSSION
The premature cardiovascular event in SLE is supposedly due to the dyslipidemia seen in SLE. Apart from the known risk factors responsible for such a condition, in SLE, an additional burden of immune cell activation, the severity of the disease, impaired renal function, use of drugs for treatment, and the presence of antiphospholipid antibodies are other risk factors.[17] There is still much debate about the reasons behind dyslipidemia in SLE. Therefore, to understand the characteristics of lipid profile and their relationship to disease severity, inflammatory factors, and cytokines of SLE, the study recruited patients of SLE and HC.
Compared to HC, lipid profile, inflammatory biomarkers, and cytokines in SLE were altered. The dyslipidemia observed was a raised cholesterol (P = 0.810), TG (P < 0.001), LDL (P < 0.001), non-HDL (P = 0.054), and diminished HDL level (P < 0.001) and ApoA1 (P < 0.001). In SLE, the lupus pattern dyslipidemia differs in active and inactive lupus patients.[9] There is a rise in VLDL and TG with a decrease in HDL in the inactive patients, whereas active lupus patients had a marked increase in VLDL and TG and a decrease in HDL and LDL patterns. In our study, the patients categorized as HDA showed a marked significant decline in HDL and ApoA1, with elevation in the other pro-atherogenic lipid variables compared to LDA, indicating that disease activity and dyslipidemia are closely related. Low HDL is a very common dyslipidemia in lupus, and it is suggested that lupus HDL is a dysfunctional molecule that activates the nuclear factor kappa-B pathway to promote a pro-inflammatory state and lacks the antioxidative cardioprotective capacity.[18] In many studies, nephritis is closely associated with dyslipidemia.[8,19] In our study, there were 32 patients with nephritis and 33 patients without nephritis; however, there was no significant change in lipid parameters between the groups. This could be because of a similar disease duration and also because the patients with nephritis were almost equally distributed in HDA and LDA groups.
In SLE, the aggravated immune mechanism is the cornerstone for the involvement of various organs and premature atherosclerosis. To understand the action of the inflammatory process on dyslipidemia, we measured the inflammatory mediators IL-17, IL-10, Th-17, and Th-10. The study found significant IL-17 and IL-10 elevation in the HDA group when compared with the LDA group but not the Th-17 or Th-10 cells. As known, an imbalance of Th-17/Treg is credited with organ inflammation and damage in SLE patients. Either the circulating Th-17 cells or IL-17 concentration appears to correlate positively with disease activity.[20] IL-17 is a pro-inflammatory cytokine, which is not only produced by CD4+Th-17 cells but also by CD8+lymphocytes and gq T cells, as well as natural killer T cells.[21] This probably explains the elevated IL-17 in our sample population, with no significant change in Th-17 cells. Once IL-17 rises over time, it recruits immune cells such as neutrophils and T-cells, and later activates them to target organs, stepping up the immune response to a large scale.[22]
IL-10, a pleiotropic cytokine, exhibits opposing roles in SLE, serving both as a suppressor of inflammatory functions and driving the extrafollicular autoantibody B cell response.[23] Abnormally low levels of IL-10 are commonly seen in autoimmune disorders such as SLE. This study is one of the first to highlight the involvement of IL-10 with dyslipidemia in SLE which would mark the pathway in dyslipidemia that could be targeted. In our study, the significant increase in IL-10 in SLE patients when compared to HC and a similar change in SLE with HDA compared to LDA indicated IL-10 to be closely associated with the disease process. A significant negative correlation of SLEDAI score with HDL, ApoA1, and a significant positive correlation with IL-10 and IL-17 is in the continuum with the previous researchers.[19,21,24-26]
On correlation analysis, HDL and ApoA1 were also significantly and negatively associated with IL-10 and IL-17, indicating that the HDL and ApoA1 reduced as the cytokines increased. Thus, there could be a potential link between inflammation and lipid metabolism. HDL, along with apoprotein ApoA1, is responsible for reverse cholesterol transport and inhibits endothelial cells adhesion.[27] Hence, if HDL is lowered, it can indirectly cause increased inflammation. A linear logistic regression (step-wise) identified that HDL and IL-10 (Model-2 of predictor variables) were the best combination for the outcome (SLEDAI Score). Nevertheless, the ROC curve obtained by combining HDL, IL-10, IL-17, and ApoA1 gave a specificity and specificity of 76.9% and 61.5%, respectively, with an AUC of 83.1%. Other researchers also observed a positive correlation of IL-10 with the disease activity index in SLE.[24,28] As suggested, excessive production of IL-10 was responsible for autoantibody production and formation of autoantibody antigen complex in the disease progression stage.[24]
In the multiple linear regression model using the step-wise selection method, the b-coefficient for the relationship between changes in IL-10 and HDL was −0.025 (confidence interval: −0.031–−0.020, P = 0.0001). A study on autoimmune lymphoproliferative syndrome has recently suggested that high circulating IL-10 might be a cause of dyslipidemia causing severe HDL deficiency.[29] In a clinical trial where recombinant IL-10 was administered in psoriatic arthritis patients, there was a decrease in HDL levels. While the exact mechanism by which IL-10 modulates lipoprotein metabolism is unclear, there is a possibility that increased IL-10 decreases the synthesis and secretion of ApoA1 thereby reducing HDL levels.[29] Another potential explanation is elevated catabolism of HDL in response to high IL-10 levels.[29] There was a positive correlation of ApoA1 with HDL in our recruited patients. Although not in SLE, serum IL-10 is negatively correlated with HDL levels in obese patients, making it responsible for cardiovascular risk.[30] Therefore, elevated IL-10 levels could contribute to the reduction in HDL and potentially be a factor in the accelerated cardiovascular events in SLE.
It is known that HDL values <40 mg/dL are a risk factor for coronary artery disease.[31] In our patients, the mean HDL level in SLE with HDA and SLE with LDA was 26.04 ± 1.26 and 45.31 ± 1.16, respectively. The degree of inflammation in SLE with HDA is higher compared to the LDA group. Studies suggest a potential link between inflammation and dyslipidemia, leading to a marked decline in HDL and ApoA1 levels in the HDA group. This renders the HDA group more susceptible to cardiovascular events, emphasizing the importance of targeting lipid metabolism to reduce immunometabolic complications.
The limitation of this study is the cross-sectional nature of the study design, which precludes the identification of causality. An experimental study would also enable the identification of the effect of IL-10 on specific lipoproteins such as HDL, as well as the various apoproteins and enzymes associated with HDL. Given the heterogeneous nature of SLE, a longitudinal follow-up study from diagnosis could help identify causality. A prospective study would determine the time to develop dyslipidemia and changes associated with different stages of SLE. Further clinical trials targeting IL-10 receptors to reduce its level or trials to increase HDL and ApoA1 levels and thus checking their effects on outcomes will probably answer our questions. Since IL-10 is a pleiotropic molecule and ApoA1 also has roles in the immune system, the role of IL-10 on ApoA1 functioning needs to be studied.
CONCLUSIONS
Based on the results of this study, the dyslipidemia pattern observed was a marked decline in HDL and ApoA1 levels. HDL and IL-10 predicted the patients of HDA with high SLEDAI scores. In addition, IL-10 was also the strongest predictor for HDL levels. Very few studies target HDL, ApoA1, and IL-10 levels in SLE, but causality studies are required to identify the target point to manage premature cardiovascular events in SLE.
Acknowledgment
The authors are grateful to all participants in this study.
Ethical approval
The research/study was approved by the Institutional Review Board at Ethics Committee-AIIMS Raipur, number AIIMSRPR/IEC/2020/515, dated 11.05.2020.
Declaration of patient consent
The authors certify that they have obtained all appropriate patient consent.
Conflicts of interest
There are no conflicts of interest.
Use of artificial intelligence (AI)-assisted technology for manuscript preparation
The authors confirm that there was no use of artificial intelligence (AI)-assisted technology for assisting in the writing or editing of the manuscript and no images were manipulated using AI.
Financial support and sponsorship
Nil.
References
- The leading cause of death. Available from: https://www.lupus.org/resources/the-leading-causes-of-death-in-lupus [Last accessed on 2023 Jun 06]
- [Google Scholar]
- National Resource Centre on lupus. Available from: https://www.lupus.org/resources/the-leading-causes-of-death-inlupus(internet) [Last accessed on 2023 Jun 06]
- [Google Scholar]
- Mortality in a cohort of Egyptian systemic lupus erythematosus patients: Retrospective two-center study. Egypt Rheumatol Rehabil. 2021;48:14.
- [CrossRef] [Google Scholar]
- Global burden of disease study 2019 (GBD 2019) results. 2020. Seattle, WA: Institute for Health Metrics and Evaluation (IHME); Available from: https://ghdx.healthdata.org/gbd-results-tool [Last accessed on 2023 Oct 09]
- [Google Scholar]
- Impaired serum cholesterol efflux capacity in rheumatoid arthritis and systemic lupus erythematosus. Ann Rheum Dis. 2014;73:609-15.
- [CrossRef] [PubMed] [Google Scholar]
- Neutrophil extracellular trap-derived enzymes oxidize high-density lipoprotein: An additional proatherogenic mechanism in systemic lupus erythematosus. Arthritis Rheumatol. 2014;66:2532-44.
- [CrossRef] [PubMed] [Google Scholar]
- The causal relationship between blood lipids and systemic lupus erythematosus risk: A bidirectional two-sample mendelian randomization study. Front Genet. 2022;13:858653.
- [CrossRef] [PubMed] [Google Scholar]
- Dyslipidemia is associated with inflammation and organ involvement in systemic lupus erythematosus. Clin Rheumatol. 2023;42:1565-72.
- [CrossRef] [PubMed] [Google Scholar]
- Dyslipidemia in systemic lupus erythematosus. Immunol Res. 2017;65:543-50.
- [CrossRef] [PubMed] [Google Scholar]
- Serum level of the anti-inflammatory cytokine interleukin-10 is an important prognostic determinant in patients with acute coronary syndromes. Circulation. 2003;107:2109-14.
- [CrossRef] [PubMed] [Google Scholar]
- Raised interleukin-10 is an indicator of poor outcome and enhanced systemic inflammation in patients with acute coronary syndrome. Heart. 2008;94:724-9.
- [CrossRef] [PubMed] [Google Scholar]
- B cell-derived IL-10 suppresses inflammatory disease in Lyn-deficient mice. Proc Natl Acad Sci USA. 2011;108:E823-32.
- [CrossRef] [PubMed] [Google Scholar]
- Evidence for a pathogenic role of extrafollicular, IL-10-producing CCR6+B helper T cells in systemic lupus erythematosus. Proc Natl Acad Sci USA. 2020;117:7305-16.
- [CrossRef] [PubMed] [Google Scholar]
- Derivation and validation of the systemic lupus international collaborating clinics classification criteria for systemic lupus erythematosus. Arthritis Rheum. 2012;64:2677-86.
- [CrossRef] [PubMed] [Google Scholar]
- Systemic lupus erythematosus disease activity index 2000. J Rheumatol. 2002;29:288-91.
- [Google Scholar]
- Measures of adult systemic lupus erythematosus: Disease activity and damage. Arthritis Care Res (Hoboken). 2020;72(Suppl 10):27-46.
- [CrossRef] [PubMed] [Google Scholar]
- Shotgun lipidomics revealed altered profiles of serum lipids in systemic lupus erythematosus closely associated with disease activity. Biomolecules. 2018;8:105.
- [CrossRef] [PubMed] [Google Scholar]
- Lipid metabolism: Immune regulation and therapeutic prospectives in systemic lupus erythematosus. Front Immunol. 2022;13:860586.
- [CrossRef] [PubMed] [Google Scholar]
- Dyslipidemia in patients with lupus nephritis. Nephrology. 2011;16:511-7.
- [CrossRef] [PubMed] [Google Scholar]
- The role of IL-17 in systemic lupus erythematosus and its potential as a therapeutic target. Expert Rev Clin Immunol. 2019;15:629-37.
- [CrossRef] [PubMed] [Google Scholar]
- IL-17 in systemic lupus erythematosus. J Biomed Biotechnol. 2010;2010:943254.
- [CrossRef] [PubMed] [Google Scholar]
- IL-10 revisited in systemic lupus erythematosus. Front Immunol. 2022;13:970906.
- [CrossRef] [PubMed] [Google Scholar]
- Serum interleukin-18 and interleukin-10 levels in systemic lupus erythematosus: Correlation with SLEDAI score and disease activity parameters. Egypt Rheumatol Rehabil. 2014;41:160-6.
- [CrossRef] [Google Scholar]
- Dysregulated serum lipid profile and its correlation to disease activity in young female adults diagnosed with systemic lupus erythematosus: A cross-sectional study. Lipids Health Dis. 2020;19:40.
- [CrossRef] [PubMed] [Google Scholar]
- Changes of serum IL-6, IL-17, and complements in systemic lupus erythematosus patients. J Interferon Cytokine Res. 2019;39:410-5.
- [CrossRef] [PubMed] [Google Scholar]
- Association between abnormal lipid levels and systemic lupus erythematosus. Rheum Res. 2021;6:81-6.
- [CrossRef] [Google Scholar]
- Cytokine IL-6 and IL-10 as biomarkers in systemic lupus erythematosus. J Clin Immunol. 2007;27:461-6.
- [CrossRef] [PubMed] [Google Scholar]
- Elevated interleukin-10: A new cause of dyslipidemia leading to severe HDL deficiency. J Clin Lipidol. 2015;9:81-90.
- [CrossRef] [PubMed] [Google Scholar]
- Correlation between serum lipid parameters and interleukin-10 concentration in obese individuals. J Obes Metab Syndr. 2021;30:173-7.
- [CrossRef] [PubMed] [Google Scholar]
- High-density lipoproteins: A consensus statement from the National Lipid Association. J Clin Lipidol. 2013;7:484-525.
- [CrossRef] [PubMed] [Google Scholar]


