
Translate this page into:
Experience of rigorous practice of antimicrobial stewardship program and its impact on antibiotic consumption
 , Sagar Khadanga1, Rehan Ul Haq2, Pradeep Saxena3, Ananyan Sampath1, Karuna Tadepalli4,
*Corresponding author: Karuna Tadepalli, Additional Professor, Department of Microbiology, All India Institute of Medical Sciences, Bhopal, Madhya Pradesh, India. karunatadepallimyco@gmail.com
-
Received: ,
Accepted: ,
How to cite this article: Kumar S, Khadanga S, Haq RU, Saxena P, Sampath A, Tadepalli K. Experience of rigorous practice of antimicrobial stewardship program and its impact on antibiotic consumption. J Lab Physicians. 2024;16:320-7. doi: 10.25259/JLP_17_2024
Abstract
Objectives:
Antimicrobial resistance (AMR) is the next pandemic with a huge global economic burden. A customized antimicrobial stewardship program (AMSP) is a well-recognized tool for containment of AMR. The current study was undertaken to identify the impact of AMSP measures on the trends of antibiotic consumption rates, e.g., defined daily dose (DDD) and days of therapy (DOT) per 100 patient days in pre-identified areas of the hospital.
Materials and Methods:
The present study was a case-record-based extended cross-sectional study carried out in a tertiary care institute in central India from January 2021 to September 2021. Time-bound feasible sampling was undertaken, and all cases were included without any exclusion criteria. The study was approved by the Ethics Committee of the Institute and funded by the Indian Council of Medical Research (ICMR).
Statistical Analysis:
The data was entered into a spreadsheet. The calculation of DDD and DOT was performed individually for each antibiotic as per WHO tool per 100 patient days.
Results:
In high-priority areas such as intensive care unit and high dependency unit, the top three DDD/100 days were meropenem (77.9), colistin (41.4), and piperacillin-tazobactam (13.5) versus the top 3 DOT/100 patient days were meropenem (40.5), colistin (20.9), and piperacillin-tazobactam (15.7). In low-priority areas such as general wards, the top 3 DDD/100 patient days were meropenem (45.4), piperacillin-tazobactam (22.6), and cefoperazone (5.0) versus the top three DOT/100 patient days were meropenem (45.4), cefoperazone (44.9), and piperacillintazobactam (22.6). There was a downward trend of consumption of almost all these antibiotics when measured at baseline and the next two quarters. DDD and DOT per 100 patient days had a positive linear correlation during the study period.
Conclusions:
The present study demonstrates about 50% reduction in consumption of ICMR priority antibiotics with a yearlong AMSP. DDD and DOT per 100 patient days can be calculated with minimal effort, even in extremely busy hospitals. DOT tools are less labor-intensive and, hence, should be the pivotal tool for antibiotic exposure measurement.
Keywords
Antibiotic consumption
Antimicrobial resistance
Antimicrobial stewardship program
Defined daily dose
Days of therapy

INTRODUCTION
Antimicrobial resistance (AMR) has emerged as a global public health and development threat. The urgency of addressing AMR demands immediate collaborative efforts across various sectors to achieve the objectives outlined in the Sustainable Development Goals 2023 by the United Nations.[1] According to the Institute for Health Metrics and Evaluation, drug-resistant illnesses were directly responsible for 1.27 million fatalities in 2019, with most of the fatalities from sub-Saharan Africa and South Asia.[2] Even under optimistic scenarios, AMR could lead to an annual decline in the economy, amounting to 1.1% of global gross domestic product by the year 2050. However, this is projected to escalate up to 3.8% annually if decisive measures are not taken.[2]
Antimicrobial stewardship program (AMSP) is a healthcare strategy that has been advocated as the most efficient process indicator for tackling AMR in an organization or state. Many low- and middle-income countries are in the process of developing and implementing various forms of AMSP for curtailment of AMR. The success of AMSP is based on the judicious use of antimicrobials through evidence-based interventions.[3-5] Multiple studies have demonstrated the positive impact of AMSP in monitoring AMR and its subsequent curtailment.[6,7] Monitoring quantitative antibiotic consumption is one of the core components of ASMP. It facilitates comparison over the time frame within a healthcare facility in larger districts or even countries. Commonly used metrics are the defined daily dose (DDD) index and days of therapy (DOT). The anatomical therapeutic chemical/DDD (ATC/DDD) index is developed and maintained by the World Health Organization (WHO). ATC/DDD is a standardized method for evaluating in-hospital antibiotic use. It categorizes drugs, including antibiotics, based on their therapeutic or chemical properties and defines a standardized DDD for each drug. The WHO Collaborating Centre for Drug Statistics Methodology updates and maintains this index, making it a valuable tool for monitoring drug utilization trends, promoting responsible antibiotic use, and addressing antibiotic resistance.[8] DDD represents the quantity of drug a typical patient might receive on any given day for therapeutic purposes. Another approach to evaluating antibiotic usage involves directly measuring the number of DOT. This encompasses summing up the total days of exposure to antibiotics. DDD metrics provide insights into the average quantity of antimicrobials consumed. DOT, on the other hand, offers greater clinical relevance for healthcare providers. DOT may be calculated from various sources, such as dispensing from the pharmacy, nursing dispense charts, or actual consumption by the patient at the bedside. Among these various ways of calculating DOT, the data generated by actual consumption is the most accurate and relevant measure. These consumption measures of drugs (DDD and DOT) are presented as rates within a time frame. For antibiotic usage, these measurements involve expressing DDD or DOT per 1000 or 100 patient days for different population sizes.[9]
The present study was conceived to document the baseline antibiotic consumption rate in DDD and DOT metrics and subsequent improvement, if any, after the initiation of AMSP in selected areas of the hospital.
MATERIALS AND METHODS
Study definitions
DDD
The WHO 2021 Guidelines for ATC/DDD were employed to compute DDD. It is defined as “assumed average maintenance dose per day for a medicine used for its main indication in adults as established by the WHO Collaborating Centre for Drug Statistics and Methodology.”[10-12] For each antibiotic, DDD is calculated individually by dividing the total grams administered per antibiotic per timeframe by the WHO DDD in grams. Calculations for antibiotic usage are made per 100 patient days. DDD provides a fixed unit of measurement independent of price, currencies, package size, and strength enabling the researcher to assess trends in drug utilization and to perform comparisons between population groups.
DOT
“The number of days a patient receives an antibiotic independent of the dose.” Thus, when a patient receives multiple antibiotics, DOT is calculated for each separate antibiotic.[11]
Patient days
Patient days are the number of patients present in the study area during the midnight census of a calendar month.
Research design and setting
This is a case-record-based extended cross-sectional observational study. The research was carried out at All India Institute of Medical Sciences (AIIMS), Bhopal, a tertiary care teaching Institute in Central India. AIIMS, Bhopal, serves as a regional center for the Indian Council of Medical Research (ICMR)-initiated AMR Surveillance and Research Network of India. In 2018, an AMSP was initiated with the support of ICMR at AIIMS, Bhopal. The primary objective of the present study was to identify the baseline DDD and DOT of ICMR priority antibiotics: Colistin, meropenem, vancomycin, piperacillin-tazobactam, and cefoperazone. The secondary objective was to identify the impact of AMSP on subsequent DDD and DOT measured over the next two quarters.
Participants
The Institutional Ethics Committee granted a waiver of the consent of patients as we collected anonymized data without any patient identifiers. All patients admitted to the hospital during the study period were taken into consideration without any exclusion.
Study procedure
After obtaining approval from the Institutional Human Ethics Committee, the study was conducted using the prior validated ICMR-supported tool. Data for antibiotic consumption were collected by reviewing medical case records and bedside treatment charts of all the in-patients admitted to the previously identified hospital areas. The data on antibiotic usage were collected by daily bedside visits and patient chart inspection.
The study was conducted from January 2021 to September 2021. During this study period, certain low-priority areas and high-priority areas were identified in the hospital depending on the requirement of intensive care. After obtaining the baseline consumption data of intended ICMR priority antibiotics as mentioned in Table 1, a structured AMSP was initiated. Documentation of infection-related diagnosis, practice of sending appropriate bacterial culture before starting an antibiotic, documenting comorbidities, consumption of antibiotics, and clinical outcome during the period of hospitalization was carried out. A monthly point prevalence study (PPS) was conducted during the study period by the investigators.[7]
| Antibiotic class | ATC code | Name of antibiotic | DDD (IV) | Category (AWaRe classification) |
|---|---|---|---|---|
| β-lactam/β-lactamase-inhibitor | J01CR05 | Piperacillin/tazobactam | 14 g | Watch |
| Glycopeptide | J01XA01 | Vancomycin | 2 g | Watch |
| 3rd-generation-cephalosporins | J01DD12 | Cefoperazone | 4 g | Watch |
| Carbapenems | J01DH02 | Meropenem | 3 g | Watch |
| Polymyxins | J01XB01 | Colistin | 9 MU | Reserve |
ATC: Anatomical therapeutic chemical, DDD: Defined daily dose, AWaRe: WHO Access, Watch, Reserve, IV: Intravenous (https://www.who.int/publications/i/item/WHO-MHP-HPS-EML-2023.04)
The responsibility for data collection was delegated to the nursing officers (NOs) on duty, with supervision by the senior NO (SNO) in each ward or intensive care unit. The collected data was then compiled by the project research associate and shared with all faculty members to identify any discrepancies. To ensure accuracy, the data were scrutinized at multiple levels, involving the NOs, SNOs, research associates, faculty in charge, and the medical records department. Following a thorough review process, the data were ultimately presented to the institute’s administrators and the funding agency.
Sample size: Feasible sampling was adopted, and all cases admitted in the pre-defined areas of the hospital were considered without excluding any.
Statistical analysis
The collected and compiled data were entered into a spreadsheet. The calculation of DDD and DOT was performed individually for each antibiotic as per WHO tool per 100 patient days.
RESULTS
Co-morbidities and clinical outcomes
During the study period, 4052 patient case records were reviewed for patients admitted in the prior identified areas. Among the in-patients included in the study, 15.7% (638/4052) patients were found to have ≥2 co-morbidities. Diabetes mellitus 27.4% (1104/4052) was the most common co-morbidity, followed by immunosuppression therapy 25.6% (1037/4052), chronic kidney disease 6.1% (249/4052), chronic liver disease 4.0% (164/4052), and neutropenia 0.3% (12/4052). Out of the 4052 patients, 78.1% were cured and discharged, 12.3% of patients died during the study, and 3.6% of patients left against medical advice.
Antibiotic consumption rates
DDD
The detailed quarter-wise consumption of the ICMR priority antibiotics is provided in Table 2. The average DDD/100 patient days in decreasing order of the various ICMR priority antibiotics in high priority areas were as follows: Meropenem (77.9), colistin (41.4), piperacillintazobactam (13.5), vancomycin (7.5), and cefoperazone (4.2). The average DDD/100 patient days in decreasing order of the various ICMR priority antibiotics in low-priority areas were as follows: Meropenem (45.4), piperacillin-tazobactam (22.6), cefoperazone (5.0), vancomycin (2.3), and colistin (1.8) as mentioned in Table 2.
| Antibiotic | High-priority areas | Low-priority areas | ||||||
|---|---|---|---|---|---|---|---|---|
| Q1 | Q2 | Q3 | Average | Q1 | Q2 | Q3 | Average | |
| Colistin | 239.6 | 94.32 | 38.9 | 41.4 | 0.0 | 3.9 | 11.9 | 1.8 |
| Meropenem | 339.6 | 256.3 | 105.3 | 77.9 | 54.6 | 309.5 | 44.8 | 45.4 |
| Vancomycin | 13.1 | 36.7 | 17.6 | 7.5 | 6.3 | 5.1 | 9.1 | 2.3 |
| Piperacillin-tazobactam | 31.9 | 47.3 | 42.6 | 13.5 | 44.6 | 87.3 | 71.9 | 22.6 |
| Cefoperazone | 21.4 | 6.2 | 10.2 | 4.2 | 19.0 | 25.9 | 0.0 | 5.0 |
DDD: Defined daily dose, Q1: Quarter 1, Q2: Quarter 2, Q3: Quarter 3, Q4: Quarter 4
DOT
The average DOT/100 patient days in decreasing order of the various ICMR priority antibiotics in high priority areas were as follows: Meropenem (40.5), colistin (20.9), piperacillintazobactam (15.7), vancomycin (3.9), and cefoperazone (3.8). The average DOT/100 patient days in decreasing order of the various ICMR priority antibiotics in low-priority areas were as follows: Meropenem (45.4), cefoperazone (44.9), piperacillin-tazobactam (22.6), vancomycin (2.3), and colistin (1.8) as mentioned in Table 3.
| Antibiotic | High-priority areas | Low-priority areas | ||||||
|---|---|---|---|---|---|---|---|---|
| Q1 | Q2 | Q3 | Average | Q1 | Q2 | Q3 | Average | |
| Colistin | 104.7 | 46.9 | 36.2 | 20.9 | 0.0 | 3.9 | 11.9 | 1.8 |
| Meropenem | 178.7 | 111.2 | 75.0 | 40.5 | 54.6 | 309.5 | 44.8 | 45.4 |
| Vancomycin | 13.5 | 3.7 | 17.7 | 3.9 | 6.3 | 5.1 | 9.1 | 2.3 |
| Piperacillin-tazobactam | 38.7 | 55.5 | 47.3 | 15.7 | 44.6 | 87.3 | 71.9 | 22.6 |
| Cefoperazone | 21.3 | 4.7 | 8.3 | 3.8 | 19.0 | 25.9 | 0.0 | 44.9 |
DOT: Days of therapy, Q1: Quarter 1, Q2: Quarter 2, Q3: Quarter 3, Q4: Quarter 4
The trends of antibiotic consumption are depicted in Figure 1. There was an overall sharp decline in the consumption rate of most ICMR-priority antibiotics, as shown in Figure 1.
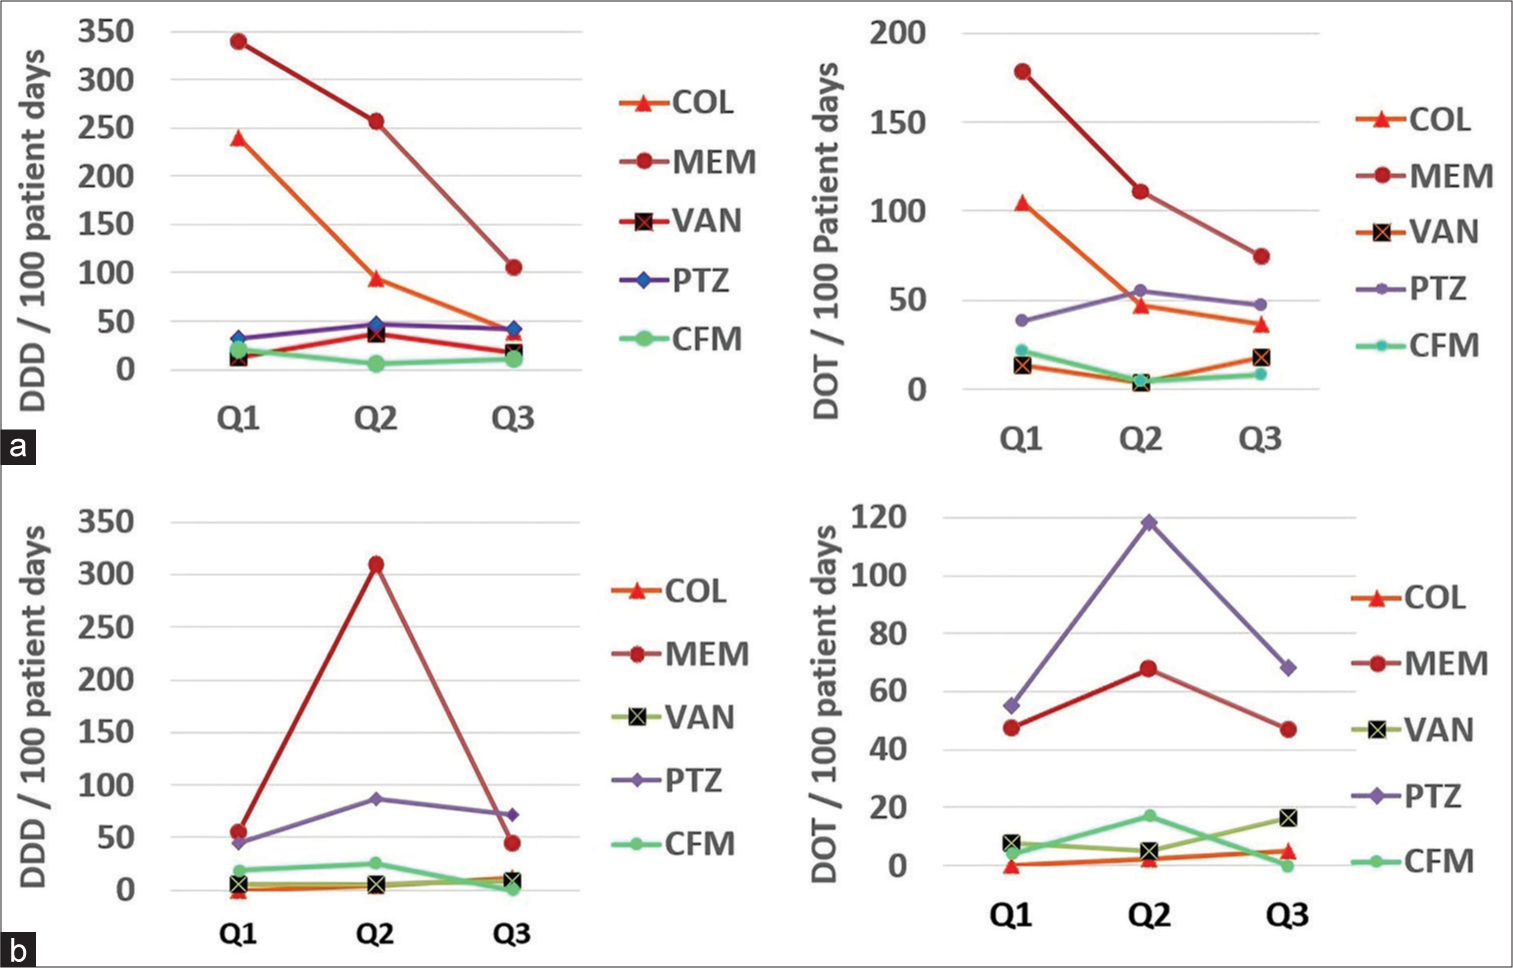
- Quarter-wise trend in defined daily dose and days of therapy per 100 days: (a) High-priority areas (b) Low-priority areas. COL: Colistin, MEM: Meropenem, VAN: Vancomycin, PTZ: Piperacillin-tazobactam, CFM: Cefoperazone, Q1: Quarter 1, Q2: Quarter 2, Q3: Quarter 3, Q4: Quarter 4. DOT: Days of therapy, DDD: Defined daily dose
On comparison among both the used tools, i.e., DDD and DOT as a measure of consumption of antibiotics, we observed an almost linear correlation between these two tools as depicted in Figure 2.
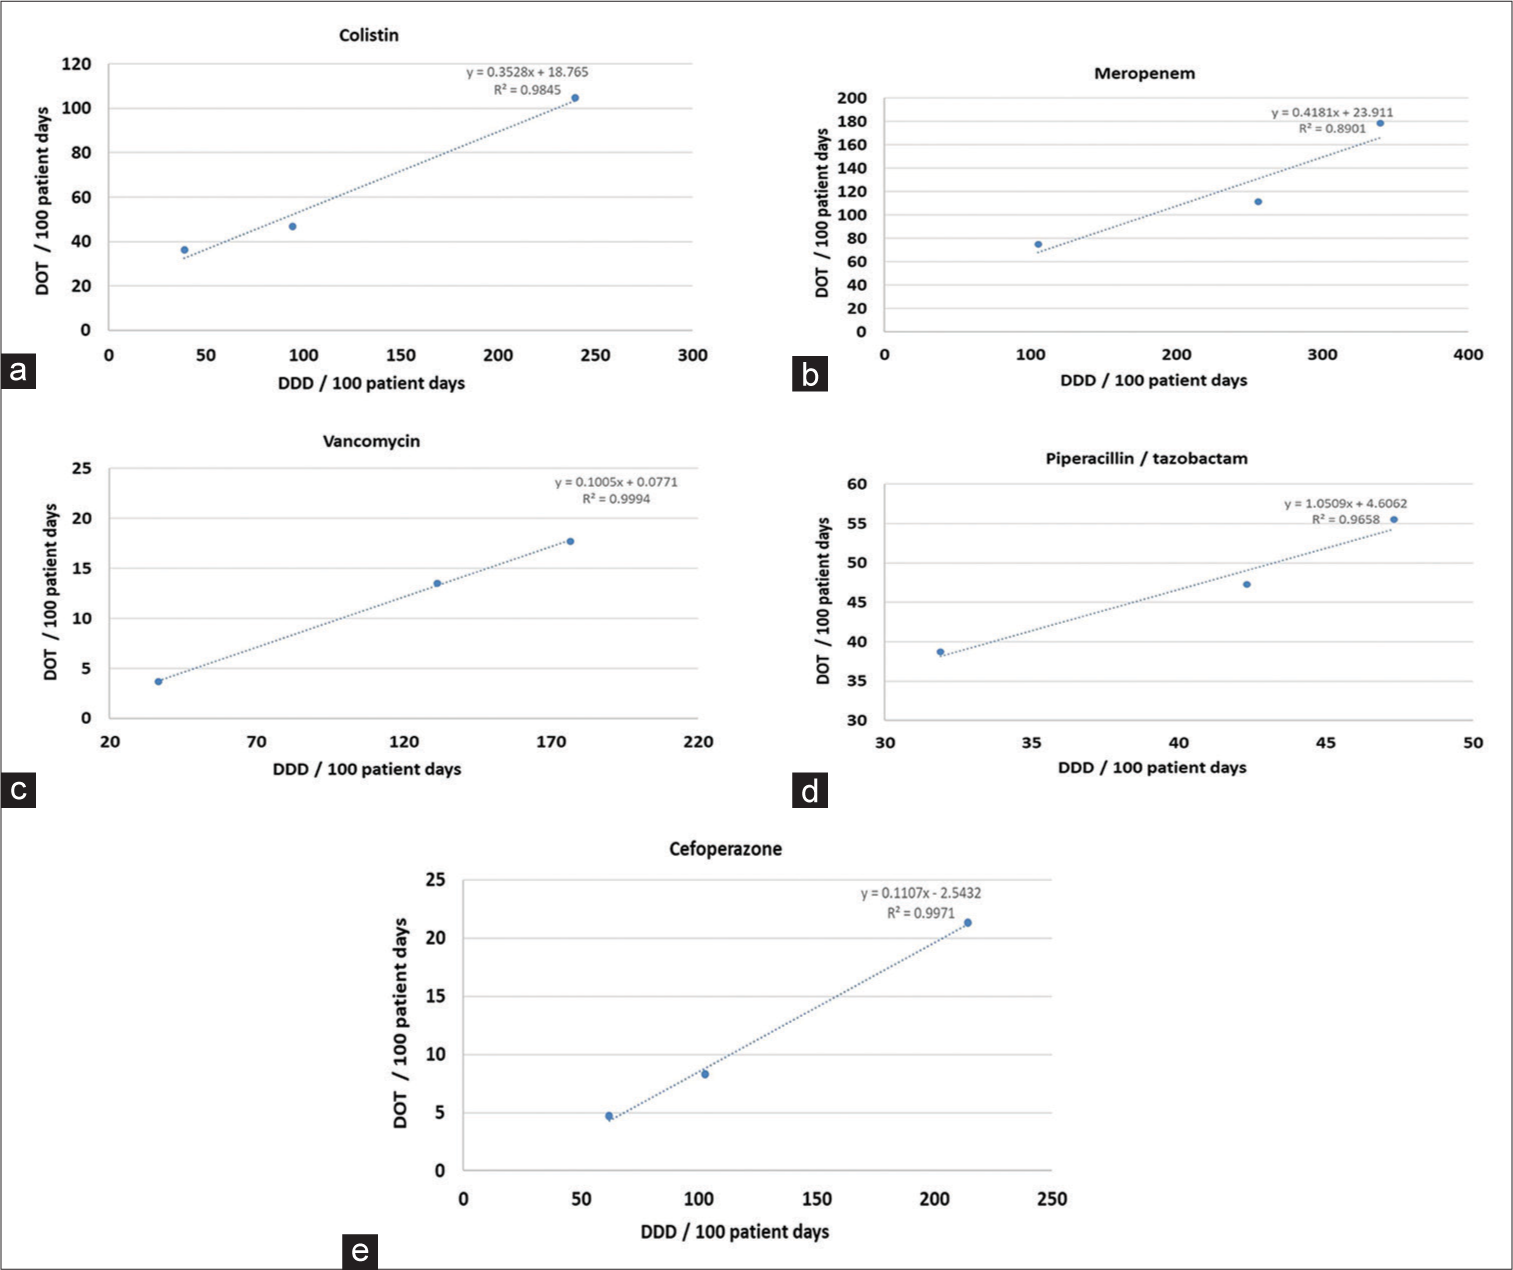
- Correlation of antibiotics between defined daily dose/100 patient days and days of therapy/100 patient days. (a) Colistin (b) Meropenem (c) Vancomycin (d) Piperacillin/tazobactam (e) Cefoperazone. DOT: Days of therapy, DDD: Defined daily dose
DISCUSSION
DDD and DOT have often been used as a standardized tool to measure antimicrobial consumption.[13] Many developed nations, including the USA and European Nations, use these tools per 100 patient days to quantify and compare the consumption of antibiotics across various healthcare delivery facilities.[14-17] Though these methods serve as benchmark tools to measure antibiotic consumption, multiple studies have brought out some shortcomings. The limitations are attributed to conditions where case-based dose adjustments are made in scenarios of varied pharmacokinetic situations (decreased hepatic or renal function or in pediatric populations). Apart from these situations, prescription writing practices in developing nations such as India are not strongly regulated and may not always follow the WHO-approved DDD.[18-23]
In our study in high-priority areas, the average DDD/100 patient days was highest for meropenem (77.9), followed by colistin (41.4) and piperacillin-tazobactam (13.5), as shown in Table 2 and Figure 1. The comparative DDD/100 patient days in the 1st and 3rd quarters revealed that there was a significant decrement for meropenem and colistin. The minor increment in usage of piperacillintazobactam is self-explanatory in view of the reduction in high-end antibiotics such as meropenem and colistin. In our study in low-priority areas, the average DDD/100 patient days was highest for meropenem (45.4), followed by piperacillintazobactam (22.6) and cefoperazone (5), as presented in Table 2 and Figure 1. In comparison to the first quarter, the DDD/100 patient days in the last quarter were significantly decreased for meropenem, piperacillin-tazobactam, and cefoperazone. However, there was an increment in the use of colistin DDD/100 patient days which may be explained by more and more sicker patients being treated in the general ward. However, this might be a situation where, in pursuit of decreasing the antibiotic exposure, we might have under-treated initially and there was a subsequent terminal knee-jerk correction.
In our study in high-priority areas, the average DOT/100 patient days were maximum for meropenem (40.5), followed by colistin (20.9) and piperacillin-tazobactam (15.7), as mentioned in Table 3 and Figure 1. While comparing the DOT from the first quarter to the third quarter, it was observed that there was a significant decrease in the usage of meropenem, colistin, and piperacillin-tazobactam. In our study in low-priority areas, the average DOT/100 patient days were maximum for meropenem (45.4), followed by cefoperazone (44.9) and piperacillin-tazobactam (22.6), as mentioned in Table 3 and Figure 1. While comparing the DOT from the first quarter to the third quarter, it was observed that there was a significant decrease in the usage of meropenem and cefoperazone and a minor increase in piperacillin-tazobactam, which is self-explanatory. However, the increment in consumption of colistin may be explained by the theory of knee-jerk correction as already explained under the section of DDD.
Our study documents a strong direct linear correlation between DDD and DOT for all the studied antibiotics. This is in contrast to similar studies earlier conducted in India by Saudi Arabia by Balkhy et al., (2018), in India by Patra et al., (2020), and in Spain by Vallès et al., (2020).[24-26] A detailed comparison between similar studies across the globe is presented in Table 4.
| Study site | Antibiotic | DDD/100 patient days | DOT/100 patient days | Reference |
|---|---|---|---|---|
| Current study (Central India) | Meropenem | Baseline data – 77.9 | Baseline data – 40.5 | NA |
| Implementation – 9.3 | Implementation – 23.4 | |||
| Colistin | Baseline data – 41.4 | Baseline data – 20.9 | ||
| Implementation – 1.5 | Implementation – 1.1 | |||
| Vancomycin | Baseline data – 7.5 | Baseline data – 3.9 | ||
| Implementation – 2.9 | Implementation – 1.7 | |||
| United States | Meropenem | 13.8 | NA | Lopez et al., 2023[27] |
| Colistin | NA | NA | ||
| Vancomycin | 9.2 | NA | ||
| Spain | Meropenem | 4.6 | NA | Grau et al., 2020[28] |
| Colistin | 2.67 | NA | ||
| Vancomycin | 3.13 | NA | ||
| Eastern India | Meropenem | 26.4 | 17.6 | Patra et al., 2020[25] |
| Colistin | 4.7 | 1.6 | ||
| Vancomycin | 2.2 | 2.2 | ||
| Saudi Arabia | Carbapenems | 25.6 | 23.5 | Balkhy et al., 2018[24] |
| Colistin | 1.3 | 11.7 | ||
| Vancomycin | 9.8 | 12.9 | ||
| New Zealand and Australia | Meropenem | 24.8 | NA | Dulhunty et al., 2011[29] |
| Vancomycin | 14.6 | NA | ||
| France | Carbapenems | 3.6 | NA | Dumartin et al., 2007[30] |
| Vancomycin | 2.9 | NA | ||
| Germany | Carbapenems | 8.1 | NA | Meyer et al., 2006[31] |
| Vancomycin | 3.6 | NA | ||
| United States | Carbapenems | 3.7 | NA | NNIS, 2004[16] |
| Vancomycin | 13.2 | NA | ||
| Sweden | Carbapenems | 5.8 | NA | Walther et al., 2002[32] |
| Vancomycin | 5.0 | NA |
DDD: Defined daily dose, DOT: Days of therapy, NA: Not available, NNIS: National nosocomial infections surveillance system, ICMR: Indian Council of Medical Research
In the current study, the baseline (first quarter) DDD and DOT of most antibiotics were much higher than in comparison to the developed nations such as the United Nations, European nations, and Saudi Arabia. The details of the comparative values are provided in Table 4. However, it is extremely encouraging that with the implementation of AMSP, the third quarter DDD and DOT of most antibiotics were significantly decreased, almost equivalent to the developed nations, as presented in Table 4. The present study also documents that, the baseline consumption of vancomycin was, in fact, lesser than the United States, Australia, New Zealand, and Saudi Arabia but lesser than the European Nations as in Table 4.[27-32] This could be attributed to the lesser prevalence rates of methicillin-resistant Staphylococcus aureus in India particularly in our Institute.[33,34]
Although there is still a chase for a gold standard tool for the measurement of antibiotic usage and subsequent comparison, the WHO-ATC DDD and DOT/100 patient days are some of the best available tools with only minor disadvantages. The present study documented that DDD and DOT can be calculated even in large public sector hospitals with huge footfalls. The study also documented the significant positive impact of a well-planned AMSP in a significant decrement in antibiotic consumption and subsequent decrease in AMR in the community.
The study had several limitations. The study was only observational and case record-based. The consultants were free to choose their drug regimen and dosage without any specific protocol-based treatment plan. The study was carried out by trained and enthusiastic personnel specifically recruited for the purpose.
CONCLUSIONS
AMSP is one of the most effective measures for the containment of AMR. Although there are many facets of AMSP, simple measures such as writing an infection-related diagnosis, sending an appropriate sample for bacterial culture before writing an antibiotic, and conducting PPS from time to time are of utmost importance to decrease antibiotic consumption at healthcare facilities. Calculating WHO ATC DDD and DOT/100 days at the baseline and post-AMSP implementation can be used as a quantitative measurement of antibiotic usage and subsequent comparison from time to time. In resource-limited settings, only DOT/100 days may be practiced as it is less labor-intensive and has a positive co-relation with DDD/100 days.
Acknowledgments
The Indian Council of Medical Research (ICMR) funded the project and provided technical assistance.
Ethical approval
The research/study was approved by the Institutional Review Board at AIIMS, Bhopal, number LOP/2018/EF0080, dated 5th March 2018.
Declaration of patient consent
Patient’s consent not required as patients identity is not disclosed or compromised.
Conflicts of interest
Dr. Sagar Khadanga and Dr. Karuna Tadepalli are on the Editorial Board of the Journal.
Use of artificial intelligence (AI)-assisted technology for manuscript preparation
The authors confirm that there was no use of artificial intelligence (AI)-assisted technology for assisting in the writing or editing of the manuscript and no images were manipulated using AI.
Financial support and sponsorship
Indian Council of Medical Research (ICMR), New Delhi funded the project. The project was sanctioned by ICMR, vide Letter No.: AMR/135/2018-ECD-Il dated 14-06-2018.
References
- Available from: https://www.who.int/news-room/fact-sheets/detail/antimicrobial-resistance [Last accessed on 2024 Feb 06]
- Measuring the global response to antimicrobial resistance, 2020-21: A systematic governance analysis of 114 countries. Lancet Infect Dis. 2023;23:706-18.
- [CrossRef] [PubMed] [Google Scholar]
- Consumption of systemic antibiotics in India in 2019. Lancet Reg Health Southeast Asia. 2022;4:100025.
- [CrossRef] [PubMed] [Google Scholar]
- The antibiotic resistance and prescribing in European children project: A neonatal and pediatric antimicrobial web-based point prevalence survey in 73 hospitals worldwide. Pediatr Infect Dis J. 2013;32:e242-53.
- [CrossRef] [PubMed] [Google Scholar]
- The use of an antibiotic order form for antibiotic utilization review: Influence on physicians' prescribing patterns. J Infect Dis. 1984;150:803-7.
- [CrossRef] [PubMed] [Google Scholar]
- Practice of antimicrobial stewardship in a government hospital of India and its impact on extended point prevalence of antibiotic usage. J Family Med Prim Care. 2021;10:991-7.
- [CrossRef] [PubMed] [Google Scholar]
- Impact of an anti-microbial stewardship program on targeted antimicrobial therapy in a tertiary care health care institute in central India. Cureus. 2021;13:e18517.
- [CrossRef] [Google Scholar]
- Application of ATC/DDD methodology to eveluate of antibiotic use in a general hospital in Turkey. Ann Clin Microbiol Antimicrob. 2013;12:23.
- [CrossRef] [PubMed] [Google Scholar]
- Measurement of antibiotic consumption: A practical guide to the use of the anatomical thgerapeutic chemical classification and definied daily dose system methodology in Canada. Can J Infect Dis. 2004;15:29-35.
- [CrossRef] [PubMed] [Google Scholar]
- Available from: https://www.who.int/tools/atc-ddd-toolkit/atc-classification [Last accessed on 2024 Feb 06]
- Antimicrobial stewardship programmes in health-care facilities in low-and middle-income countries: A WHO practical toolkit. JAC Antimicrob Resist. 2019;1:dlz072.
- [CrossRef] [PubMed] [Google Scholar]
- Available from: https://www.whocc.no/atc_ddd_index_and_guidelines/atc_ddd_index [Last accessed on 2024 Feb 06]
- Toward better benchmarking. Infect Control Hosp Epidemiol. 2005;26:433-4.
- [CrossRef] [PubMed] [Google Scholar]
- Application of the ATC/DDD methodology to monitor antibiotic drug use. Eur J Clin Microbiol Infect Dis. 1998;17:20-4.
- [CrossRef] [PubMed] [Google Scholar]
- Estimating worldwide current antibiotic usage: Report of task force 1. Rev Infect Dis. 1987;9:S232-43.
- [CrossRef] [PubMed] [Google Scholar]
- National Nosocomial Infections Surveillance (NNIS) System Report, data summary from January 1992 through June 2004, issued October 2004. Am J Infect Control. 2004;32:470-85.
- [CrossRef] [Google Scholar]
- Variation in antibiotic use in the European Union. Lancet. 2001;357:1851-3.
- [CrossRef] [PubMed] [Google Scholar]
- Discrepancies between consumed daily doses and WHO defined daily doses of antibacterials at a university hospital. Br J Clin Pharmacol. 2006;61:585-91.
- [CrossRef] [PubMed] [Google Scholar]
- Evaluation of the defined daily dose method for estimating anti-infective use in a university hospital. Am J Health Syst Pharm. 2005;62:2288-92.
- [CrossRef] [PubMed] [Google Scholar]
- Fluoroquinolone consumption and resistance in haematology-oncology patients: Ecological analysis in two university hospitals 1999-2002. J Antimicrob Chemother. 2005;55:57-60.
- [CrossRef] [PubMed] [Google Scholar]
- Methodological validation of monitoring indicators of antibiotics use in hospitals. Pharm World Sci. 2004;26:90-5.
- [CrossRef] [PubMed] [Google Scholar]
- The effect of renal dysfunction on antimicrobial use measurements. Clin Infect Dis. 2002;35:1491-7.
- [CrossRef] [PubMed] [Google Scholar]
- Measurement of adult antibacterial drug use in 130 US hospitals: Comparison of defined daily dose and days of therapy. Clin Infect Dis. 2007;44:664-70.
- [CrossRef] [PubMed] [Google Scholar]
- Antimicrobial consumption in five adult intensive care units: A 33-month surveillance study. Antimicrob Resist Infect Control. 2018;7:156.
- [CrossRef] [PubMed] [Google Scholar]
- Study of antimicrobial utilization and cost of therapy in medicine intensive care unit of a tertiary care hospital in Eastern India. Indian J Crit Care Med. 2020;24:938-42.
- [CrossRef] [PubMed] [Google Scholar]
- Comparison of the defined daily dose and days of treatment methods for evaluating the consumption of antibiotics and antifungals in the intensive care unit. Med Intensiva (Engl Ed). 2020;44:294-300.
- [CrossRef] [PubMed] [Google Scholar]
- Antibiotic consumption in secondary and tertiary hospitals in Colombia: National surveillance from 2018-2020. Rev Panam Salud Pública. 2023;47:e63.
- [CrossRef] [PubMed] [Google Scholar]
- Impact of changes in the WHO's 2019 update of DDDs on the measurement of adult hospital antibacterial consumption in Catalonia (Spain), 2008-18. JAC Antimicrob Resist. 2020;2:dlaa079.
- [Google Scholar]
- Antimicrobial utilisation in 37 Australian and New Zealand intensive care units. Anaesth Intensive Care. 2011;39:231-7.
- [CrossRef] [PubMed] [Google Scholar]
- Antibiotic use in 530 French hospitals: Results from a surveillance network at hospital and ward levels in 2007. J Antimicrob Chemother. 2010;65:2028-36.
- [CrossRef] [PubMed] [Google Scholar]
- Surveillance of Antimicrobial Use and Antimicrobial Resistance in German Intensive Care Units (SARI): A summary of the data from 2001 through 2004. Infection. 2006;34:303-9.
- [CrossRef] [PubMed] [Google Scholar]
- Antibiotic prescription practices, consumption and bacterial resistance in a cross section of Swedish intensive care units. Acta Anaesthesiol Scand. 2002;46:1075-81.
- [CrossRef] [PubMed] [Google Scholar]
- Changing patterns of antimicrobial susceptibility of uropathogens in community-acquired urinary tract infections in central India: Two year prospective surveillance report. Infect Dis Diag Treat. 2023;l7:234.
- [CrossRef] [Google Scholar]
- Antimicrobial resistance trends in community acquired pneumonia at secondary care centres in Central India: Time to develop community antimicrobial stewardship program. Infect Dis Diag Treat. 2023;7:232.
- [CrossRef] [Google Scholar]


