
Translate this page into:
Gut metabolite alterations in colorectal cancer: Fecal analysis of short-chain fatty acids and secondary bile acids

*Corresponding author: Smreti Vasudevan, Department of Research, Rajiv Gandhi Cancer Institute and Research Centre, New Delhi, India. smreti@gmail.com
-
Received: ,
Accepted: ,
How to cite this article: Mehta A, Vasudevan S, Sachdeva N, Goel S, Chinnaboina M. Gut metabolite alterations in colorectal cancer: Fecal analysis of short-chain fatty acids and secondary bile acids. J Lab Physicians. 2025;17:72-80. doi: 10.25259/JLP_192_2024
Abstract
Objectives
The gut metabolome of colorectal cancer (CRC) patients remains inadequately characterized. This study aimed to compare fecal short-chain fatty acid (SCFA) and secondary bile acid levels between patients with CRC and normal subjects.
Materials and Methods
Stool specimens were collected from patients with CRC and normal individuals. Fecal samples were extracted with isopropanol: acetonitrile:water (3:2:2 ratio), derivatized with ethyl chloroformate, and were separated and analyzed for acetate, propionate, butyrate, lithocholic acid (LCA), and deoxycholic acid (DCA) by gas chromatography–mass spectrometry. Calibration curves were established with reference standard solutions. Compounds were identified by running the raw data through the National Institute of Standards and Technology mass spectral library. Clinical details were obtained from medical records.
Statistical analysis
Statistical analyses were performed using the Statistical Package for the Social Sciences version 29. Statistical significance was assessed using Pearson’s Chi-square, Mann–Whitney U, or Kruskal–Wallis tests. P < 0.05 was considered statistically significant.
Results
Higher levels of LCA and DCA were detected in the stool specimens of patients with CRC compared with the normal controls (median 3.56 vs. 1.67 pmol/kg, P < 0.001). The acetate, propionate, and butyrate levels did not significantly differ between the groups. The ratio of SCFAs to secondary bile acids was lower in the stool of patients with CRC than in the controls (median 20.64 vs. 49.61, P < 0.001).
Conclusions
A positive association between fecal LCA and DCA levels and CRC was observed in our cohort. These findings have implications for non-invasive screening and treatment of CRC.
Keywords
Colorectal cancer
Gas chromatography-mass spectrometry
Inflammation
Low-incidence countries
Stool metabolomics

INTRODUCTION
The incidence of colorectal cancer (CRC) has increased in India, noticeably among young adults and in urban areas. Intestinal inflammation is a major risk factor for CRC, and the mucosal immune system is orchestrated by the native gut microflora. Gut microbiota-derived metabolites, particularly short-chain fatty acids (SCFAs) and bile acids are putative players in CRC pathogenesis. SCFAs, such as acetate, propionate, and butyrate, are produced by the fermentation of indigestible dietary fibers by intestinal bacteria. These metabolites have anti-inflammatory effects and are considered beneficial for maintaining luminal health by mediating immune homeostasis. The second class of metabolites is bile acids, which are primarily synthesized from cholesterol in the liver, and subsequently undergo biotransformation by the intestinal flora into secondary bile acids. Lithocholic acid (LCA) and deoxycholic acid (DCA) are the two prominent secondary bile acids produced in the large intestine from bacterial dehydroxylation of cholic acid and chenodeoxycholic acid, respectively. Both LCA and DCA are cytotoxic and are considered to be involved in the development of CRC by promoting inflammation.[1,2]
Despite the distinctive roles of gut microbial metabolites in disease pathogenesis, data supporting the relationship between CRC, SCFAs, and bile acids from different studies are conflicting. Some studies suggest that high fecal SCFA levels, especially increased levels of butyrate in the gut, attenuate the risk of CRC,[3,4] whereas others failed to demonstrate a clear predictive pattern.[5] Many studies propose that a high-fat diet and an elevated secondary bile acid concentration in the stool contribute to CRC development.[6-10] However, some reports, including a meta-analysis, have failed to show an association between specific bile acid levels and CRC.[11-13] Most studies have been conducted in Western countries, where the incidence of CRC is high and eating habits and lifestyles markedly differ from those in India. Studies on gut microbial metabolome in patients with CRC in countries with low incidence rates like India remain largely under-represented.[14,15] There is a paucity of data on our part addressing the relationship between intestinal metabolites and CRC.
In this study, a targeted metabolomic approach using gas chromatography coupled with mass spectrometry (GC-MS) was used to investigate possible differences between fecal SCFA and secondary bile acid levels in patients with CRC and normal individuals. Furthermore, the relation between stool metabolites and clinical parameters in patients with CRC was assessed.
MATERIALS AND METHODS
Ethical approval
The study was initiated following ethical approval from the Institutional Review Board (RGCIRC/IRB-BHR/81/2023) and was conducted according to the ethical principles outlined in the Declaration of Helsinki. All participants provided consent before enrollment, and their clinical data were de-identified to protect their privacy.
Study design
Sample size
This study is exploratory, designed to assess the usefulness of fecal metabolomics in determining whether important fecal SCFAs (acetate, propionate, and butyrate) and secondary bile acids (LCA and DCA) differ between our cohort of CRC patients and normal individuals. Fecal metabolite levels are influenced by geographic location, dietary habits, and microbiota composition, and these metabolites have not been previously characterized for our region. To address this, a pilot study was undertaken with approximately 18–20 participants in each group,[16] considering the feasibility and constraints of available resources.
We collected thirty-nine freshly voided stool samples and assayed them by GC-MS. The initial two samples failed in quality measures and were excluded. Therefore, data from 37 participants were assessed.
Type of study
It is a case-control, observational study comprising CRC patients and normal individuals. Stool samples were prospectively obtained from patients with CRC undergoing treatment at our hospital. Age-matched normal volunteers were recruited from the hospital staff for the study.
Inclusion and exclusion criteria
CRC patients
The inclusion criteria for CRC cases were as follows: Age >18 years; confirmed diagnosis of CRC on histopathology; not received chemotherapy and/or radiotherapy in the previous 8 months; not on active antibiotic treatment; and not taking alternate medicines. The exclusion criteria were as follows: Patients with more than one malignancy; family history of CRC in first- or second-degree relatives; patients with inflammatory bowel disease, chronic kidney disease, or liver complaints; and patients who were not able/unwilling to provide stool samples.
Control group
The control belonged to Delhi or adjoining regions; did not suffer from any chronic illness like diabetes or cardiovascular disease, which can affect the gut microbiome; did not report gastrointestinal-related complaints or infections based on symptoms and routine laboratory tests; had a normal bowel habit; had not used antibiotics in the past 3 months; and were willing to be a part of the study and provide their stool sample.
The base population was North India (Delhi, Haryana, Punjab, and Uttarakhand regions).
Data collection
Demographic information about the participants was recorded at the time of sample collection. Clinical parameters of the patients were retrieved from the hospital medical records.
Sample collection
Stool samples were collected from September 2023 to December 2023. Each participant was provided disposable gloves, a ziplock bag containing an icepack, and a sterile container, all of which were encased in a biohazard bag. The samples were transported within 2 h from collection to our laboratory. About 10–15 g of single passed stool specimen was collected as a whole sample in a single container, labeled, sealed with parafilm, and stored at −80°C. The subjects’ compliance with the study was 64%.
The samples were shipped together on dry ice to the Vijayrekha Life Sciences Laboratory in Hyderabad, where fecal metabolite analysis was conducted blinded to the case or control status. All samples were assayed in January 2024.
Sample processing
For the extraction and quantitation of compounds from the stool and analysis by GC-MS, the following procedure was followed. First, the samples were thawed to room temperature, and specimen was taken from the two ends and the middle position of the stool and weighed. Then, approximately 40 mg of each sample was extracted using 1.5 mL of the extraction solvent isopropanol: acetonitrile:water (3:2:2 ratio) by vigorous shaking for 10 min. The extracted sample was derivatized with 80 µL of ethyl chloroformate.
Sample analysis
The samples were separated and analyzed using GC-MS (GCMS-QP2020 NX, Shimadzu) with capillary column Nukol™ (30 m × 0.25 mm, df 0.25 µm). The GC-MS instrument was calibrated with the octafluoronaphthalene (OFN) standard for mass accuracy. The samples were injected in splitless mode at 210°C injection port temperature and 250°C ion source temperature. The temperature program was started at 55°C with a holding time of 1 min, increased to 100°C at a rate of 10°C/min with a holding time of 2 min, and increased to 190°C at 30°C/min with a holding time for 1 min. The flow rate of helium gas was 2.5 mL/min, and ionization was at 80 eV. The compounds eluting from the column were ionized in the mass spectrometer for detection. The chromatogram contained the intensity and retention time of each eluting compound. The m/zs for acetate is 60.04, butyrate is 89.1, propionate is 75.08, LCA is 377.5, and DCA is 393.5 which were used in Selected Ion Monitoring (SIM) mode to quantitate using area under the curve as against the standard calibration curve run for each compound. The reference standard solution mix for SCFAs (10 mM, Sigma: CRM46975) was used to establish the calibration curve ranging from 4 to 100 µM by serial dilution, and DCA and LCA were used for bile acids ranging from 0.001 to 100 nM. To identify the compounds, the raw data were run through the National Institute of Standards and Technology mass spectral library and were quantitated in the SIM mode.
Statistical analysis
The data were summarized using descriptive statistics. Pearson’s Chi-square test was applied to determine the association between categorical variables. Non-parametric Mann–Whitney-U test was employed to compare the levels of different SCFAs and bile acids between CRC and control groups. The Kruskal–Wallis test was used to compare more than two categories. A P < 0.05 was considered statistically significant. All statistical analyses were performed using the Statistical Package for the Social Sciences version 29.0 (IBM SPSS Inc., Chicago, IL, USA).
RESULTS
The characteristics of the study group are summarized in Table 1. The relative levels of fecal SCFAs and secondary bile acids in patients with CRC and normal subjects are presented in Figure 1a. As observed from the heat map, the concentration of acetate, propionate, and butyrate in patients with CRC tended to be lower than those in normal subjects; however, this difference did not reach statistical significance [Table 1 and Figure 1b]. Notably, higher levels of LCA and DCA were detected in the stool of patients with CRC compared with normal controls (median values of 3.56 vs. 1.67 pmol/kg, P < 0.001) [Table 1 and Figure 1b].
| Variable | Total | CRC patients | Normal controls | P-value |
|---|---|---|---|---|
| n=37 (%) | n=18 (%) | n=19 (%) | ||
| Age (years) | ||||
| Mean±SD | 54.97±14.62 | 55.78±15.79 | 54.21±13.81 | 0.75a |
| Gender | ||||
| Male | 23 (62.16) | 10 (55.56) | 13 (68.42) | 0.51b |
| Female | 14 (37.84) | 8 (44.44) | 6 (31.58) | |
| Hemoglobin (g/dL) | ||||
| Median (Range) | 11.60 (8.20–15) | 10.00 (8.20-11.90) | 13.80 (8.70–15.00) | <0.001c |
| Fecal short-chain fatty acid (mmol/kg) | ||||
| Acetate, Median (Range) | 50.70 (23.10–88.60) | 48.90 (28.70–63.50) | 51.00 (23.10–88.60) | 0.22c |
| Propionate, Median (Range) | 14.50 (11.20–19.80) | 13.70 (11.80–17.60) | 14.60 (11.20–19.80) | 0.27c |
| Butyrate, Median (Range) | 13.50 (6.88–21.50) | 14.20 (6.88–19.80) | 13.50 (10.80–21.5) | 0.87c |
| Fecal secondary bile acids (pmol/kg) | ||||
| LCA+DCA, Median (Range) | 2.66 (1.02–7.45) | 3.56 (1.70–7.45) | 1.67 (1.02–5.23) | <0.001c |
aStudent’s unpaired t-test; bPearson’s Chi-square test; cMann–Whitney U-test, LCA: Lithocholic acid; DCA: Deoxycholic acid, SD: Standard deviation, CRC: Colorectal cancer
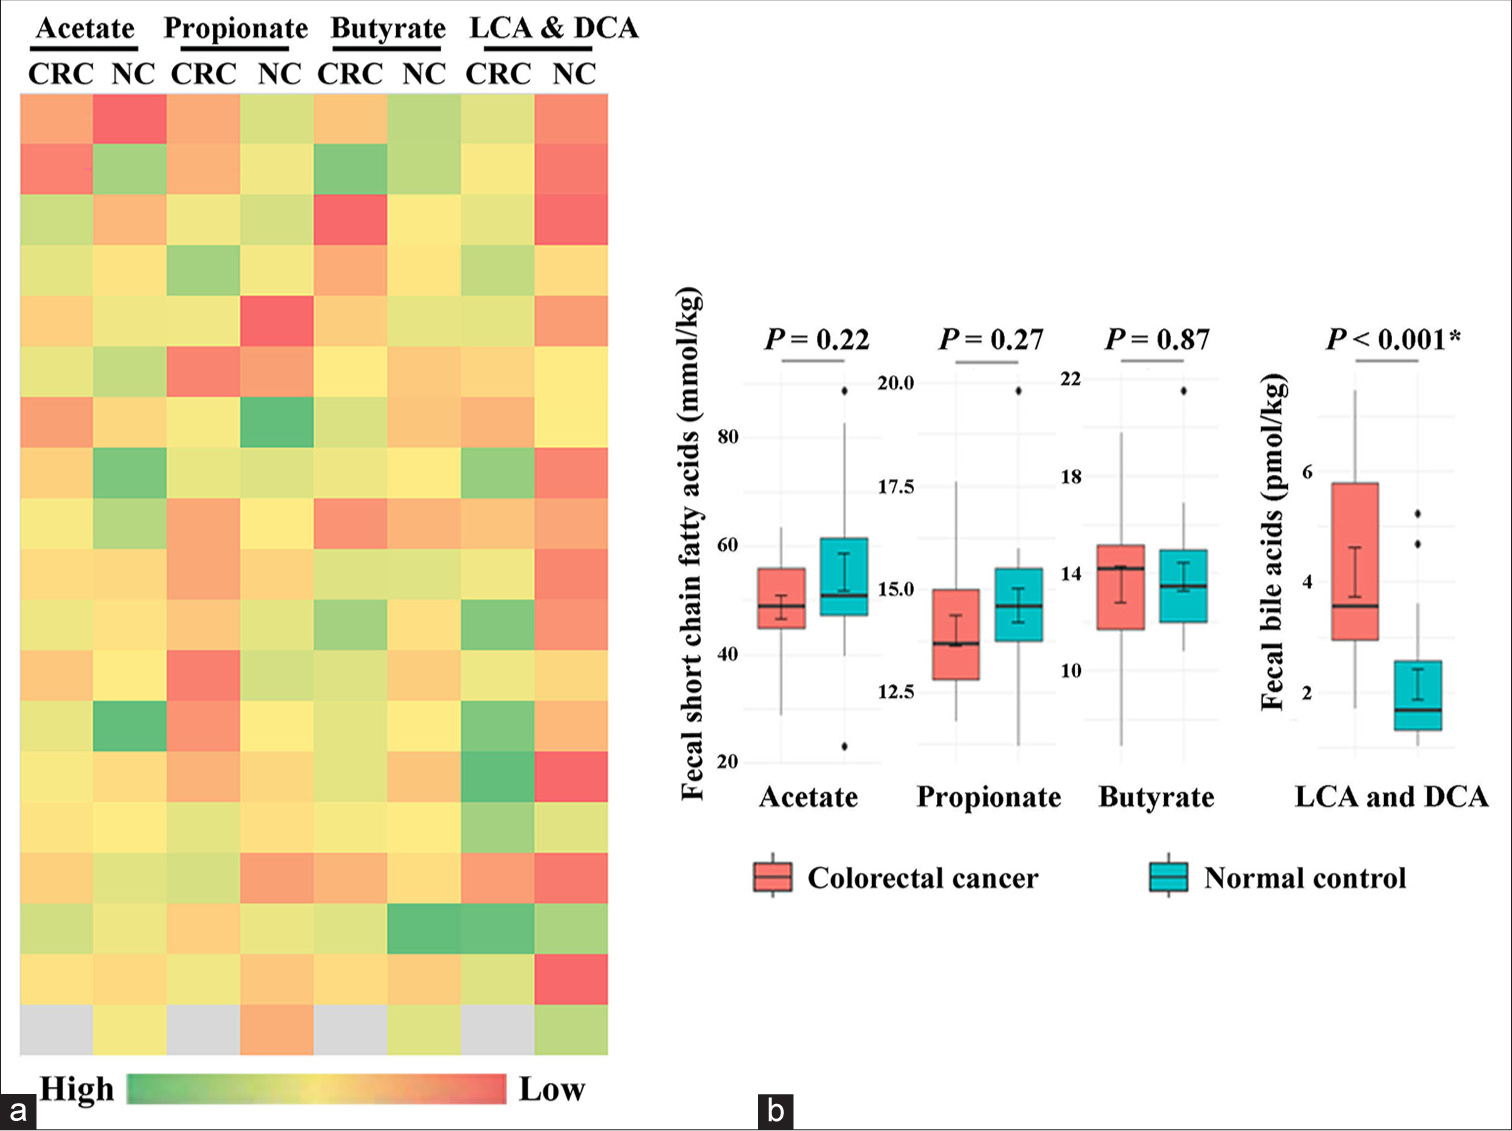
- (a) Metabolic heat map and (b) Box and whisker plot comparing the levels of fecal acetate, propionate, butyrate, lithocholic acid (LCA), and deoxycholic acid (DCA) between colorectal cancer (CRC) patients and normal controls (NC). The levels of LCA and DCA are significantly increased in the stool of CRC patients than the NC group. * denotes statistical significance.
The ratio of the sum of SCFAs to secondary bile acids in the stool of patients with CRC was 20.64 and 49.61 in the control group (P < 0.001).
The clinicopathological features of patients with CRC are presented in Table 2. The majority were colon cancer cases (61.11%) with adenocarcinoma histology (94.44%). Eight patients (44.44%) had metastatic disease, and three tumors (16.67%) were mismatch repair (MMR) protein deficient [Table 2].
| Variable | n=18 (%) |
|---|---|
| Tumor location | |
| Colon | 11 (61.11) |
| Rectosigmoid | 2 (11.11) |
| Rectum | 5 (27.77) |
| #Tumor laterality | |
| Right-sided/proximal tumors | 6 (33.33) |
| Left-sided/distal tumors | 12 (66.67) |
| Anatomical site of the primary tumor | |
| Cecum | 1 (5.55) |
| Ascending colon | 4 (22.22) |
| Hepatic flexure | 1 (5.55) |
| Splenic flexure | 1 (5.55) |
| Descending colon | 2 (11.11) |
| Sigmoid colon | 2 (11.11) |
| Rectosigmoid | 2 (11.11) |
| Rectum | 5 (27.78) |
| Tumor histology | |
| Adenocarcinoma | 17 (94.44) |
| Signet ring cell carcinoma | 1 (5.55) |
| Tumor differentiation | |
| Well | 6 (33.33) |
| Moderate | 9 (50.00) |
| Poor | 3 (16.67) |
| Tumor stage | |
| I | 1 (5.55) |
| II | 7 (38.89) |
| III | 2 (11.11) |
| IV | 8 (44.44) |
| *Metastasis | |
| Yes | 8 (44.44) |
| No | 10 (55.56) |
| Mismatch repair protein | |
| Deficient | 3 (16.67) |
| Proficient | 15 (83.33) |
| Main presenting symptom | |
| Abdominal pain | 6 (33.33) |
| Altered bowel habits | 2 (11.11) |
| Bloating | 1 (5.55) |
| Blood in the stool | 6 (33.33) |
| Chronic anemia | 1 (5.55) |
| Constipation | 2 (11.11) |
| Serum CEA (ng/mL) Median (Range) |
3.13 (0.37–91.23) |
| Smoking history | |
| Yes | 2 (11.11) |
| No | 16 (88.89) |
| Alcohol consumption | |
| Yes | 1 (5.55) |
| No | 17 (94.44) |
| Food choice | |
| Vegetarian | 9 (50.00) |
| Both vegetarian and non-vegetarian | 9 (50.00) |
| Obesity | |
| Yes | 2 (11.11) |
| No | 16 (88.89) |
Next, we examined whether specific SCFAs or bile acids were associated with distinctive features of CRC. Table 3 summarizes the association between the fecal SCFA and secondary bile acid concentrations with clinical features including baseline CEA levels of the CRC patients. It was observed that butyrate levels were significantly higher in left-sided lesions than in right-sided lesions (median values of 15.00, range: 6.88–19.80 vs. 11.20, range: 9.03–14.00 mmol/kg, P = 0.02) [Table 3]. We found no significant variations in SCFAs or bile acids among patients with CRC in relation to age, tumor location, stage, MMR protein status, or baseline CEA levels.
| Variable | n | Acetate | Propionate | Butyrate | DCA+LCA |
|---|---|---|---|---|---|
| (mmol/kg) | (mmol/kg) | (mmol/kg) | (pmol/kg) | ||
| Median (Range) | Median (Range) | Median (Range) | Median (Range) | ||
| Age group (years) | |||||
| ≤40 | 4 | 50.55 (43.20–62.00) | 13.05 (11.80–15.00) | 15.00 (12.00–15.20) | 5.01 (3.18–7.25) |
| >40 | 14 | 48.90 (28.70–63.50) | 14.20 (11.90–17.60) | 13.75 (6.88–19.80) | 3.53 (1.70–7.45) |
| P-valuea | 0.75 | 0.24 | 0.46 | 0.24 | |
| Tumor location | |||||
| Colon | 11 | 48.60 (34.80–57.10) | 14.80 (11.90–17.60) | 13.50 (9.03–15.40) | 3.64 (1.70–7.45) |
| Rectosigmoid | 2 | 59.85 (56.20–63.50) | 13.65 (12.30–15.00) | 10.89 (6.88–14.90) | 4.98 (3.42–6.54) |
| Rectum | 5 | 44.90 (28.70–62.00) | 13.60 (11.80–15.00) | 15.20 (12.00–19.80) | 3.48 (2.89–7.25) |
| P-valueb | 0.14 | 0.66 | 0.11 | 0.61 | |
| #Tumor laterality | |||||
| Right-sided | 6 | 50.80 (45.00–57.10) | 14.15 (11.90–17.60) | 11.20 (9.03–14.00) | 3.01 (1.70–5.46) |
| Left-sided | 12 | 47.85 (28.70–63.50) | 13.70 (11.80–15.30) | 15.00 (6.88–19.80) | 3.59 (1.99–7.45) |
| P-valuea | 0.71 | 0.54 | 0.02 | 0.19 | |
| Tumor stage | |||||
| I and II | 8 | 51.95 (35.80–63.50) | 14.30 (11.90–17.60) | 13.10 (6.88–18.20) | 3.67 (2.38–6.43) |
| III and IV | 10 | 47.10 (28.70–62.00) | 13.45 (11.80–15.90) | 14.90 (9.03–19.80) | 3.33 (1.70–7.45) |
| P-valuea | 0.31 | 0.69 | 0.35 | 0.72 | |
| MMR protein status | |||||
| Deficient | 3 | 35.80 (34.80–56.10) | 12.90 (11.90–14.80) | 13.50 (11.60–15.40) | 2.38 (1.99–3.64) |
| Proficient | 15 | 49.20 (28.70–63.50) | 13.80 (11.80–17.60) | 14.40 (6.88–19.80) | 3.70 (1.70–7.45) |
| P-valuea | 0.26 | 0.25 | 0.95 | 0.14 | |
| *CEA level | |||||
| Moderately elevated | 14 | 50.80 (28.70–63.50) | 14.40 (11.80–17.60) | 14.20 (6.88–19.80) | 4.11 (1.70–7.45) |
| Highly elevated | 4 | 41.50 (34.80–56.10) | 12.85 (11.90–14.80) | 14.35 (11.60-15.40) | 2.75 (1.99–3.64) |
| P-valuea | 0.28 | 0.13 | 0.57 | 0.10 | |
DISCUSSION
Gut health is considered important for overall health and disease prevention. The accumulation of harmful microbial metabolites or a reduction in beneficial metabolites in the gut can contribute to the development of CRC tumors. In this study, we assessed the fecal levels of major SCFAs and bile acids and their implications for CRC. Specifically, we analyzed acetate, propionate, and butyrate, which are the most abundant SCFAs and major sources of energy for colonocytes, as well as LCA and DCA, which are secondary bile acids known to be released in the gut by microbial action and are linked to CRC pathogenesis.
Significantly higher levels of LCA and DCA were observed in patients with CRC than in the control group. LCA and DCA are among the most hydrophobic bile acids, and their chronic exposure is considered toxic to colonocytes. At physiologically high concentrations, they act as oncometabolites by inducing oxidative stress, DNA damage, apoptosis, and favoring harmful mutations.[17,18] It is not clear whether bile acids act as tumor initiators or promoters. Previous studies have linked the consumption of a diet rich in animal fats and proteins to elevated levels of secondary bile acids such as LCA and DCA in feces, which have been associated with an increased risk of CRC.[6-8] In contrast, SCFAs which are derived from the fermentation of dietary fibers in the gut are considered beneficial against CRC. Increased levels of stool SCFAs are associated with reduced risk of CRC.[3,4] Table 4 compares the findings of the discussed studies.
| Study/Place | Cohort | SCFAs studied | Secondary bile acids | Key findings | Analytical method |
|---|---|---|---|---|---|
| Chen et al., 2013[3] | Advanced CRC, n=344 | Acetic acid | Not assessed | High intake of fiber and increased fecal SCFA levels are associated with reduced risk of advanced CRC. | Gas chromatography |
| China | Healthy control, n=344 | Propionic acid | |||
| Isobutyric acid | |||||
| Butyric acid | |||||
| Isovaleric acid | |||||
| Yusuf et al., 2018[4] | CRC patients, n=14 | Acetate | Not assessed | CRC patients have lower fecal levels of acetate, propionate and butyrate than non CRC group. | Gas chromatography |
| Indonesia | Non CRC patients, n=14 | Propionate | |||
| Butyrate | |||||
| Sze et al., 2019[5] | Adenoma cases, n=198 | Acetate | Not assessed | No significant association between fecal SCFAs and CRC tumors. | High-performance liquid chromatography |
| USA | Colon carcinoma, n=120 | Propionate | |||
| Healthy control, n=172 | Butyrate | ||||
| Kamano et al., 1999[6] | CRC patients, n=63 | Not assessed | DCA | DCA levels in stool were higher in CRC patients than healthy subjects. | Enzyme-linked immunosorbent assay |
| Japan | Healthy control, n=47 | ||||
| Kawano et al., 2010[8] | CRC patients, n=366 | Not assessed | DCA | Fecal DCA concentration was significantly higher in CRC patients and higher levels was associated with larger tumor and disease recurrence. | Enzyme-linked immunosorbent assay |
| Japan | Control, n=24 | ||||
| Kim et al., 2020[9] | CRC patients, n=36 | Not assessed | Secondary bile acids | Elevated fecal secondary bile acid levels in adenoma patients than the controls | Ultra-performance liquid chromatography-tandem mass spectrometry (untargeted metabolomics) |
| USA | Advanced adenoma, n=102 | ||||
| Matched control, n=102 | |||||
| Little et al., 2002[12] | CRC patients, n=45 | Not assessed | LCA | No significant association between fecal LCA and DCA levels and CRC. High fecal calcium level was associated with reduced risk of adenoma and CRC. | Gas chromatography |
| Nottingham | Adenoma, n=129 | DCA | |||
| Fecal occult blood-negative controls, n=155 |
CRC: Colorectal cancer; SCFA: Short-chain fatty acid, LCA: Lithocholic acid; DCA: Deoxycholic acid
In our study, the concentrations of acetate, propionate, and butyrate tended to be higher in the control group than in the CRC group, but the difference was not statistically significant. This could be due to the small sample size resulting in a lack of statistical power to detect differences. In addition, inter-individual variabilities in diet, SCFA production, or altered absorption by gut mucosa may also negate differences in SCFA levels between patients with CRC and the normal control group.[19] Most of the patients in our CRC cohort had advanced disease, including two locally advanced stage II, two stage III, and eight stage IV cases. Advanced CRC is characterized by tumor hypoxia and enhanced glycolysis, leading to more lactate formation. The conversion of lactate to SCFAs might further balance acetate, propionate, and butyrate levels in patients with CRC.[20] Our results are similar to those of a large cohort study by Sze et al., which reported a weak association between fecal SCFAs and tumor burden in patients with CRC.[5]
While specific studies addressing the fecal metabolome of CRC patients in our region are scarce, a study from South India has identified CRC-associated fecal microbiome changes including enrichment of pathogenic taxa in the stool of CRC patients.[15] Since the gut microbiome and microbiota-derived metabolites show region-specific variations, we restricted this study to the North Indian cohort of CRC patients and control. A previous study by Dhakan et al. (2019) involving healthy individuals from Central and South India reported that the Indian gut microbiome and downstream metabolome are unique and are predominantly influenced by diet and regional factors.[14] Adding to the study, Gupta et al. (2019) observed a distinct CRC-related microbiome profile, marked by differences in the fecal metabolites of CRC patients compared to healthy individuals.[21] The authors have reported a strong association of Bacteroides intestinalis with the microbiome of Indian CRC patients. This gut bacterium is known to transform primary bile acids to secondary bile acids implicated in CRC and aligns with the present study’s findings.
Interestingly, we observed a greater butyrate abundance in the feces of patients with distal than proximal CRC tumors. This may be due to differences in microbial distribution and tumor metabolism. It has been reported that right and left-sided CRC tumors harbor distinct microbiomes, leading to variations in microbial metabolites depending on tumor location.[22] Future research exploring the composition and function of the microbiome with respect to tumor laterality is expected to provide additional insights into these differences.
Strengths and limitations of the study
The strengths of this study include its prospective design, the use of a sensitive analytical technique for metabolite detection, and the availability of complete clinical dataset.
To ensure sample stability, the samples were frozen immediately after collection. The containers were sterilized before use and sealed with parafilm after collection for storage. Transportation was done in dry ice to preserve sample integrity. Further, sample extraction was performed with precautions, like avoiding freeze-thaw cycles, and maintaining the samples at 4°C during extraction, following optimized protocols to ensure sample stability. All reagents used were of analytical grade. The GC-MS instrument was calibrated each time with the reference standard (OFN), and consistent retention time was ensured. At the post-analytical level, the spectra were subjected to baseline correction and normalized against peak intensity before detection and identification.
However, being an early report, there are some limitations to this study. First, we collected fecal samples at a single time point. This limits our ability to assess diurnal fluctuations in SCFA and bile acid levels. Second, the dietary habits of both patients with CRC and normal subjects were not controlled, which could have influenced the results. Third, the sample size was small, with a higher proportion of patients with advanced CRC.
CONCLUSIONS
The stool metabolite profile of patients with CRC was considerably altered compared with that of normal individuals. A positive association between fecal LCA and DCA levels and CRC was observed in our cohort. Future studies that consider the relationships of these metabolites with dietary patterns, lifestyle factors, and microbiome composition will further improve our understanding of these relationships.
Author contribution
AM: Concept and design, funding acquisition, critical revision of the manuscript and final approval; SV: Concept and design, funding acquisition, sample acquisition, project management, analysed data and wrote the manuscript; NS: Sample acquisition, data interpretation, analysis and final approval; SG: Statistical analysis and final approval; MC: Experimental studies, analysed results, manuscript writing, GC-MS supervision and final approval. The manuscript has been read and approved by all the authors.
Ethical approval
The research/study was approved by the Institutional Review Board at Rajiv Gandhi Cancer Institute and Research Centre, Institutional Review Board, number RGCIRC/IRB-BHR/81/2023, dated 28th August 2023.
Declaration of patient consent
The authors certify that they have obtained all appropriate patient consent.
Conflicts of interest
There are no conflicts of interest.
Use of artificial intelligence (AI)-assisted technology for manuscript preparation
The authors confirm that there was no use of artificial intelligence (AI)-assisted technology for assisting in the writing or editing of the manuscript and no images were manipulated using AI.
Supplementary material
Financial support and sponsorship: This study was funded by Rajiv Gandhi Cancer Institute and Research Centre, Scientific Committee, Project number: Res/SCM/58/2023/45.
References
- Secondary bile acids and short chain fatty acids in the colon: A focus on colonic microbiome, cell proliferation, inflammation, and cancer. Int J Mol Sci. 2019;20:1214.
- [CrossRef] [PubMed] [Google Scholar]
- Microbial metabolite dysbiosis and colorectal cancer. Gut Liver. 2023;17:190-203.
- [CrossRef] [PubMed] [Google Scholar]
- Decreased dietary fiber intake and structural alteration of gut microbiota in patients with advanced colorectal adenoma. Am J Clin Nutr. 2013;97:1044-52.
- [CrossRef] [PubMed] [Google Scholar]
- The level short chain fatty acids and HSP 70 in colorectal cancer and non-colorectal cancer. Acta Inform Med. 2018;26:160-3.
- [CrossRef] [PubMed] [Google Scholar]
- Fecal short-chain fatty acids are not predictive of colonic tumor status and cannot be predicted based on bacterial community structure. mBio. 2019;10:e01454-19.
- [CrossRef] [PubMed] [Google Scholar]
- Ratio of primary and secondary bile acids in feces: Possible marker for colorectal cancer? Dis Colon Rectum. 1999;42:668-72.
- [CrossRef] [PubMed] [Google Scholar]
- Association between low colonic short-chain fatty acids and high bile acids in high colon cancer risk populations. Nutr Cancer. 2012;64:34-40.
- [CrossRef] [PubMed] [Google Scholar]
- Significance of fecal deoxycholic acid concentration for colorectal tumor enlargement. Asian Pac J Cancer Prev. 2010;11:1541-6.
- [Google Scholar]
- Fecal metabolomic signatures in colorectal adenoma patients are associated with gut microbiota and early events of colorectal cancer pathogenesis. mBio. 2020;11:e03186-19.
- [CrossRef] [PubMed] [Google Scholar]
- Research on gut microbiota-derived secondary bile acids in cancer progression. Integr Cancer Ther. 2022;21:1-11.
- [CrossRef] [PubMed] [Google Scholar]
- Fecal levels of short-chain fatty acids and bile acids as determinants of colonic mucosal cell proliferation in humans. Nutr Cancer. 2002;42:186-90.
- [CrossRef] [PubMed] [Google Scholar]
- Asymptomatic colorectal neoplasia and fecal characteristics: A case-control study of subjects participating in the nottingham fecal occult blood screening trial. Dis Colon Rectum. 2002;45:1233-41.
- [CrossRef] [PubMed] [Google Scholar]
- Association between fecal bile acids and colorectal cancer: A meta-analysis of observational studies. Yonsei Med J. 2008;49:792-803.
- [CrossRef] [PubMed] [Google Scholar]
- The unique composition of Indian gut microbiome, gene catalogue, and associated fecal metabolome deciphered using multi-omics approaches. Gigascience. 2019;8:giz004.
- [CrossRef] [PubMed] [Google Scholar]
- Analysis of an Indian colorectal cancer faecal microbiome collection demonstrates universal colorectal cancer-associated patterns, but closest correlation with other Indian cohorts. BMC Microbiol. 2023;23:52.
- [CrossRef] [PubMed] [Google Scholar]
- Considerations in determining sample size for pilot studies. Res Nurs Health. 2008;2:180-91.
- [CrossRef] [PubMed] [Google Scholar]
- Hydrophobic bile acids, genomic instability, Darwinian selection, and colon carcinogenesis. Clin Exp Gastroenterol. 2008;1:19-47.
- [CrossRef] [PubMed] [Google Scholar]
- Secondary bile acids: An underrecognized cause of colon cancer. World J Surg Oncol. 2014;12:164.
- [CrossRef] [PubMed] [Google Scholar]
- Gut microbiota-derived short-chain fatty acids: impact on cancer treatment response and toxicities. Microorganisms. 2022;10:2048.
- [CrossRef] [PubMed] [Google Scholar]
- Formation of propionate and butyrate by the human colonic microbiota. Environ Microbiol. 2017;19:29-41.
- [CrossRef] [PubMed] [Google Scholar]
- Association of Flavonifractor plautii a flavonoid-degrading bacterium, with the gut microbiome of colorectal cancer patients in India. mSystems. 2019;4:e00438-19.
- [CrossRef] [PubMed] [Google Scholar]
- The comparison of fecal microbiota in left-side and right-side human colorectal cancer. Eur Surg Res. 2021;62:248-54.
- [CrossRef] [PubMed] [Google Scholar]


