
Translate this page into:
Interference of red cell parameters by an endogenous substance: An interesting case report
*Corresponding author: Priyadarshini Kumaraswamy Rajeswaran, MBBS, MD, Department of Pathology, PSG Institute of Medical Sciences, Off Avinashi Road, Peelamedu, Coimbatore, Tamil Nadu, 641004, India. drpriyadarshini.kr@gmail.com
-
Received: ,
Accepted: ,
How to cite this article: Rajeswaran PK, Kumar PN, Balagurunathan M, Arumugam J. Interference of red cell parameters by an endogenous substance: An interesting case report. J Lab Physicians. 2024;16:116-9. doi: 10.1055/s-0043-1772461
Abstract
A 6-month-old infant was brought to the hospital with fever, vomiting, loose stools, and abdominal distension. The venous blood sample was sent to the hematology laboratory for complete blood count (CBC). Analysis of the sample on the automated hematology analyzer showed a discrepancy in red blood cell count, hemoglobin, and hematocrit values. Examination of the blood sample revealed a cherry red color appearance. On centrifugation, the plasma was lactescent. This finding provided an essential clue to the patient’s diagnosis of severe hypertriglyceridemia. Turbidity of lactescent plasma interferes with CBC. Analytical errors in the CBC using an automated hematology analyzer caused by lactescent plasma and methods to resolve the false values will be discussed in this case report.
Keywords
hematology analyzer
hypertriglyceridemia
lactescent plasma
red cell parameters

INTRODUCTION
Hypertriglyceridemia may be due to primary or secondary causes. Primary hypertriglyceridemia is caused by either overproduction or defective clearance of various forms of lipids, which may be due to mutations in the genes involved in lipid metabolism. This can produce a lactescent plasma, the turbidity of which interferes with the complete blood count (CBC) estimation. In this article, we present a case of lactescent plasma found incidentally in a 6-month-old infant that, along with the other clinical findings, led to the diagnosis of familial hyperlipoproteinemia.
CASE REPORT
A 6-month-old male infant was admitted for 2 days’ history of progressive abdominal distension, vomiting, and loose stools. He also had intermittent low-grade fever for 10 days. The infant was deliveredat term through a normalvaginal delivery. The antenatal and postnatal periods were uneventful; he was exclusively breastfed since birth and had attained age-appropriate milestones. He was the second born of a nonconsanguineous marriage. There was no significant family history.
On examination, the child was alert and afebrile. General examination revealed no dysmorphic features and the vitals were stable. Abdomen examination revealed significant distension and massive hepatomegaly. Other systemic examinations were normal.
The blood sample sent for CBC analysis to the clinical pathology laboratory had a cherry red appearance, which, on centrifugation, separated into a creamy supernatant part (Figures 1 and 2). The blood sample was analyzed on an automated hematology analyzer (HA)—the Beckman Coulter LH-780. The HA generated CBC parameters as given in Table 1. This shows increased hemoglobin (Hb) and no correlation between the red blood cell (RBC) count, Hb, and hematocrit (Hct), that is, the rule of three that normally exists between these parameters was violated. The mean corpuscular hemoglobin (MCH) and mean corpuscular hemoglobin concentration (MCHC) were also found to be falsely elevated. The peripheral smear examination showed normocytic normochromic RBC with normal leukocytes and thrombocytosis. The hemoglobin repeated on a point-of-care instrument (EKF Diagnostics’ Hemo Control) gave a value of 13 g/dL.
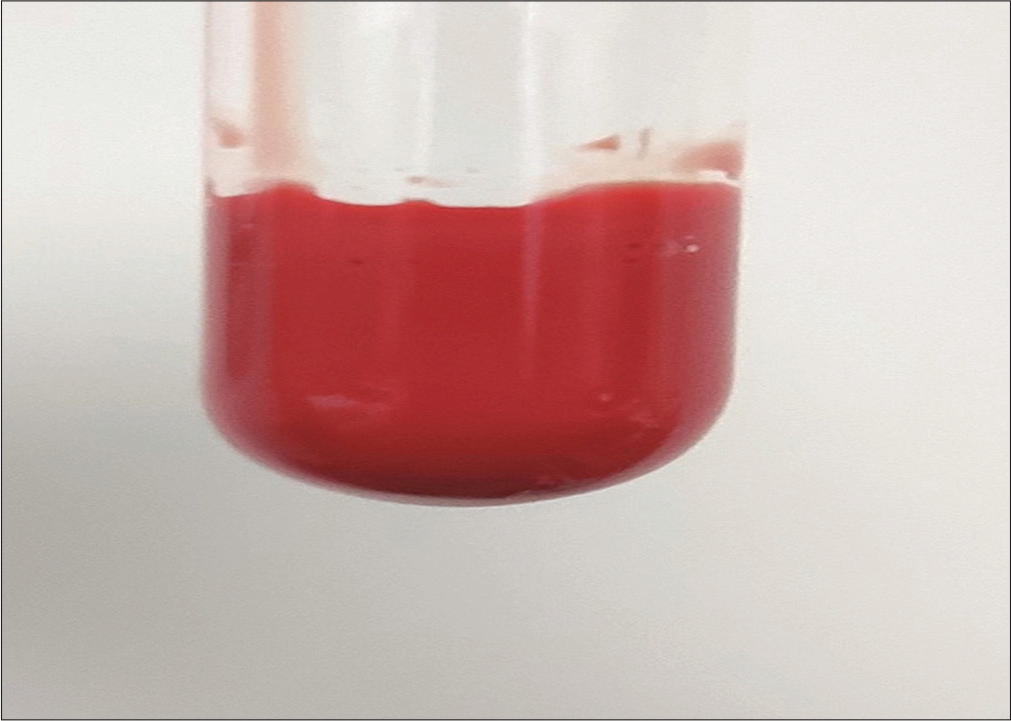
- Vacutainer with cherry red blood sample sent for complete blood count analysis.
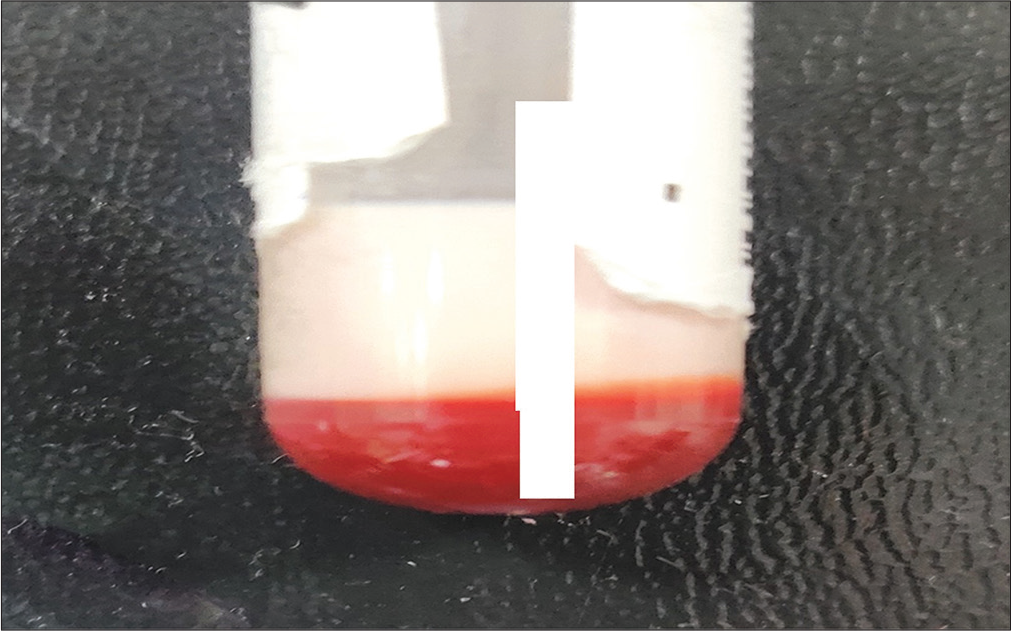
- The lactescent plasma appearance of the vacutainer blood sample after slow centrifugation.
| Parameter | At admission | At review | Reference range |
|---|---|---|---|
| Red cell count (×106/µL) | 3.89 | 3.79 | 3.9–5.3 |
| Hemoglobin (g/dL) | 21.9 | 10.2 | 11.5–14 |
| Haematocrit % | 30.7 | 30.7 | 30–40 |
| Mean corpuscular volume (fL) | 79.0 | 81.2 | 70–84 |
| Mean corpuscular hemoglobin (pg) | 56.4 | 26.8 | 24–30 |
| Mean corpuscular hemoglobin concentration (g/dL) | 71.4 | 33.1 | 30–36 |
| Red cell distribution width (%) | 14.2 | 25.9 | 10–15 |
| White blood cell—total count (×103/µL) | 15.9 | 12.9 | 6-18 |
| Neutrophil % | 34 | 23 | 21–46 |
| Lymphocyte % | 66 | 70 | 51–71 |
| Monocyte % | 0 | 5 | 2–10 |
| Eosinophils % | 0 | 2 | 1–6 |
| Basophil % | 0 | 0 | 0–2 |
| Platelet count (×103/µL) | 562 | 763 | 150–400 |
Further investigations revealed markedly elevated triglyceride (TGL) of 13,450 mg/dL (normal <150 mg/dL) and very low-density lipoprotein (VLDL) levels of 1,784 mg/dL (normal <30 mg/dL), with hypercholesterolemia of 402 mg/dL (normal <170 mg/dL). The high-density lipoprotein (HDL) level of 12 mg/dL (normal 40–60 mg/dl) and low-density lipoprotein (LDL) level of 32 mg/dL (normal <110 mg/dL) were very low. Ultrasonography of the abdomen revealed hepatomegaly.
Ophthalmology evaluation revealed grade 3 lipemia retinalis in both eyes. There were no cutaneous xanthomas. The urine was screened for metabolic errors and showed negative results for mucopolysaccharides, 2,4-dinitrophenylhydrazine (DNPH) test for alpha-keto acids, ferric chloride test, and Benedict’s test for reducing substances. Liver function tests were within normal limits. With the clinical presentation of hepatomegaly together with laboratory evidence of lactescent plasma and elevated TGLs, a provisional diagnosis of familial hyperlipoproteinemia (type IV) was made.
The infant was started on a low-fat diet, statins, fibrates, medium chain TGL (MCT) oil, omega 3 fatty acids, and vitamin supplements. Lipid profiles were performed on the parents and the elder sibling, where were found to be normal. Because of the increased probability of acute pancreatitis, baseline serum amylase and lipase levels were done in the infant and were found to be normal. There was a significant reduction in serum TGL (372 mg/dL) and cholesterol (229 mg/dL) after 7 days.
The infant improved symptomatically and was discharged after a week of hospital stay. The parents were advised on weaning and low-fat diet in complementary feed. On review after 2 weeks, the infant was doing fine. A blood sample for deoxyribonucleic (DNA) analysis to rule out glycogen storage disease or hyperlipoproteinemia was sent to an outside molecular laboratory. The exome sequencing panel consisted of 6,120 genes for clinical interpretation. Clinically relevant mutations were annotated using published literature variants and disease databases.[1-9] After analysis, no pathogenic variants causative of the above disorders were detected.
Hence, the possibilities of transient infantile hyperlipidemia or secondary hyperlipidemia were considered in this case. Further investigations to rule out secondary hyperlipidemia were planned, but the child did not return for follow-up visits.
DISCUSSION
Hypertriglyceridemia, defined as fasting serum or plasma TGL > 150 mg/dL or above the 95th percentile for age and sex, can be caused by either primary of secondary disorders of TGL metabolism. Primary hypertriglyceridemia is caused by a genetic defect causing overproduction and/or impaired lipoprotein removal. The impaired removal can be due to abnormal lipoprotein or its receptor. Familial hypertriglyceridemia is rare and has an incidence of 1 in 1,000 pediatric cases.[10,11] Familial hyperlipoproteinemia (HLP) has been classified into five phenotypes by Frederickson.[12]
Secondary causes of hypertriglyceridemia in children include a high-fat diet, obesity, diabetes mellitus, renal diseases, hypothyroidism, some autoimmune disorders, β thalassemia major, and drugs (estrogen, antipsychotics, and tamoxifen).[10,13-15]
The principle of the Beckman HA is based on electrical impedance.[16] The cells are counted and sized based on the measurement of changes in resistance during cell passage through a small defined opening between two electrodes. Despite technological advancements in automated HA, endogenous substances in the blood, such as lipids, bilirubin, and paraproteins, are known to interfere with blood count analysis. Studies have found hyperlipidemia to significantly increase the Hb, MCH, MCHC, Hct, mean cell volume (MCV), total white blood cell (WBC), and platelet counts.[17-20] These spurious high values are attributed to the turbidity and formation of tiny droplets by the high lipid content in the blood sample, thereby causing interference with their estimation.
The lipids may form small droplets in vitro that disturb platelet count estimation. Studies are available[21,22] where the effects of hyperchylomicronemia on platelet count estimation are compared between two types of HA. It was found that a false moderate increase in platelet count was obtained on the analyzer, which uses an optical method for counting cells. In comparison, there was no spurious increase in platelet count when using the HA, which measures the cells by electrical impedance. In our case, there was no involvement of the platelet count since the counts were the same in both on admission and review samples, and our HA estimates platelet count using electrical impedance.
Falsely high Hb and MCHC are found in hyperlipoproteinemia caused due to increased chylomicrons.[19] This turbidity interferes with light scatter and the absorption of light, resulting in a false increase of Hb. Due to the incorrect value, the calculated RBC parameters in the HA are also erroneous. In our case, there was no spuriously high MCV, and the peripheral smear examination also revealed normocytic normochromic RBCs.
There are various methods to resolve spurious RBC values. Isovolumetric replacement of hyperlipidemic plasma after centrifugation with normal saline and ether extraction of lipids are some of the methods described.[19] Alternatively, using a point-of-care instrument provides accurate hemoglobin results that are unaffected by hypertriglyceridemia. A study by Zeng et al[23] found a simple step of low-speed centrifugation to give reliable results of RBC parameters in highly lipemic blood samples without any special equipment. After low-speed centrifugation of the blood sample, the separated plasma is removed and the remaining blood sample was rerun in the HA. A correction formula was used to calculate the correct Hb, MCH, and MCHC values. When a patient’s sample is found to be lipemic, it is essential to notify the treating physician to determine the cause of hyperlipidemia. Early detection also provides appropriate management to the patient, preventing complications such as atherosclerosis, myocardial infarction, and acute pancreatitis in children.
CONCLUSIONS
Pathologists must be aware of preanalytical and analytical variables within the laboratory causing spurious CBC results. An appropriate protocol to identify lipemic samples and procedure to handle such samples should be established. Regardless of the interfering substance, there should be a prompt physician notification to ensure timely patient management.
Conflict of interest
None declared.
Funding
None.
References
- ClinVar: public archive of interpretations of clinically relevant variants. Nucleic Acids Res. 2016;44:D862-D868.
- [CrossRef] [PubMed] [Google Scholar]
- Mendelian Inheritance in Man. A Catalog of Human Genes and Genetic Disorders (12th ed). Baltimore, MD: Johns Hopkins University Press; 1998.
- [Google Scholar]
- The NHGRI GWAS catalog, a curated resource of SNP-trait associations. Nucleic Acids Res. 2014;42:D1001-D1006.
- [CrossRef] [PubMed] [Google Scholar]
- The Human Gene Mutation Database: towards a comprehensive repository of inherited mutation data for medical research, genetic diagnosis and next-generation sequencing studies. Hum Genet. 2017;136:665-677.
- [CrossRef] [PubMed] [Google Scholar]
- Easy retrieval of single amino-acid polymorphisms and phenotype information using SwissVar. Bioinformatics. 2010;26:851-852.
- [CrossRef] [PubMed] [Google Scholar]
- 1000 Genomes Project Consortium. A global reference for human genetic variation. Nature. 2015;526:68-74.
- [CrossRef] [PubMed] [Google Scholar]
- Exome Variant Server NHLBI GO Exome Sequencing Project (ESP) http://evs.gs.washington.edu/EVS/
- [Google Scholar]
- ToMMo Japanese Reference Panel Project. Rare variant discovery by deep whole-genome sequencing of 1,070 Japanese individuals. In: Nat Commun. Vol 6. 2015. p. :8018.
- [CrossRef] [PubMed] [Google Scholar]
- dbSNP: the NCBI database of genetic variation. Nucleic Acids Res. 2001;29:308-311.
- [CrossRef] [PubMed] [Google Scholar]
- An infant with hypertriglyceridemia presenting as failure to thrive: a case report. Int J Contemp Pediatrics. 2021;8:590-593.
- [CrossRef] [Google Scholar]
- The prevalence and etiology of extreme hypertriglyceridemia in children: data from a tertiary children's hospital. J Clin Lipidol. 2018;12:305-310.
- [CrossRef] [PubMed] [Google Scholar]
- Disorders of lipoprotein metabolism In: Kasper DL, Braunwald E, Fauci AS, eds. Harrison's Principles of Internal Medicine (16th ed). New York, NY: McGraw-Hill; 2005. p. :2286-2298.
- [Google Scholar]
- A diabetic patient with abdominal pain and lactescent serum. Hong Kong J Emerg Med. 2008;15:139-142.
- [CrossRef] [Google Scholar]
- Hypertriglyceridemia thalassemia syndrome: a report of 4 cases. Indian J Hematol Blood Transfus. 2014;30:288-291.
- [CrossRef] [PubMed] [Google Scholar]
- Clinical Hematology Theory and Procedures (6th ed). Philadelphia, PA: Wolters Kluwer; 2018.
- [Google Scholar]
- The effects of hyperglycemia and hyperlipidemia onblood indices. Iran South Med J. 2016;18:1179-1185.
- [Google Scholar]
- Spurious counts and spurious results on haematology analysers: a review. Part II: white blood cells red blood cells, haemoglobin, red cell indices and reticulocytes. Int J Lab Hematol. 2007;29:21-41.
- [CrossRef] [PubMed] [Google Scholar]
- Spurious counts and spurious results on haematology analysers: a review. Part I: platelets. Int J Lab Hematol. 2007;29:4-20.
- [CrossRef] [PubMed] [Google Scholar]
- The effects of Hyperglycemia and Hyperlipidemia on blood indices. J Adv Pharm Educ Res. 2020;10:109-112.
- [Google Scholar]
- Effects of hypertriglyceridemia on platelet counts in automated hematologic analysis. Ann Intern Med. 1999;130:452.
- [CrossRef] [PubMed] [Google Scholar]
- Interference from lipemia in cell countby hematologyanalyzers. Clin Chem. 1996;42:987-988.
- [CrossRef] [PubMed] [Google Scholar]
- A simple, fast correction method of triglyceride interference in blood hemoglobin automated measurement. J Clin Lab Anal. 2013;27:341-345.
- [CrossRef] [PubMed] [Google Scholar]


