
Translate this page into:
Pattern analysis of activated partial thromboplastin time clot waveform for detection of hemostatic changes in sepsis patients

*Corresponding author: Abinaya AmirthaKatesan, Department of Pathology, PSG Institute of Medical Sciences and Research, Coimbatore, Tamil Nadu, India. abisindu12@gmail.com
-
Received: ,
Accepted: ,
How to cite this article: AmirthaKatesan A, Senthil Kumar M, Kumar P. Pattern analysis of activated partial thromboplastin time clot waveform for detection of hemostatic changes in sepsis patients. J Lab Physicians. 2025;17:39-44. doi: 10.25259/JLP_175_2024
Abstract
Objectives:
Coagulation is a dynamic process. Quantitative data on fibrin polymerization can be obtained by thoroughly analyzing the optical profile of the process of coagulation. This study aims to identify the changes in the activated partial thromboplastin time (APTT) clot waveform analysis (CWA) in sepsis.
Materials and Methods:
Blood samples of sepsis patients from the intensive care unit received for evaluation of APTT were taken for study. The samples were run in Automated Coagulation Analyzer Sysmex - coagulation system (CS) 2400, and APTT CWA was done.
Statistical analysis:
Statistical analysis was performed using IBM Statistical Package for the Social Sciences Statistics for Windows, version 20.0 NY. The clot waveform of APTT was analyzed in patients with sepsis. Sensitivity, specificity, positive, and negative predictive values of biphasic form in detecting disseminated intravascular coagulation (DIC) in sepsis patients were calculated.
Results:
A total of 133 blood samples were analyzed. Prolonged APTT was seen in 23% (n = 44). Among the patients with prolonged APTT, 79.5% (n = 35) cases had an altered CWA. In patients with altered CWA, 34% (n = 45) had sepsis with an abnormal wave pattern, and 11% (n = 15) had a biphasic waveform (BPW). DIC was diagnosed in 41% of cases (n = 55). The APTT CWA of sepsis patients with DIC revealed abnormal wave patterns in 31% (n = 17) and biphasic waveforms (BPW) in 18% (n = 10). The sensitivity, specificity, positive, and negative predictive values of the biphasic waveform in detecting DIC in sepsis patients were 18%, 93.5%, 66.6%, and 61.8%, respectively.
Conclusions:
The study demonstrated significant changes in the APTT CWA in sepsis. The presence of abnormal wave patterns in sepsis suggests liver dysfunction progressing to liver failure. A BPW in sepsis has a high specificity for DIC, which warrants immediate clinical intervention.
Keywords
Activated partial thromboplastin time
Biphasic waveform
Clot waveform analysis
Disseminated intravascular coagulation
Sepsis

INTRODUCTION
Coagulation is a dynamic process, and a complete analysis of the optical profile, including the evaluation of the kinetics of fibrin formation, can yield quantitative information on the time, acceleration, rate, and magnitude of change at defined time intervals during the process of fibrin polymerization.[1,2] The coagulation analyzer CS-2400 (Sysmex) contains a photometer design and software capable of processing the optical signal online, which can be graphically represented as an optical profile or “clot waveform” constructed by plotting changes in light transmittance instead of absorbance.[3]
Sepsis is a life-threatening organ dysfunction caused by dysregulated host response to infection. If not recognized early and managed promptly, it can lead to severe complications such as septic shock, multiple organ failure, disseminated intravascular coagulation (DIC), and ultimately death.[4,5] It is most frequently a serious complication of infection, particularly in low- and middle-income countries. According to studies, sepsis kills 11 million people every year, many of them being children.[6-8] Suspecting sepsis is the first major step toward early recognition and diagnosis. Clot waveform analysis (CWA) of activated partial thromboplastin time (APTT) in sepsis patients can aid in the early detection of hemostatic abnormality, helping in prompt diagnosis and treatment.[9] This study is aimed at identifying the changes in the APTT CWA that can be used as an indicator for detecting hemostatic abnormality in sepsis patients and can be used for timely diagnosis, preventing life-threatening complications.
MATERIALS AND METHODS
This was a prospective study conducted for a period of 6 months in an academic institute in south India. The study was approved by the Institutional Human Ethics Committee.
Patients with clinically proven sepsis (according to Sequential Organ Failure Assessment [SOFA] score) admitted to the intensive care unit (ICU) were taken for the study. Blood samples for the measurement of APTT taken after admission to the ICU were taken for analysis. Patients with chronic liver disease and bleeding disorders were excluded.
The SOFA score, previously known as the sepsis-related organ failure assessment score, is used to determine the patient’s status and extent of function of their organs during their stay in an ICU.[10] The score is calculated on admission and every 24 h until discharge using the parameters measured during the past 24 h. The total score (0–4) is based on individual scores obtained from six different systems (respiratory, coagulation, hepatic, cardiovascular, neurological, and renal systems). A score of more than or equal to one was categorized as patients with sepsis.
Information regarding sex, age, and other laboratory parameters indicating sepsis were obtained from the hospital information system. The blood samples of the selected patients were collected in vacuum tubes containing a 1:9 volume of 3.2% tri-sodium citrate. All the pre-analytical parameters were strictly adhered to and the samples were run in Automated Coagulation Analyzer Sysmex - CS 2400. The APTT was then measured in Coagulation Analyzer Sysmex - CS 2400 using the principle of photometric detection of the coagulation endpoint. The reference range for APTT was calculated from the mean and standard deviation of the normal study population. The calculated normal range for APTT was 25–34 s.
A photometer design and software that can analyze the optical signal online are features of the APTT Coagulation Analyzer CS-2400. The optical signal can be graphically represented as an optical profile or “clot waveform,” which is created by charting variations in light transmittance rather than absorbance.[8] By measuring light absorbance, the noise-to-signal ratio can be decreased, and false trips can be prevented throughout the recording period that is used to calculate the endpoint or clotting time. The photo-optical system’s low noise-to-signal ratio makes it possible to monitor light transmission directly, which improves the qualitative capacity to identify subtle alterations in the clot waveform. Access to qualitative data, such as the rate of clot formation that was unavailable using the manual method, is made possible by the analyzer. A graphical representation of the data makes it easier to distinguish between common waveform anomalies linked to certain hemostasis disorders. Furthermore, the first derivative, second derivative, and transmission waveform are among the objective and quantifiable facts that may be obtained from it[11,12] [Figure 1].
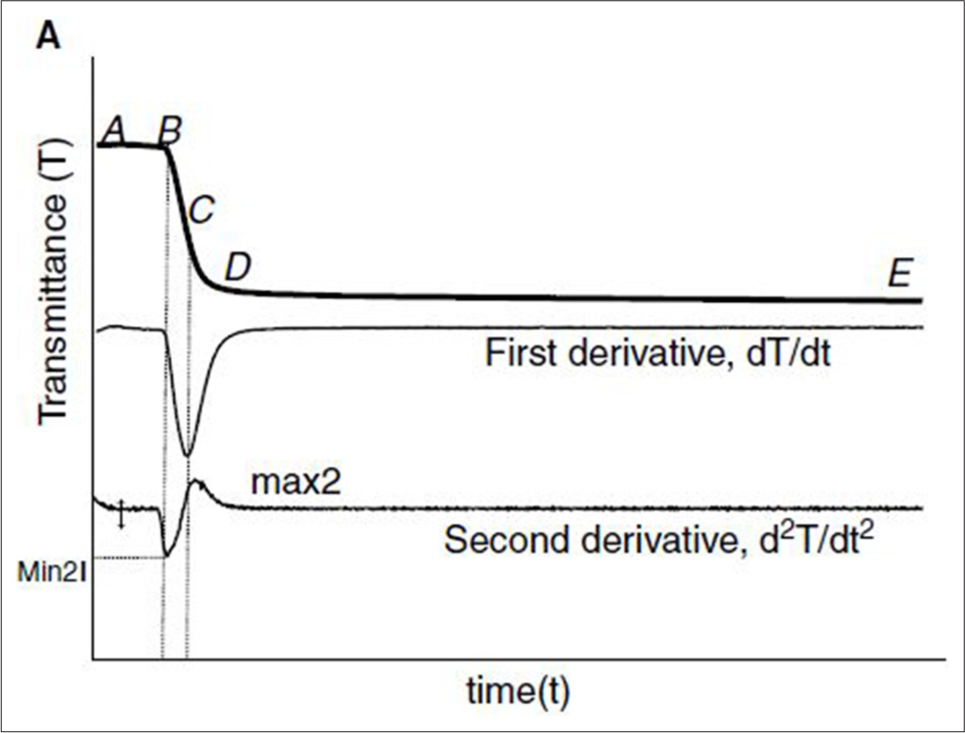
- Activated partial thromboplastin time (APTT) clot waveforms- Clot waveform of normal plasma by monitoring of transmittance. The upper graph shows the changes in light transmittance observed during the performance of APTT with normal reference plasma by CS 2400 (Sysmex). Point “A” marks the beginning of the recording by the instrument, which occurs 8 s after the addition of calcium chloride. Point “B” indicates the initiation of coagulation. (A–B) The clot waveform is separated into the pre-coagulation phase, (B–D) the coagulation phase, and (D–E) the post-coagulation phase. The second graph denotes the first derivative curve and the third graph denotes the second derivative curve.
The clot formation velocity is indicated by the first derivative curve, and the largest absolute value of the first derivative is regarded as the maximum velocity. The acceleration of clot formation is seen by the second derivative curve. The maximum acceleration and maximum deceleration (the sharpest point of the deceleration slope) are the two parameters that are measured in the second derivative curve. Depending on whether the curve is transmittance or absorbance, these parameters have different names. Maximum velocity is often referred to as “Min1,” maximum acceleration as “Min2,” and maximum deceleration as “Max2” in the transmittance waveform, which is the most widely used form. Since transmittance and absorbance follow the exact opposite patterns, maximum velocity, maximum acceleration, and maximum deceleration are referred to as “Max1,” “Max2,” and “Min2” accordingly[13-15] [Figure 1].
In this study, we have analyzed the transmittance waveform. The transmittance waveform has three phases with time in seconds along the X axis and transmission of light in percentage on the Y axis. The initial pre-coagulation phase (A-B) is the first part of the trace, which represents the time from the start of the signal to the onset of coagulation. Once the clotting is initiated, there is a decrease in light transmission, which is denoted by the slope in the trace (B-D). At the end of coagulation, the light transmission is stabilized, which is marked by the linear segment (D–E).[13]
The APTT transmission waveforms of sepsis patients were analyzed. Three patterns were obtained by deciphering the transmission waveforms from A (Normal/Prolonged/Slope), B (Steep/Slow/Normal/Shallow), and D-E (Plateau).
Sigmoid pattern - Normal [Figure 1]
-
Abnormal wave pattern - included two wave patterns [Figures 2 and 3][16]
Prolonged pre-coagulation phase (A-B)
Weak clot formation has prolonged pre-coagulation (A-B) along with a slow slope (B-D).
Biphasic wave pattern (BPW) - (Slope A-B, Steep slope B-D) [Figure 4].[17,18]

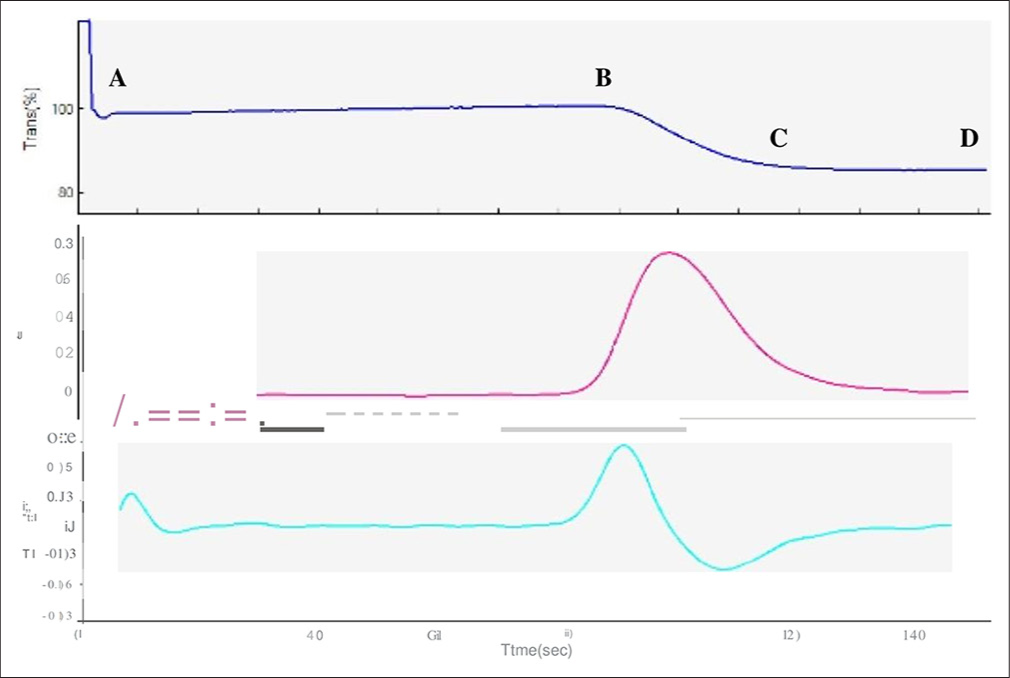
- APTT clot waveform, prolonged pre coagulation pattern–65 yr-old male diagnosed with septicaemia, APTT 40 secs (prolonged). Transmittance wave (top most graph) showed markedly prolonged pre coagulation phase (A-B), a normal coagulation phase (B-C) and post coagulation phase (C-D). Blue graph - Transmittance wave form, Purple graph-First derivative curve, Green graph- Second derivative curve.
- Activated partial thromboplastin time (APTT) clot waveform - Weak clot formation pattern - 55-year-old female patient with clinical diagnosis of sepsis and prolonged APTT (44 s). The liver function tests were deranged with increased liver enzymes. (A–B) The transmittance wave (top most graph) revealed marked prolongation of both pre-coagulation and (B–D) coagulation phase. Blue graph- Transmittance wave form, Purple graph- First derivative curve, Green graph -Second derivative curve
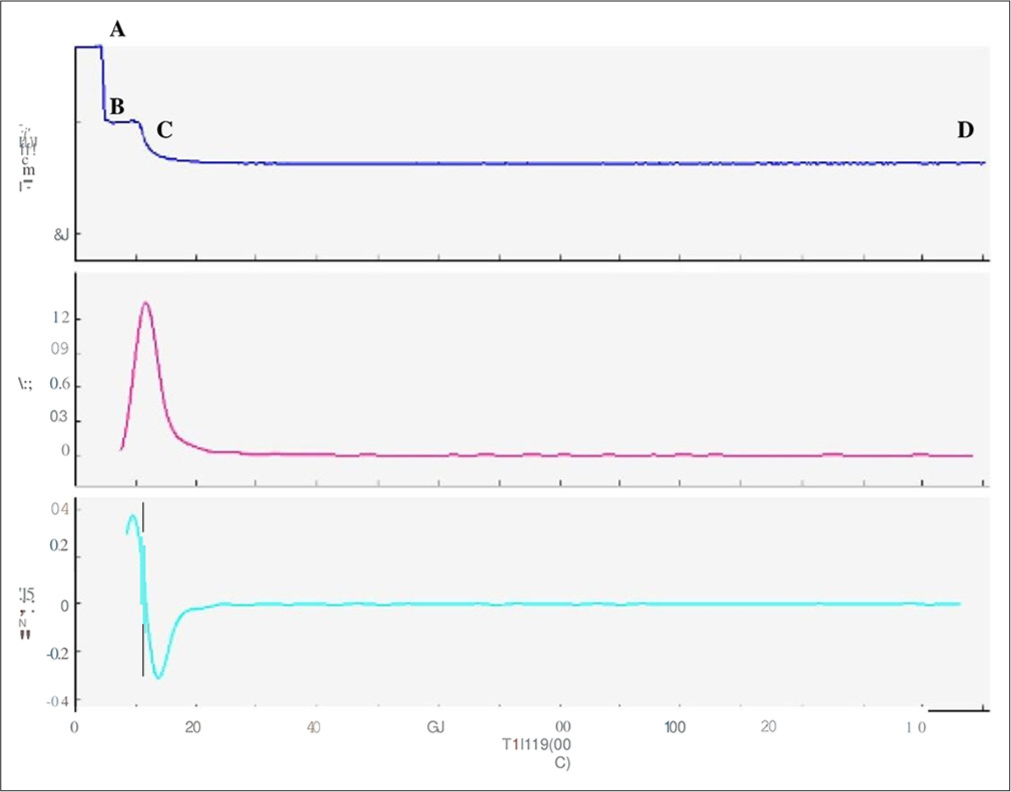
- APTT clot waveform- Biphasic wave pattern – 60 yrs-old male patient had hematuria with decreased platelet count, decreased fibrinogen, increased D-dimer and a normal APTT (32 sec). Even with normal APTT, the transmittance wave (top most graph) showed the initial plateau phase (A-B) before the commencement of the clot formation was replaced by a slope, the coagulation and the post coagulation phases are similar to a normal CW (biphasic wave pattern).Blue graph - Transmittance wave form, Purple graph-First derivative curve, Green graph- Second derivative curve
Sepsis patients with DIC were identified, and the clot waveforms in such patients were analyzed. The International Society on Thrombosis and Hemostasis (ISTH) group produced a simple scoring system for the diagnosis of DIC depending on the platelet count, the Prothrombin time (PT), the fibrinogen level, and D-Dimer. A total score of more than or equal to 5 was diagnosed as DIC.[17-21]
Cross-tabulation of the wave pattern and the coagulation parameters was done, and sensitivity, specificity, positive, and negative predictive values of biphasic form in detecting DIC in sepsis patients were calculated.
Data analysis
Data entry was made in Microsoft Excel version 16.49. Statistical analysis was performed using the IBM Statistical Package for the Social Sciences Statistics for Windows, version 20.0 NY. The clot waveform of APTT was analyzed in patients with sepsis. Sensitivity, specificity, positive, and negative predictive values of biphasic form in detecting DIC in sepsis patients were calculated.
RESULTS
A total of 133 blood samples from patients with sepsis were received in the Department of Hematology during the study period. Among them, 66% of patients were males (n = 88), and the remaining 44% were females (n = 45). Ninety-four percent (n = 126) were adults aged more than 18 years, and 6% (n = 7) belonged to the pediatric age group.
CWA in sepsis
Normal plasma has an initial short pre-coagulation phase, a steep slope coagulation phase, and a plateau post-coagulation phase. 55% of patients with sepsis (n = 73) had a normal pattern CWA (Sigmoid pattern).
Prolongation of APTT was seen in 23% (n = 44), and 77% had normal APTT (n = 89). Among the patients with prolonged APTT (n = 44), 79.5% (n = 35) cases had an altered CWA. The mean APTT of patients with normal CWA is 35 s, whereas the mean APTT of patients with altered CWA is 46 s.
Amongst the 133 patients, 34% (n = 45) had abnormal wave patterns of CWA [inclusive of prolonged pre-coagulation (n = 24) and weak clot formation (n = 21)], and 11% (n = 15) had a biphasic waveform. Almost all patients (99%) with abnormal wave patterns had deranged liver function tests. Deranged liver function included newly detected elevated liver enzymes alkaline phosphatase, alanine transaminase, and aspartate aminotransferase with previously measured normal values.
In biphasic waveform (BPW), the initial plateau phase (A-B) before the commencement of the clot formation is replaced by a slope; the coagulation and the post-coagulation phase are similar to a normal clot wave form (CW). The slope_1 (A-B) value is >0.25% T/s.[17,18] BPW was seen in 11% of sepsis patients (n = 15) [Figure 4].[22-24]
CWA in sepsis patients with DIC
Of the 133 patients with sepsis, applying the score formulated by ISTH based on the platelet count, the PT, the fibrinogen level, and D-Dimer, a score was obtained, and patients with a total score of more than or equal to 5 were categorized as DIC. DIC was diagnosed in 41% of cases (n = 55). The mean APTT of patients with DIC was 50 s. The APTT CWA of sepsis patients with DIC revealed 51% (n = 28) with a normal wave pattern. Abnormal wave pattern was observed in 31% (n = 17), and 18% (n = 10) showed a biphasic waveform. In the 10 cases of DIC with biphasic waveform, 9 cases (90%) had normal APTT, thus formulating the presence of a biphasic waveform as a more sensitive marker for the detection of DIC even before the prolongation of APTT.
The sensitivity, specificity, positive predictive value, and negative predictive value of biphasic waveform in detecting DIC in patients with sepsis were 48%, 93.5%, 66.6%, and 61.8%, respectively.
DISCUSSION
Sepsis is a medical emergency characterized by organ dysfunction brought on by a dysregulated host response to infection. It can avert terrible consequences such as DIC and multiple organ failure if detected early. Thus, for a better prognosis in sepsis, continuing coagulation monitoring is crucial. When coagulation parameters such as PT and APTT are examined mechanically, the results only reveal the coagulation disorder; they do not disclose everything about the coagulation process itself. The coagulation system is analyzed by the fully automated coagulation analyzer using a photo-optical method to visualize the clot’s waveforms CWA. As a component of a standard APTT examination, CWA is a quick and affordable technique.
The clot waveform depicts both quantitative and qualitative parameters. The first and the second derivative curves depict the velocity and acceleration of the clot formation, respectively. In this study, we have analyzed the transmittance waveform.
We aimed to evaluate the changes in APTT CWA in patients with sepsis. APTT was prolonged in 33% (n = 44), of which 79.5 % (n = 35) showed an abnormal CWA. The CWA performed on the 133 patients with sepsis demonstrated a normal pattern in 55% (n = 73), and the rest showed an abnormal APTT CWA. Rahmawati et al. described an abnormal CWA in 83% of patients which is more when compared to our study.[9] Patient selection, i.e., recruitment of the study population from the ICU, could have resulted in the presence of a higher percentage of normal CWA, which can be because of the earlier initiation of antithrombotic prophylaxis in these patients.
An abnormal CWA was seen in the remaining 45% of patients with sepsis, out of which 34% had an abnormal wave pattern (prolonged pre-coagulation and weak clot formation), and 11% had a biphasic waveform (BFW). Ruberto et al. described that a prolonged pre-coagulation pattern characterized by a markedly prolonged pre-coagulation phase is seen in patients with abnormal liver function tests.[22] The study demonstrated an abnormal wave pattern in 45% of patients with sepsis who also demonstrated an abnormal liver function test. Since liver failure is a common complication of sepsis, the presence of an abnormal wave pattern with prolonged pre-coagulation pattern in patients with sepsis can suggest initial stages of liver dysfunction. Hence, the presence of this abnormal pattern in patients with sepsis can be used as an indicator of liver dysfunction.
It was observed by Downey et al. that a patient with DIC presented with an abnormal and characteristically distinct transmittance waveform appearance on the APTT assay called the biphasic waveform (BFW).[23,24] BFW is a distinctive waveform seen mainly in patients with DIC, even though it can also occur in patients with a non-overt DIC. The normal plateau, pre-coagulation phase (A-B), is replaced by a steep slope. This can be measured by the amount of light transmitted at 25 s. The time period of 25 s was taken considering the low normal value of APTT. In a normal CWA, the amount of light transmitted at 25 s is 100%, whereas in a BPW, there is an immediate and progressive decrease in light transmission. This is due to the activation of clot formation immediately following the recalcification of plasma due to the increased presence of procoagulant factors. Toh et al. demonstrated that recalcification of plasma induces a rapid formation of precipitate in samples containing increased C-reactive protein (CRP) and very low-density lipoprotein (VLDL), which are procoagulant factors initiating clot formation by enhancing prothrombinase complex. The patients who demonstrated a BPW in the study also showed increased CRP and VLDL levels in their plasma, thus correlating with Toh et al.[25-27] Downey et al. explained that biphasic waveform is very sensitive and can be seen even before the prolongation of APTT (non-overt DIC).[23] Similarly, in this study, nine out of ten cases with BFW had normal APTT but progressed to DIC.
The study by Downey et al. showed a sensitivity and specificity of BPW in detecting DIC at 97.6% (95% confidence interval [CI]: 85.6–99.9%) and 98% (95% CI: 96.6–98.9%), respectively.[23] Toh et al. demonstrated a sensitivity, specificity, and positive predictive value of the BPW for DIC as 97.6%, 98%, and 74%, respectively. This study demonstrated a sensitivity and specificity of 48% and 93.5%, respectively. The positive predictive value and negative predictive value of biphasic waveform in detecting DIC in patients with sepsis were 66.6% and 61.8%, respectively.[25] The lower sensitivity of BPW in this study can be attributed to the selection of the study population from ICUs. Early initiation of antithrombotic prophylaxis to patients with sepsis in intensive care may result in a normal wave pattern in the APTT CWA, thus decreasing the sensitivity of BPW in detecting DIC. Hence, CWA done before initiation of anti-thrombotic prophylaxis will be much more sensitive in detecting DIC. The specificity and the positive predictive value remain high, suggesting the presence of BPW in patients with sepsis, indicating that the patient is going into a hemostatic abnormality.
CONCLUSIONS
The study demonstrated significant changes in the APTT CWA in patients with sepsis. The presence of abnormal wave patterns in sepsis suggests liver dysfunction progressing to liver failure. A BPW, even with a normal APTT in sepsis, has a high specificity for the occurrence of DIC. Hence, a biphasic waveform in a patient with sepsis warrants immediate clinical intervention to prevent the occurrence of DIC. In recent times, the CWA has been accepted to have a greater potential in providing intricate information about the mechanism of clot formation than the standardized clot time. Efforts have been made to standardize the assay; however, further research in this field is required for proper clinical application. CWA in various clinical conditions such as bleeding disorders, patients on anticoagulant therapy, and patients with lupus anticoagulant can provide detailed insights about the mechanism of hemostasis which can aid in prompt diagnosis and management of patients. Nevertheless, as studies are limited to small cohorts, extensive prospective clinical trials are mandatory to make the leap to clinical application.
Author contribution
AAK and PK: Conceptualization, data curation, formal analysis, software, and writing – original draft, writing – review and editing; MSK: Methodology, resources, analysis.
Ethical approval
The research/study was approved by the Institutional Review Board at PSG Institution Human Ethics Committee, number PSG/IHEC/2021/Appr/Exp/261, dated 19th November.
Declaration of patient consent
Patient’s consent not required as patients identity is not disclosed or compromised.
Conflicts of interest
There are no conflicts of interest.
Use of artificial intelligence (AI)-assisted technology for manuscript preparation
The authors confirm that there was no use of artificial intelligence (AI)-assisted technology for assisting in the writing or editing of the manuscript and no images were manipulated using AI.
Financial support and sponsorship: Nil.
References
- Towards standardization of clot waveform analysis and recommendations for its clinical applications. J Thromb Haemost. 2013;11:1417-20.
- [CrossRef] [PubMed] [Google Scholar]
- Properties of optical data from activated partial thromboplastin time and prothrombin time assays. Thromb Haemost. 1997;78:1079-87.
- [CrossRef] [PubMed] [Google Scholar]
- Clot waveform analysis using CS-2000i™ distinguishes between very low and absent levels of factor VIII activity in patients with severe haemophilia A. Haemophilia. 2017;23:e427-35.
- [CrossRef] [Google Scholar]
- The Third International consensus definitions for sepsis and septic shock (sepsis-3) JAMA. 2016;315:801-10.
- [CrossRef] [PubMed] [Google Scholar]
- Diagnosis and management of sepsis. Clin Med (Lond). 2018;18:146-9.
- [CrossRef] [PubMed] [Google Scholar]
- Sepsis in the intensive care unit. Surgery (Oxf). 2015;33:565-71.
- [CrossRef] [PubMed] [Google Scholar]
- Update of sepsis in the intensive care unit. J Innate Immun. 2017;9:441-55.
- [CrossRef] [PubMed] [Google Scholar]
- The prevalence, risk factors, and outcomes of sepsis in critically ill patients in China: A multicenter prospective cohort study. Front Med (Lausanne). 2020;7:593808.
- [CrossRef] [PubMed] [Google Scholar]
- Comparison between clot waveform analysis (CWA) of normal and abnormal aPTT of sepsis patients in Dr. Hasan Sadikin Hospital Bandung. J Phys Conf Ser. 2019;1246:012044.
- [CrossRef] [Google Scholar]
- Comparison of SOFA score, SIRS, qSOFA, and qSOFA + L Criteria in the diagnosis and prognosis of sepsis. Eurasian J Med. 2021;53:40-7.
- [CrossRef] [PubMed] [Google Scholar]
- Clot waveform analysis: Where do we stand in 2017? Int J Lab Hematol. 2017;39:561-8.
- [CrossRef] [PubMed] [Google Scholar]
- The utility of activated partial thromboplastin time (aPTT) clot waveform analysis in the investigation of hemophilia A patients with very low levels of factor VIII activity (FVIII: C) Thromb Haemost. 2002;87:436-41.
- [CrossRef] [PubMed] [Google Scholar]
- Update on the clot waveform analysis. Clin Appl Thromb Hemost. 2020;26:1076029620912027.
- [CrossRef] [PubMed] [Google Scholar]
- Optimal wavelength for the clot waveform analysis: Determination of the best resolution with minimal interference of the reagents. Int J Lab Hematol. 2019;41:316-24.
- [CrossRef] [PubMed] [Google Scholar]
- A study of atypical APTT derivative curves on the ACL TOP coagulation analyser. Int J Lab Hematol. 2011;33:67-78.
- [CrossRef] [PubMed] [Google Scholar]
- Usefulness of the second-derivative curve of activated partial thromboplastin time on the ACL-TOP coagulation analyzer for detecting factor deficiencies. Blood Coagul Fibrinolysis. 2016;27:474-6.
- [CrossRef] [PubMed] [Google Scholar]
- Disseminated intravascular coagulation. Findings in 346 patients. Thromb Haemost. 1980;43:28-33.
- [CrossRef] [PubMed] [Google Scholar]
- Towards definition, clinical and laboratory criteria, and a scoring system for disseminated intravascular coagulation. Thromb Haemost. 2001;86:1327-30.
- [CrossRef] [Google Scholar]
- Disseminated intravascular coagulation: Testing and diagnosis. Clin Chim Acta. 2014;436:130-4.
- [CrossRef] [PubMed] [Google Scholar]
- Expert consensus for the treatment of disseminated intravascular coagulation in Japan. Thromb Res. 2010;125:6-11.
- [CrossRef] [PubMed] [Google Scholar]
- Criteria for diagnosis of DIC based on the analysis of clinical and laboratory findings in 345 DIC patients collected by the Research Committee on DIC in Japan. Bibl Haematol. 1983;49:265-75.
- [CrossRef] [PubMed] [Google Scholar]
- Clot wave analysis and thromboembolic score in liver cirrhosis: Two opposing phenomena. Int J Lab Hematol. 2017;39:369-74.
- [CrossRef] [PubMed] [Google Scholar]
- Novel and diagnostically applicable information from optical waveform analysis of blood coagulation in disseminated intravascular coagulation. Br J Haematol. 1997;98:68-73.
- [CrossRef] [PubMed] [Google Scholar]
- Early identification and prognostic implications in disseminated intravascular coagulation through transmittance waveform analysis. Thromb Haemost. 1998;80:65-9.
- [CrossRef] [PubMed] [Google Scholar]
- Waveform analysis of clotting test optical profiles in the diagnosis and management of disseminated intravascular coagulation (DIC) Clin Lab Haematol. 2002;24:321-7.
- [CrossRef] [PubMed] [Google Scholar]
- Biphasic transmittance waveform in the APTT coagulation assay is due to the formation of a Ca(++)-dependent complex of C-reactive protein with very-low-density lipoprotein and is a novel marker of impending disseminated intravascular coagulation. Blood. 2002;100:2522-9.
- [CrossRef] [PubMed] [Google Scholar]
- Early identification of sepsis and mortality risks through simple, rapid clot-waveform analysis. Implications of lipoprotein-complexed C reactive protein formation. Intensive Care Med. 2003;29:55-61.
- [CrossRef] [PubMed] [Google Scholar]


