
Translate this page into:
Sensitivity and specificity of newly generated monoclonal antibodies to detect novel antigens of Mycobacterium tuberculosis for the diagnosis of all forms of tuberculosis
 , Amit Singh1,2, Saumya Srivastava1, Arti Shrivas3,4, Anvita Gupta Malhotra3, Pawan Sharma5, Sarman Singh1,3,4,
*Corresponding author: Prof. Sarman Singh, Director, Medical Research, Aarupadai Veedu Medical College, Vinayaka Mission’s Research Foundation, Pondicherry, India. sarman_singh@yahoo.com
-
Received: ,
Accepted: ,
How to cite this article: Gupta AK, Singh A, Srivastava S, Shrivas A, Malhotra AG, Sharma P, et al. Sensitivity and specificity of newly generated monoclonal antibodies to detect novel antigens of Mycobacterium tuberculosis for the diagnosis of all forms of tuberculosis. J Lab Physicians. 2024;16:298-314. doi: 10.25259/JLP_34_2023
Abstract
Objectives:
Tuberculosis (TB) is curable if diagnosed correctly and promptly. However, the lack of effective and accessible point-of-care tests hindered the systematic screening of TB. The current TB diagnostic methods, including molecular tests, have failed to deliver the capacity needed in the endemic countries to restrict the ongoing pandemic. The detection of Mycobacterium tuberculosis by serology offers several advantages, including rapid and low-cost disease detection. Earlier, we had evaluated the diagnostic utility of five novel recombinant antigens, namely, SS-1, SS-2, SS-3, SS-4, and SS-5, with Indian patient sera. However, antibody detection has some limitations, and therefore, in the present study, we aimed to generate monoclonal antibodies and explore the utility of the most promising antibodies for the detection of TB.
Materials and Methods:
We used the three best recombinant antigens, that is, Rv2145c (SS-1), Rv1827 (SS-4), and Rv2970c (SS-5) for the generation of monoclonal antibodies. The monoclonal antibodies were developed using hybridoma technology. Further, the diagnostic utility of these monoclonal antibodies was evaluated in diagnosis of TB by sandwich enzyme-linked immunosorbent assay. Serum samples from bacteriologically confirmed TB cases and controls were used.
Statistical Analysis:
All statistical analysis was carried out using STATA-11.1 software (StataCorp LP, Texas, USA). The sensitivity and specificity were computed using an online tool (OpenEpi). Statistically significant differences between groups were defined as p<0.05.
Results:
A total of 384 serum samples were included in the study. This included 144 pulmonary TB cases, 68 extrapulmonary TB cases, 50 disease controls and 125 healthy controls. The sensitivity and specificity of our three monoclonal antibodies (mAb_SS-1, mAb_SS-4, and mAb_SS-5) for detecting all forms of TB ranged from 86.49% to 97.44% and 96.57% to 98.29%, respectively. The receiver operative characteristic curve showed a significant statistical difference between TB and healthy subjects (P < 0.001).
Conclusions:
Our data suggested that mAb_SS-1, mAb_SS-4, and mAb_SS-5 could be used as potential TB screening tests, especially in the resource-limiting setting.
Keywords
Mycobacterium tuberculosis
Recombinant antigen
Monoclonal antibody
Sandwich enzyme-linked immunosorbent assay
Tuberculosis

INTRODUCTION
Tuberculosis (TB) is a serious infectious disease, caused by the aerobic, Gram-positive bacterium Mycobacterium tuberculosis.[1] For many decades now, it has estimated a worldwide 10.0 million cases of TB and 1.5 million deaths in 2020. India has the largest TB epidemic in the world, accounting for ~24% of the global TB cases.[2] The situation has become critical due to the increasing incidence of multidrug-resistant (MDR) and extensively drug-resistant (XDR) forms of M. tuberculosis.[3] This is primarily due to limited laboratory infrastructure, treatment initiation based on least sensitive diagnostics, and non-adherence to the standard therapeutic regimens.[4-6] In less equipped countries where most of the TB cases occur, diagnosis and management of such infections become a challenge. This challenge is primarily due to unavailability of rapid, accurate, cost-effective, and/or inaccessibility to advance detection systems.[7,8]
At present, approved diagnostic methods for TB mainly depend on either detection of Mycobacterium by Ziehl–Nielsen staining, culture isolation, or detection of the nucleic acids directly from clinical specimens. Although, acid-fast bacilli-smear microscopy allows fast detection of Mycobacterium bacilli in clinical specimens, has relatively low sensitivity especially in children and immunocompromised groups, such as acquired immunodeficiency syndrome.[9] The culture methods are less sensitive, require longer time to obtain test results, and also often require specialized laboratory facilities that may not be accessible in resource-limited settings. The existing nucleic acid amplification-based tests such as polymerase chain reaction (PCR),[10] Xpert Mycobacterium tuberculosis/ rifampicin (MTB/RIF) assay,[11] loop-mediated-isothermal amplification,[12] and line probe assay[13] are capable of detecting M. tuberculosis within a few hours to days, also require sophisticated laboratory equipments/infrastructure and costly consumables/kits, which pose high economic burden on low-income countries.[14]
Immunological methods, such as tuberculin skin test (TST) and interferon-gamma release assay (IGRA), have been developed for the detection of latent TB infection (LTBI).[15,16] However, both TST and IGRA fail to differentiate between latent TB and active TB infection in the high-burden countries.[17,18]
Serological tests have been an attractive diagnostic tool due to their convenience, low cost, and effortless implementation in national programs. Although, these tests have contributed a significant role toward the diagnosis and management of various infectious diseases such as human immunodeficiency virus (HIV), hepatitis, leishmaniasis, malaria, and dengue. However, meta-analysis of the TB serodiagnostic kits found that all these kits had no utility in the TB diagnosis due to poor sensitivity, specificity, positive predictive values (PPVs), and unreliable M. tuberculosis antigen-specific antibody titers in populations.[19-22] Therefore, the World Health Organization (WHO) banned the use of these serological tests in the suspected cases of pulmonary TB (PTB) and extrapulmonary TB (EPTB) in 2011. Subsequently, Government of India (GOI) also banned the importation, manufacturing, selling, and use of such kits.[23] However, WHO gave a strong message to the TB scientific society and national/international funding agencies that further targeted research is needed to develop an accurate, simple serodiagnostic test for TB. Moreover, WHO strongly recommends that proof-of-principle studies must be followed by evidence produced from prospectively implemented and well-designed evaluation and demonstration studies, including assessment of patient impact.[24]
Therefore, it can be concluded that current TB diagnostics are not gratifying for the requirements of early diagnosis in lower- and middle-income countries[25] and there is an urgent need for tests that must be accurate, sensitive, and inexpensive and require minimum logistic support to carry out and can be used in resource-limited settings.
Earlier, we had reported a number of differentially expressed proteins, which were over-expressed during the active disease or development of drug resistance in vivo.[26] Through bioinformatic analysis, five potential proteins named as Rv2145c (SS-1), Rv0164 (SS-2), Rv1437 (SS-3), Rv1827 (SS-4), and Rv2970c (SS-5) were subsequently selected for the generation of recombinant proteins by recombinant DNA technology. The recombinant proteins were expressed in Escherichia coli, purified, and assessed their diagnostic potential by dot-blot and enzyme-linked immunosorbent assay (ELISA) with sera from various patient and control groups. Three recombinant proteins Rv2145c (SS-1), Rv1827 (SS-4), and Rv2970c (SS-5) have demonstrated superior activity for the detection of active TB.[27] In the present study, we produced monoclonal antibodies (mAbs) against the above-mentioned recombinant proteins of M. tuberculosis and developed sandwich ELISA for TB detection using various patient and control groups.
MATERIALS AND METHODS
Recombinant antigens preparation
The selected three novel recombinant antigens of M. tuberculosis were prepared as previously described by Singh et al.[27] Briefly, clones were cultured at 37°C in Luria Bertani broth containing 100 μg/mL ampicillin and 50 μg/mL kanamycin antibiotics. The protein expression was induced with 1 mM isopropyl-b-D-1-thiogalactopyranoside (IPTG)/mL. Further, bacterial cells were harvested by centrifugation at 10,000× g for 10 min and lysed by sonication method. The recombinant proteins, SS-1 (KC147004.1), SS-4 (KC147003.1), and SS-5 (KC147008.1), were purified by Ni2+ Nitrilo Tri Acetic Acid (Ni2+NTA). metal-ion-affinity chromatography using the manufacturer’s instructions (Qiagen, Germany). Subsequently, purity of each recombinant protein was analyzed by sodium dodecylsulfate polyacrylamide gel electrophoresis (SDS-PAGE).
Immunization of BALB/c mice
Six to 8 weeks old male BALB/c mice weighing 20–25 g, supplied by National Institute of Nutrition, Hyderabad, was used as an experimental host. The mice were housed, handled, and immunized, and other experimental procedures were performed as per institute guidelines (Ref No-748/IAEC/13). A total of 54 BALB/c mice were used in this study [Table 1]. The mice were injected subcutaneously with 30 μg of purified recombinant antigens (SS-1, SS-4, or SS-5) mixed with Incomplete Freund’s Adjuvant (Sigma Aldrich, USA) in a 1:1 volumetric ratio. Subsequently, three booster injections were given to each mouse at 3 weeks of intervals. Post 1 week of following the booster injection, the serum antibody titer was determined by indirect ELISA. The terminal booster dose (50 μg recombinant antigen/mice without adjuvant) was given intraperitoneally 3 days before fusion.
| S. No. | Groups | Subgroup | No of mice in each subgroup | Total number of mice in each group |
|---|---|---|---|---|
| 1. | SS-1 | Antigen 30µg+Adjuvant (IFA) | 6 | 12 |
| Control mice with PBS | 6 | |||
| 2. | SS-4 | Antigen 30µg+Adjuvant (IFA) | 6 | 12 |
| Control mice with PBS | 6 | |||
| 3. | SS-5 | Antigen 30µg+Adjuvant (IFA) | 6 | 12 |
| Control mice with PBS | 6 | |||
| Total Mice | 36 |
IFA: Incomplete Freund’s adjuvant, PBS: Phosphate buffer saline
Myeloma cell line
Mouse Sp2/0-Ag14 myeloma cell line was received as a kind gift from Dr. Girish Varshney, Chief Scientist, Institute of Microbial Technology, Chandigarh India. The cells were cultured in the 25 cm2 tissue culture (TC) flasks (BD Falcon, San Jose, CA) containing Roswell Park Memorial Institute (RPMI)-1640 medium (Hiclone Laboratories, UK) with L-glutamine (2.01 mM) supplemented with heat-inactivated fetal bovine serum 10% (vol/vol), penicillin (100 U/mL), streptomycin (100 μg/mL), and gentamycin (100 μg/mL) (Sigma Aldrich, USA) denoted here as complete RPMI medium (cRPMI) medium in a humidified atmosphere at 37°C with 5% CO2 in the incubator (Nuaire, UK). Actively growing Sp2/0-Ag14 myeloma cells were treated with 8-Azaguanine (Sigma Aldrich, USA) for sensitization of cell before fusion.
Establishment of hybridomas
Three days after the terminal booster dose, mice were sacrificed via compressed CO2 inhalation method and removed spleen aseptically with a sterile surgical blade. Later, the spleen was washed with RPMI-1640 medium twice and cut into small pieces using a sterile surgical blade. Subsequently, splenocytes were collected, washed thricely with RPMI medium, and centrifuged at 900× g for 10 min. The standard cell fusion protocol was used as described by Köhler and Milstein[28] with some modifications. Briefly, splenocytes were mixed with Sp2/0-Ag14 myeloma cells in a 5:1 ratio and fused by polyethylene glycol (PEG)-1500. The cells were incubated for 5 min at 37°C, followed by a drop-by-drop addition of 20 mL RPMI and centrifugation at 700× g for 10 min. The fused cells were resuspended in cRPMI-1640 medium with 1× hypoxanthine-aminopterinthymidine (HAT) (Sigma Aldrich, USA). The 100 μL medium per well (96-well TC plates) was dispensed and kept for incubation in a humidified atmosphere at 37°C with 5% CO2 in an incubator for 2 weeks.[29]
Screening and isolation of monoclonal antibodies producing hybridomas
The hybridoma clone screening was started after 2 weeks of fusion, hybridomas medium were tested with individual recombinant antigen by indirect ELISA assay. Succinctly, the high protein binding ELISA plates (Corning, Merck, USA) were used for the ELISA assay. The plates were coated overnight at 4°C with respective protein (1 μg/mL in bicarbonate buffer, pH-9.6). The plates were then blocked using 250 μL/well of blocking buffer (1% Bovine serum albumin (BSA) in 1× Phosphate Buffer Saline [PBS] for 2 h at 37°C. After washing with PBS 0.05% Tween 20 [PBS-T], 100 μL/well of hybridoma medium was added and incubated for 2 h at 37°C. The polyclonal antibody produced against each recombinant antigen was used as a positive control, and medium of myeloma cells was used as a negative control. The unbounded antibodies were removed by washing with washing buffer (PBS-T). Subsequently, 100 μL/well of anti-mouse immunoglobulin (Ig)G Horse Reddish Peroxidase (HRP) conjugate diluted in 1: 10,000 ratios with dilution buffer was added and incubated at 37°C for 1 h. After washing with PBS-T, 100 μL of 3,3’,5,5’-Tetramethylbenzidine (TMB)/well was added and incubated at 37°C for 15 min. Enzyme reaction was then stopped by adding 50 μL of 2N H2SO4 per well. The optical density (O.D.) at 450 nm of ELISA plate was measured by ELISA plate reader (Elx-808, Biotek).
The ELISA-positive wells were selected and observed for the presence of hybridomas colonies with an inverted microscope. Only hybridomas positive wells were selected for further experiment. The limiting dilution method was used for the isolation of single hybridomas. Thereafter, positive hybridomas (secreting monoclonal antibodies) were allowed to be adopted in continuous culture and subsequently cryopreserved in liquid nitrogen.
Purification of monoclonal antibodies
The mAb was purified using protein-A resin-mediated affinity chromatography as per instruction of the manufacturer (Abcam, USA). Briefly, protein-A column was equilibrated using five column volumes of 1× binding buffer (1× PBS buffer, pH-7.2). The cell culture medium of hybridomas was diluted with an equal volume of equilibration buffer, loaded on the protein-A column, and incubated at room temperature (RT) for 2 h. Then, the column was washed with ten column volumes of washing buffer. The mAb was eluted using 1 mL of elution buffer (0.1 M glycine buffer, pH-2.5) that was immediately neutralized by 100 μL of neutralization buffer (1M Tris-Cl, pH-8.0) per mL of mAb. The column was regenerated by washing with 1× PBS and stored column in the 20% (v/v) ethanol at 4°C. The concentration of the purified mAb was determined by Bradford proteins assay.[30] The purity of mAbs was analyzed by SDS-PAGE.[31]
Western blot
The purified recombinant proteins were resolved in the 12% resolving gel (SDS-PAGE) and transferred onto nitrocellulose membranes (Millipore, MA, USA) using a semi-dry blotting apparatus (Bio-Rad®, USA) following the manufacturer’s protocol. The membrane was then blocked with 5% non-fat skimmed milk, washed four times with PBS-T for 10 min each, and incubated thereafter with diluted purified mAbs (100ng/10mL in dilution buffer, [PBS+1% BSA]) for 2 h at 37°C. Subsequently, membrane was washed thricely with PBS-T and incubated for 1 h at 37°C with 1:10,000 dilution of Horseradish peroxidase (HRP)-conjugated anti-mice IgG (PBS+1% BSA, pH 7.0). After washing, the blot was developed using Diaminobenzidine (DAB) (Sigma, USA) and 0.1% hydrogen peroxide (H2O2) was used as a substrate.
Study population
The study was conducted between the year 2014 and 2017. The Institutional Ethics Committee (IEC) of All India Institute of Medical Sciences (AIIMS), New Delhi, approved this study (Ref No. 48/03.03.2014). Participants referred from the various clinics of our institute (AIIMS, Delhi) and other hospitals in Delhi for routine diagnosis of TB were included in this study. The participants were included only after the informed written consent of the study. A total of 384 (n = 141 PTB; n = 68 EPTB; healthy control [HC] participants = 125; disease control [DC] participants = 50) participants were included in this study. The diseased groups PTB and EPTB were selected based on culture-confirmed TB and standard clinic-radiological findings as mentioned in the Centers for Disease Control and Prevention (CDC) and anti-tetanus serum (ATS) guidelines.[4,27] TB case definition adopted for this study was defined as “a patient with M. tuberculosis identified from a clinical specimen by culture or molecular methods.” The inclusion criteria for PTB participants (n = 141) were based on the presence of two or more of the following clinical symptoms: A cough for more than two weeks, fever, weight loss, night sweats, hemoptysis, and anorexia with or without cavitary lesions in the lung fields on radiological examination. The inclusion criteria for EPTB cases were made on the basis of symptoms presented by the patients, along with clinical and radiological examination. This included anorexia, malaise, fever, and weight loss with pleuritic or organ-specific pain. In addition, extensive exudative pleural effusion, peripheral (superficial) tuberculous lymphadenitis of cervical and axillary regions on X-ray, or other radiological examination suggestive of lytic lesions were included in the criteria for EPTB cases.[4] The MDR-TB is defined as resistant to rifampicin (RIF) and isoniazid (INH), with or without resistance to other first-line drugs. Those isolates that have shown resistance to INH and RIF were classified as MDR-TB cases. In the other diseased control group, only three categories, namely, HIV, toxoplasmosis, and leishmaniasis (confirmed by commercial immune-chromatography test /enzyme-linked immunosorbent assay (ICTs/ELISA)-based test) of patients were included in the study. The status of TB in other disease control groups was confirmed by liquid culture.
The definition of a healthy participant was defined as “a person who does not have a disorder or disease being studied.” The friends and laboratory staff (other than TB laboratory) were selected as HC for this study. The inclusion criteria for a healthy participant were a person, who does not present TB symptoms and must have a negative result of either TST or IGRA. The TST was done by a trained phlebotomist. The procedure was 5 TU/0.1 mL tuberculin (Span Diagnostics, Surat, India) administered intradermally on the volar part of the forearm and read after 48–72 h, and induration ≥10 mm was defined as positive. The IGRA test was performed as per the instruction of the manufacturer (Qiagen, Germany). Mantoux/IGRA test was not done in patients or healthy subjects who did not provide consent or refused the test. The venous blood (~5 mL) was collected from the confirmed TB patients as well as from control subjects, and then, the serum was separated. The sera were stored in a minimum of three aliquots at −80°C. The other details of participants, that is, age, gender, and BCG vaccination status, are mentioned in Table 2.
| S. No. | Category | PTB (141) (%) | EPTB (68) (%) | HC (125) (%) | DC (50) (%) |
|---|---|---|---|---|---|
| 1. | Mean Age (Yr±SD) | 37.13±17.76 | 28.92±13.08 | 38.34±23.64 | 28.27±14.54 |
| 2. | Sex | ||||
| Male | 92 (65.25) | 40 (58.82) | 81 (64.8) | 34 (68) | |
| Female | 49 (34.75) | 28 (41.18) | 44 (35.2) | 16 (32) | |
| 3. | BCG | ||||
| Pos | 70 (49.65) | 46 (67.64) | 32 (25.6) | NA | |
| Neg/uk | 71 (50.35) | 22 (32.36) | 93 (74.4) | ||
| 4. | HIV | ||||
| Pos | 30 (21.28) | 18 (26.47) | - | 20 (40) | |
| Neg/uk | 111 (78.72) | 50 (73.53) | 125 (100) | 30 (60) | |
| 5. | Mantoux | ||||
| Pos | 34 (24.11) | 42 (61.76) | - | NA | |
| Neg | 107 (75.88) | 26 (38.24) | 75 (60) | ||
| 6. | IGRA | ||||
| Pos | NA | NA | NA | ||
| Neg | 50 (40) | ||||
| 7. | Smear AFB | ||||
| Pos | 73 (51.77) | 46 (67.64) | - | NA | |
| Neg | 68 (48.22) | 22 (32.36) | 125 | ||
| 8. | MGIT culture pos | 141 (100) | 68 (100) | - | NA |
| 9. | MDR-TB | 37 (26.24) | 11 (16.18) | - | NA |
n: Total number of cases, Pos: Positive, Neg: Negative, uk: Unknown, NA: Not applicable, AFB: Acid-Fast Bacilli, PTB: Pulmonary tuberculosis, EPTB: Extrapulmonary tuberculosis, HC: Healthy control, DC: Disease control, MDR-TB: Multidrug-resistant tuberculosis cases, HIV-TB: Human immunodeficiency virus-associated tuberculosis, IGRA: Interferon-gamma release assays, MGIT: Mycobacteria Growth Indicator Tube, SD: Standard deviation, BCG: Bacille Calmette-Guerin
Sandwich ELISA
The checkerboard titration method was used to detect the optimum concentration of antigen, antibody, and sera dilution for ELISA. The 96 well ELISA plates were coated with 100 μL/well of each purified mAb in 0.1M bicarbonate buffer (pH 9.6) and incubated at 4°C overnight. The dilution buffer was taken as plate control (Blank). Plates were washed with 1× PBS-T and blocked by blocking buffer (5% skimmed milk in PBS) for 2 h at 37°C. Subsequently, plates were washed five times with 1× PBS-T, added 100 μL/well of diluted antigen (200 ng/mL), and incubated for 1 h at 37°C. The unbounded antigens were removed by washing, and then, after 100 μL/well of diluted serum samples at a 1:100 ratio in dilution buffer (0.1% skimmed milk powder in 1× PBS) was added to each well. Plates were again incubated for 1.5 h at 37°C followed by washing with PBS-T. After that, 100 μL of anti-human IgG whole antibody conjugated with HRP (Sigma Aldrich, USA) diluted at 1:15000 ratio in dilution buffer was added to each well and incubated for 1 h at 37°C. Post washes with 1× PBS-T, enzyme activity was observed by incubating plates for 15 min at 37°C with 100 μL of TMB per well. Later, 50 μL of 2N H2SO4 was added to each well as a stop reagent, and measured O.D. was taken at 450 nm using a spectrophotometer (ELx808 absorbance reader, BioTek, USA). All sera included in this study were tested in duplicate wells and repeated at least thricely to verify the reproducibility of results.
Data management
Data were presented as means and standard deviation (mean ± standard deviation [SD]). The test cutoff value was determined by mean O.D. of the healthy subject plus 2SD. The individual sample was considered positive if the O.D. value was equal to or above the cutoff. Sensitivity and specificity were calculated by an online available tool (OpenEpi), Graph plot and receiver operative characteristic (ROC) curves were plotted using STATA SE.11.0 (StataCorp LP, Texas, USA) software. ROC curve describes the probability of correct and incorrect results at different cutoff values. Differences between different groups were considered statistically significant at P < 0.05.
RESULTS
Expression, purification, and immunoactivity of recombinant proteins
All three recombinant proteins yield high-level expression after induction with 1 mM IPTG for 4 h at 37°C. All the recombinant proteins were successfully purified using Ni2+-NTA agarose affinity column chromatography under denaturing conditions except SS-4 protein. The purified recombinant proteins were obtained as a clear band corresponding to the expected molecular weight 28 kDa (SS-1), 17 kDa (SS-4), and 41 kDa (SS-5) with a purity level >96% by SDS-PAGE. The yield was 3.0g (SS-1), 0.3g (SS-4), and 0.3g (SS-5) of purified proteins per liter culture [Figure 1].
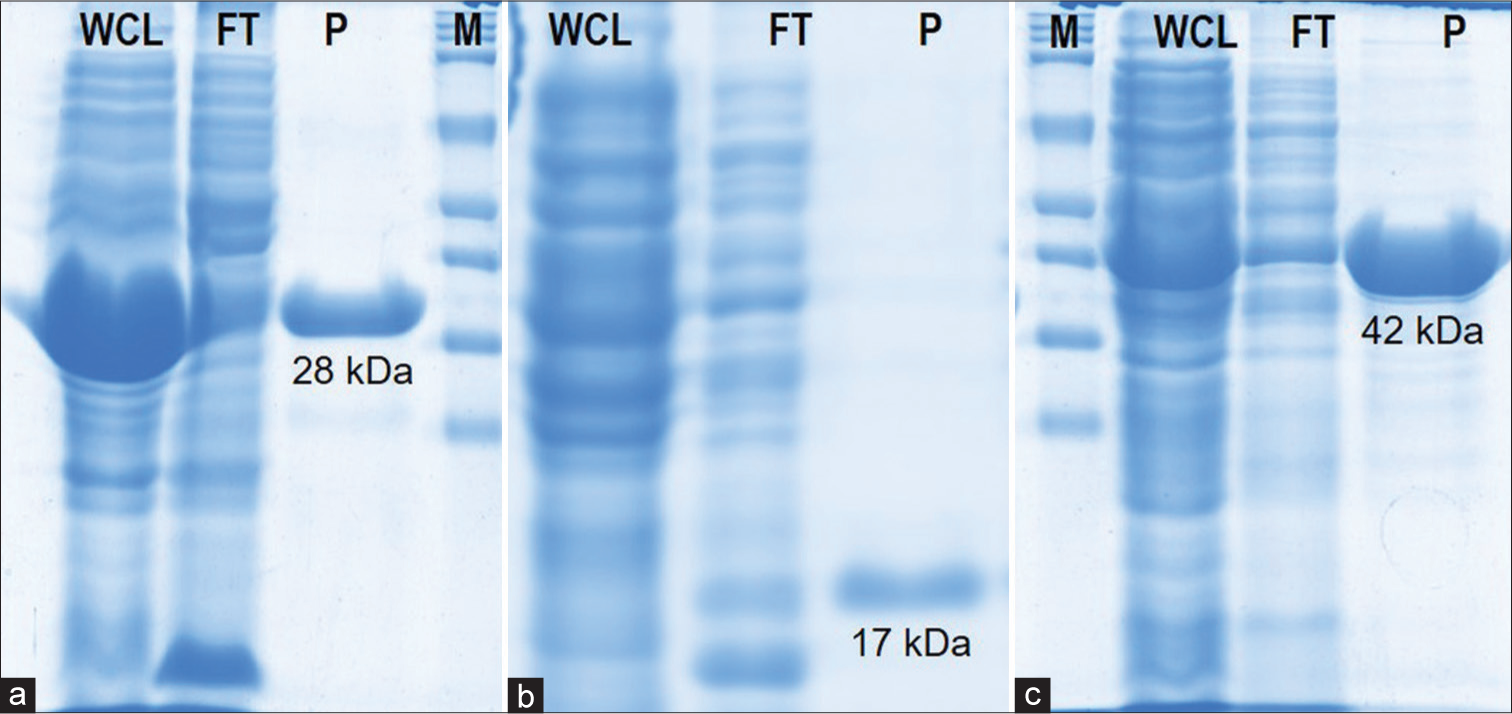
- SDS-PAGE and Western blot of purified recombinant proteins. (a) SS-1 (28kDa), (b) SS-4 (17kDa), and (c) SS-5 (41kDa). M: Protein marker, WCL: Whole cell lysate, FT: Flow through, P: Purified proteins.
Isolation of hybridomas producing anti-M. tuberculosis antigen-specific antibodies
The fusion was performed using PEG-1500 between myeloma cells and mice splenocytes that showed a higher antibody titer against each targeted recombinant antigen. The antibody titer was approximately 3271 folds in SS-1, 902 folds in SS-4, and 1198 folds higher than control in SS-5 mice sera. After clone screening, 34 wells of SS-1, 41 wells of SS-4, and 58 wells of SS-5 antigen group were selected (>1.0 O.D. as cutoff) for subcloning. Post three rounds of subcloning procedures, stable hybridoma clones producing anti-SS-1mAbs, SS-4mAbs, SS-5mAbs named as SS-1C14, SS-1D40, SS-1A76, and SS-1C82 (04 clone); SS-4B14, SS-4A30, SS-4D4, and SS-4A76 (04 clone); and SS-54D, SS-5B14, SS-5A30, SS-5B48, SS-5A76, SS-5D88, and SS-5B98 (07 clone) were identified and selected for clone scale-up procedure [Figure 2].
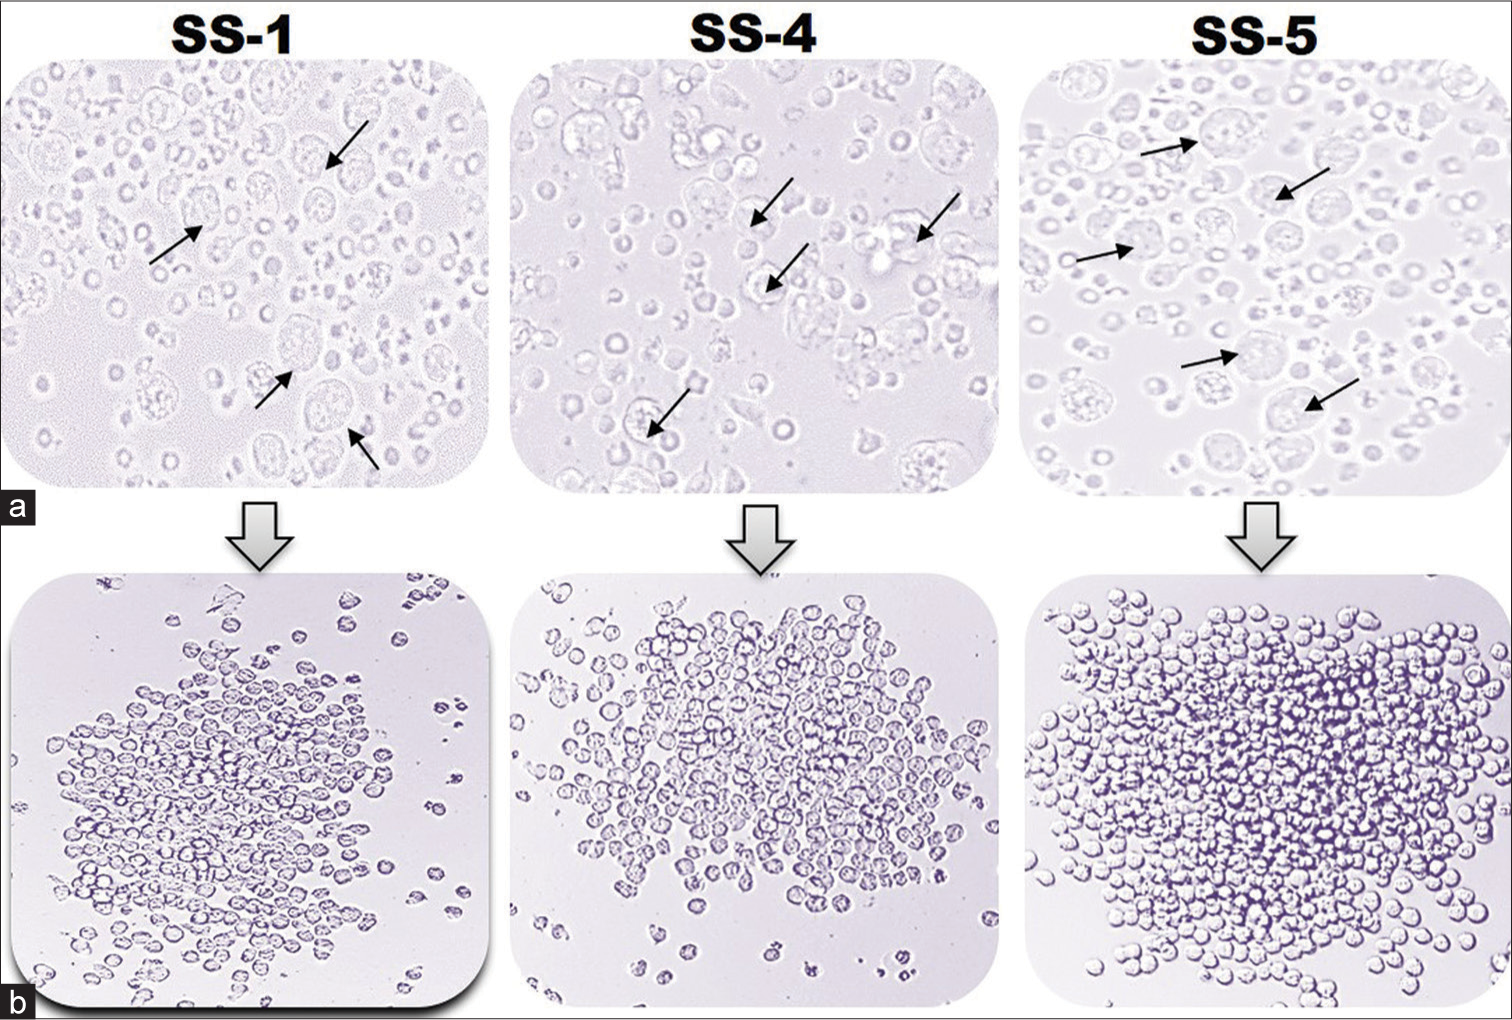
- A representative diagram of hybridomas clones. (a) Presence of hybridoma clones after HAT selection. The photographs were taken at ×400 magnification using an inverted microscope. (b) Progression of hybridomas in cRPMI medium. The image was taken at ×200 using an inverted microscope. Black arrow indicates the survived hybridoma clones.
Purification and immunoactivity of monoclonal antibodies
The mAbs named as SS-1mAbs, SS-4mAbs, and SS-5mAbs were successfully purified by protein-A-based affinity chromatography with a >95% purity level achieved. The reactivity of mAbs with respective recombinant antigens was analyzed using western blotting, which indicates a strong reaction with the corresponding recombinant antigen [Figure 3].
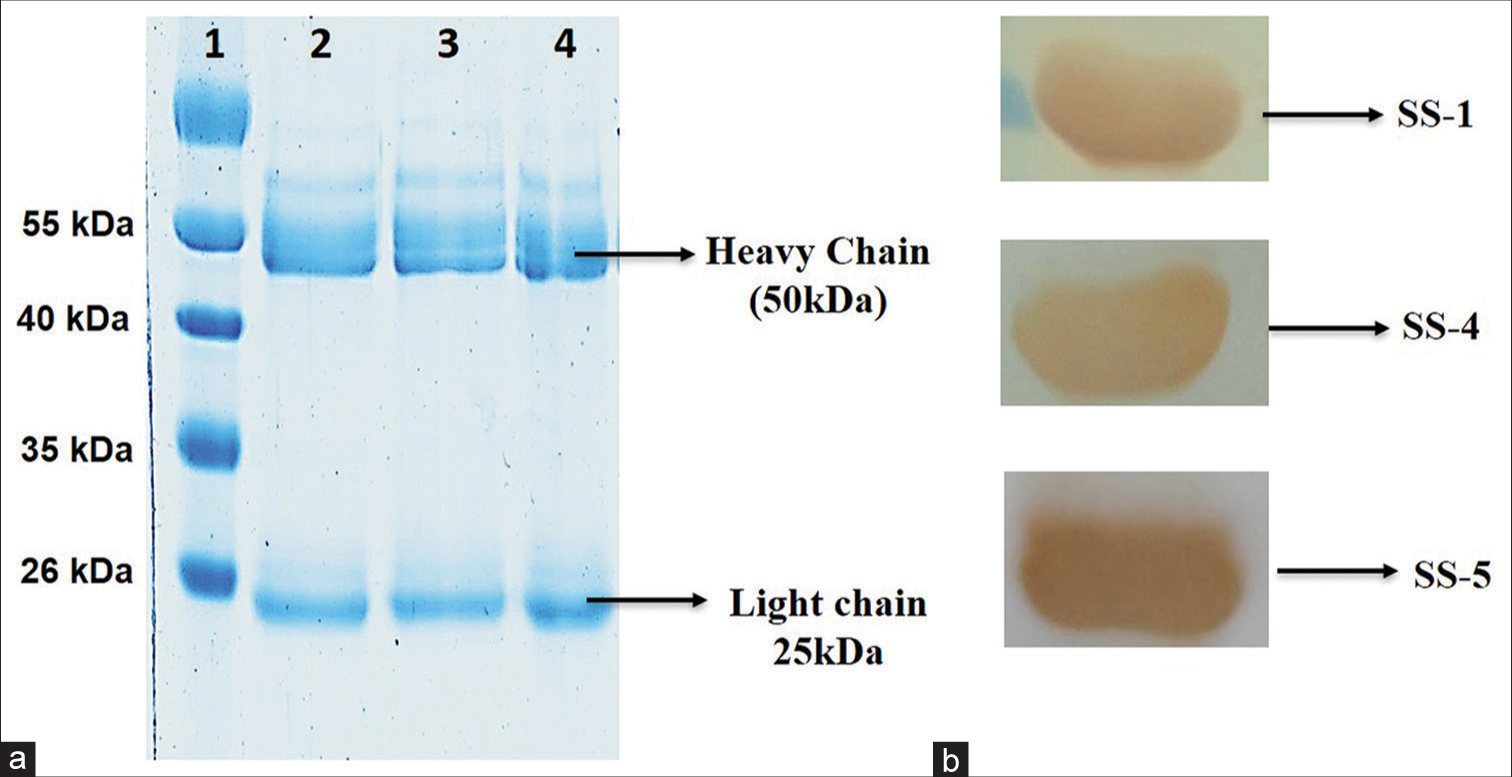
- SDS-PAGE analysis of monoclonal antibodies mAbs_SS-1, mAbs_SS-4, and mAbs_SS-5. (a) SDS PAGE analysis of purified monoclonal antibodies using protein-A column chromatography (Lane 1: Protein marker; lane 2: mAbs_SS-1; lane 3: mAb_SS-4; and lane 4: mAb_SS-5). (b) Western blot of purified mAbs with respective recombinant antigens.
Sandwich ELISA for detection of M. tuberculosis antigen
A modified sandwich ELISA was developed to detect M. tuberculosis antigens by purified mAbs. The mAbs SS-1A76, SS-4D4, and SS-5D54 showed maximum absorbance with SS-1, SS-4, and SS-5 antigens, respectively. Hence, these three mAbs were selected for validation and evaluation study [Figure 4].
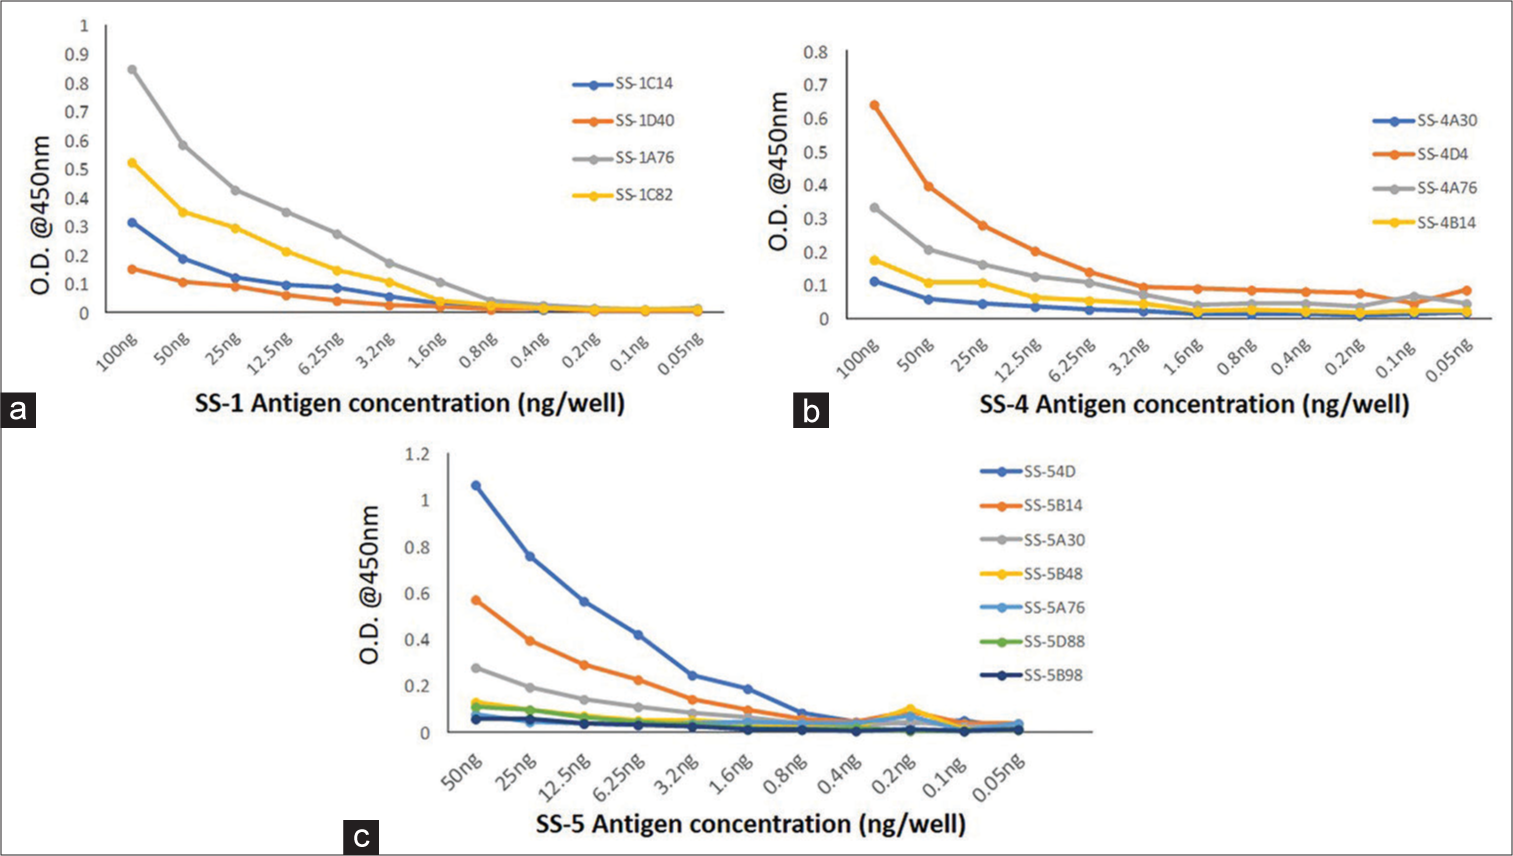
- Activity of purified monoclonal antibodies with recombinant antigen (a) SS-1, (b) SS-4, and (c) SS-5, OD: Optical Density.
Study subjects
After the standardization of ELISA, a total of n = 384 participants were tested for the assessment of the diagnostic potential of mAbs, as summarized in Table 2. Therefore, of the 384 participants, 209 were confirmed TB participants (141 PTB and 68 EPTB) and 175 control participants. Moreover, of the 209 TB participants, 132 (63.16%) were male and 77 (36.84%) female, with a mean age of 33.02 ± 15.42 years, whereas between the control groups, 115 (65.71%) were male and 60 (34.29%) were female with a mean age of 33.30 ± 19.09 years. Furthermore, of the 141 PTB participants, all were confirmed culture-positive, and of these 141 participants, 30 (21.28%) were HIV-positive, and 111 (78.72%) were HIV-negative. In addition, of the 68 EPTB patients, 18 (26.47%) were HIV-positive, and 50 (73.53%) HIV-negative. Besides this, 37 (26.24%) PTB and 11 (16.18%) EPTB patients were MDR. The 76 (36.36%) of the TB participants group were Mantoux positive, while 133 (63.63%) were Mantoux negative. In addition, all participants were examined for BCG vaccination (scar mark). Thus, out of 384 participants, 148 (38.54%) had BCG vaccination with a discernible scar, and 236 (61.46%) had no vaccination/no scar or unknown.
For assessing the specificity of sandwich ELISA, a total of 175 participants were included in the study as DCs or HCs. These included HIV-positive non-TB cases (20), cases of visceral leishmaniasis (20), and acquired toxoplasmosis (10). The 125 healthy volunteers with no obvious disease at the time of inclusion in the study were considered as healthy control. Among HC participants, 75 (60%) were Mantoux negative and 50 (40%) were IGRA negative [Table 2].
Activity of monoclonal antibodies in clinical samples
The optimum concentration of mAbs and purified recombinant antigens yielding high sensitivity and specificity was determined at 50ng/well for mAb_SS-1 and mAb_SS-5 and 25 ng/well for mAb_SS-4 and 10ng/well of purified SS-1, SS-4, and SS-5 antigens, respectively. The optimum dilution for primary (serum) was 1:100 and 1:15,000 for detection antibody (IgG-HRP), respectively. Using these dilutions, n = 384 human sera were tested with sandwich ELISA and analyzed data using statistical tools. The cutoff value was determined by the mean+2SD of the control participants. The estimated cutoff values were 0.496 for mAb_SS-1, 0.523 for mAb_SS-4, and 0.436 for mAb_SS-5, respectively. The area under curve (AUC) of each mAb was calculated between control and diseased group. AUCs were ranged from 0.97 (0.94–1.0) to 0.99 (0.98–0.99) for mAb_SS-1; 0.89(0.84–0.94) to 0.99 (0.98–1.0) for mAb_SS-4; and 0.95 (0.92–0.99) to 0.98 (0.97–1.0) for mAb_SS-5, which indicate a strong discriminatory potential of developed test (P < 0.0001) between participants of TB-positive and healthy group [Figure 5]. The sensitivity and specificity of these mAbs among study groups/subgroups are shown in Tables 3-5.
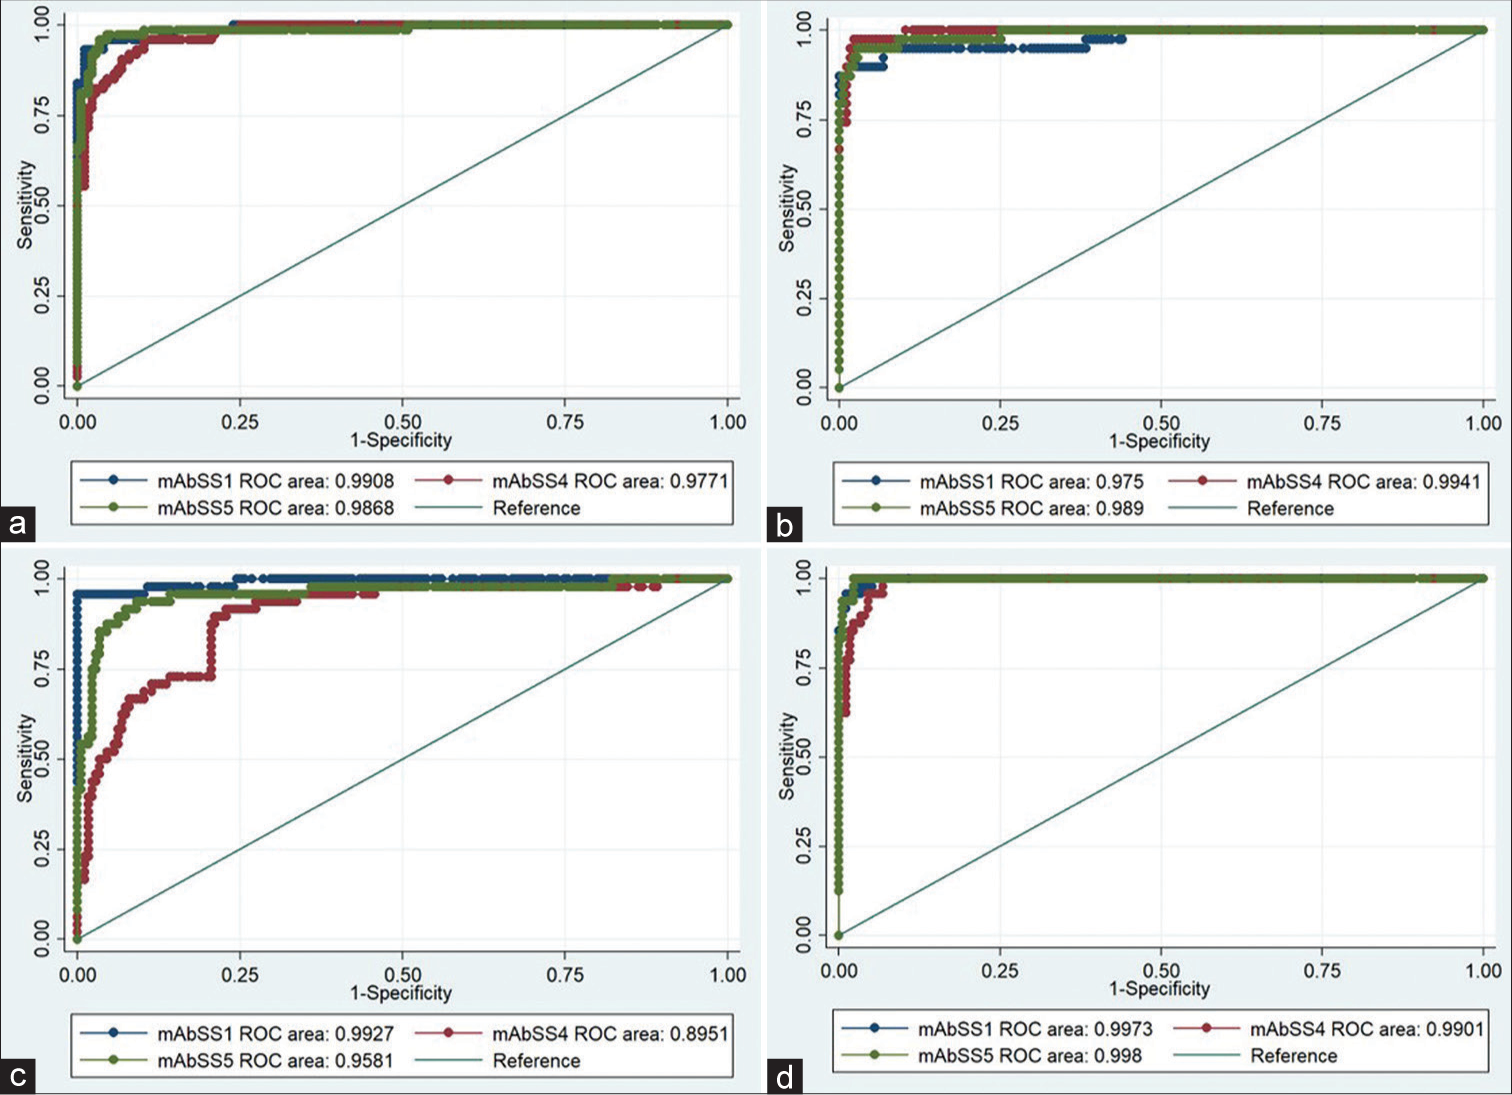
- ROC curves of the activity of three purified mAbs (mAb_SS-1, mAb_SS-4, and mAb_SS-5) generated against three Mycobacterium tuberculosis recombinant antigens (SS-1, SS-4 & SS-5) with various categories of TB (a) PTB, (b) EPTB, (c) HIV-TB, and (d) MDR-TB and control (HC and DC) group. ROC: Receiver operative characteristic, TB: Tuberculosis, HC: Healthy control, DC: Diseased control, EPTB: Extrapulmonary tuberculosis, HIV-TB: HIV-associated tuberculosis, PTB: Pulmonary tuberculosis, MDR-TB: Multidrug-resistant tuberculosis.
| Category | Sensitivity [n(%; 95% CI)] | Specificity [n(%; 95% CI)] | PPV (%) (95% CI) |
NPV (%) (95% CI) |
LRP (95% CI) | LRN (95% CI) | DA %, (95%CI) |
|---|---|---|---|---|---|---|---|
| mAb_SS-1 (Rv2145c) | |||||||
| PTB | 68/74 (91.89; 83.42, 96.23) | 172/175 (98.29; 95.08, 99.42) | 95.77 (88.3, 98.55) |
96.63 (92.84, 98.45) |
53.6 (27.82–103.3) | 0.0825 (0.05949–0.1144) |
96.39 ( 93.27, 98.09) |
| EPTB | 35/39 (89.74%; 76.42, 95.94) | 92.11 (79.2, 97.28) |
97.73 (94.3, 99.11) |
52.35 (27.06–101.3) | 0.1044 (0.06392–0.1704) |
96.73 (93.4, 98.41) |
|
| HIV-TB | 46/48 (95.83; 86.02, 98.85) | 93.88 (83.48, 97.9) |
98.85 (95.91, 99.68) |
55.9 (29.03–107.6) | 0.04239 (0.01591–0.113) |
97.76 (94.86, 99.04) |
|
| MDR-TB | 46/48 (95.83; 86.02, 98.85) | 93.88 (83.48, 97.9) |
98.85 (95.91, 99.68) |
55.9 (29.03–107.6) | 0.04239 (0.01591–0.113) |
97.76 (94.86, 99.04) |
|
| mAb_SS-4 (Rv1827) | |||||||
| PTB | 64/74 (86.49; 76.88, 92.49) | (169/175) 96.57; 92.72, 98.42) |
91.43 (82.53, 96.01) |
94.41 (90.02, 96.94) |
25.23 (18.11–35.14) | 0.1399 (0.115–0.1703) |
93.57 (89.82, 96.01) |
| EPTB | 38/39 (97.44; 86.82, 99.55) | 86.36 (73.29, 93.6) |
99.41 (96.74, 99.9) |
28.42 (20.47–39.45) | 0.02655 (0.003738–0.1886) |
96.73 (93.4, 98.41) |
|
| HIV-TB | 25/48 (52.08; 38.33, 65.53) | 80.65 (63.72, 90.81) |
88.02 (82.67, 91.88) |
15.19 (10.2–22.63) | 0.4962 (0.4555–0.5405) |
87 (81.95, 90.79) |
|
| MDR-TB | 46/48 (95.83; 86.02, 98.85) | 88.46 (77.03, 94.6) |
98.83 (95.84, 99.68) |
27.95 (20.12–38.82) | 0.04315 (0.01619–0.115) |
96.41 (93.08, 98.17) |
|
| mAb_SS-5 (Rv2970c) | |||||||
| PTB | 71/74 (95.95; 85.75, 98.61) | (171/175) 97.71; 94.27, 99.11) |
94.52 (86.74, 97.85) |
97.14 (93.49, 98.77) |
40.56 (24.8–66.34) | 0.06916 (0.04672–0.1024) |
96.37 (93.25, 98.08) |
| EPTB | 37/39 (94.87; 83.11, 98.58) | 90.24 (77.45, 96.14) |
98.84 (95.86, 99.68) |
41.27 (25.21–67.56) | 0.05249 (0.01969–0.1399) |
97.18 (93.99, 98.7) |
|
| HIV-TB | 40/48 (83.33; 70.42, 91.3) | 93.02 (81.39, 97.6) |
95.56 (91.48, 97.73) |
48.61 (25.05–94.35) | 0.1696 (0.1327–0.2167) |
95.07 (91.38, 97.22) |
|
| MDR-TB | 48/48 (100; 92.73, 100) | 92.31 (81.83, 96.97) |
100 (97.82, 100) |
43.5 (26.65–71.01) | 0.0 (0.0–'?') |
98.2 (95.46, 99.3) |
|
PTB: Pulmonary tuberculosis, EPTB: Extrapulmonary tuberculosis, MDR -TB: Multidrug -resistant tuberculosis cases, HIV -TB: Human immunodeficiency virus -associated tuberculosis, mAb: Monoclonal antibodies, TB: Tuberculosis, ELISA: Enzyme -linked immunosorbent assay, PPV: Positive predictive value, NPV: Negative predictive value, CI: Confidence interval, LRP: likelihood ratio of positive test, LRN: likelihood ratio of negative test, DA: Diagnostic accuracy
| Sensitivity [n(%; 95% CI)] | Specificity [n(%; 95% CI)] |
PPV (%) | NPV (%) | LRP (95% CI) | DA %, (95% CI) |
|
|---|---|---|---|---|---|---|
| mAb_SS-1 | ||||||
| PTB cases (n=141) | 132/141 (93.64; 88.31, 96.61) | 172/175 (98.29; 95.08, 99.42) |
97.78 | 95.03 | 54.61, (28.39–105.1) | 96.2 |
| HIV Pos (n=30) | 29/30 (90.63; 75.78, 96.76) | 96.67 | 98.31 | 159.5 (22.31–1140) | 98.08 | |
| HIV Neg (n=111) | 103/111 (92.79; 86.42, 96.3) | 97.17 | 95.56 | 54.13 (28.12–104.2) | 96.15 | |
| IGRA/Mx pos (n=34) | 31/34 (91.18; 77.04, 96.95) | 91.18 | 98.29 | 53.19 (27.5–102.8) | 97.13 | |
| IGRA/Mx Neg/ND (n=107) | 101/107 (94.39; 88.3, 97.4) | 97.12 | 96.63 | 55.06 (28.62–105.9) | 96.81 | |
| BCG vacc. (n=70) | 65/70 (92.86; 84.34,96.91) | 95.59 | 97.18 | 54.17 (28.12–104.3) | 96.73 | |
| BCG uk/no vacc (n=71) | 69/71 (97.18; 90.3, 99.22) | 95.83 | 98.85 | 56.69 (29.47–109) | 97.97 | |
| Smear Pos (73) | 70/73 (95.89; 88.6, 98.59) | 95.89 | 98.29 | 55.94 (29.07–107.6) | 97.58 | |
| Smear Neg (68) | 61/68 (89.71; 89.9, 99.19) | 95.31 | 96.09 | 52.33 (27.13–100.9) | 95.88 | |
| MDR-TB (37) | 35/37 (94.59; 82.3, 98.5) | 92.11 | 98.85 | 55.18, (28.62–106.4) | 97.64 | |
| mAb_SS-4 | ||||||
| PTB cases (n=141) | 111/141 (78.72; 71.25,84.67) | 169/175 (96.57 ;92.72, 98.42) |
94.87 | 84.92 | 22.96 (16.48–31.98) | 88.61 |
| HIV Pos (n=30) | 12/30 (40; 24.59, 57.68) | 66.67 | 90.37 | 88.29 (6.587-20.66) | 88.29 | |
| HIV Neg (n=111) | 99/111 (89.19; 82.05, 93.71) | 94.29 | 93.37 | 26.01, (18.72–36.15) | 93.71 | |
| IGRA/Mx pos (n=34) | 30/34 (88.24; 73.38, 95.33) | 83.33 | 97.69 | 25.74, (18.4–35.99) | 95.22 | |
| IGRA/Mx Neg/ND (n=107) | 81/107 (74.31; 69.76, 84.15) | 93.1 | 85.79 | 21.67, (15.5–30.3) | 88.03 | |
| BCG vacc. (n=70) | 52/70 (74.2; 62.97, 83.07) | 89.66 | 90.37 | 21.67, (15.43–30.43) | 90.2 | |
| BCG uk/no vacc (n=71) | 59/71 (83.1; 72.74, 90.06) | 90.77 | 93.37 | 24.24, (17.37–33.83) | 92.68 | |
| Smear Pos (73) | 60/73 (82.19; 71.88, 89.29) | 90.91 | 92.86 | 23.97, (17.17–33.47) | 92.34 | |
| Smear Neg (68) | 51/68 (75; 63.56, 83.77) | 89.47 | 90.86 | 21.88, (15.58–30.72) | 90.53 | |
| MDR-TB (37) | 35/37 (94.59; 82.3, 98.5) | 92.11 | 98.85 | 55.18, (28.62–106.4) | 97.64 | |
| mAb_SS-5 | ||||||
| PTB cases (n=141) | 133/141, (94.33; 89.2, 97.1) | 171/175 (97.71; 94.27, 99.11) |
97.08 | 95.53 | 41.27 (25.26–67.42) | 96.2 |
| HIV Pos (n=30) | 25/30 (83.33; 66.44, 92.66) | 86.21 | 97.16 | 36.46, (21.99–60.45) | 95.61 | |
| HIV Neg (n=111) | 108/111 (97.3; 92.35, 99.08) | 96.43 | 98.28 | 42.57, (26.06–69.52) | 97.55 | |
| IGRA/Mx pos (n=34) | 0/34 (100; 90.59, 100) | 90.24 | 100 | 43.75 (26.8–71.41) | 98.11 | |
| IGRA/Mx Neg/ND (n=107) | 99/107 (92.52; 85.94, 96.16) | 96.12 | 95.53 | 40.48 (24.76–66.18) | 95.74 | |
| BCG vacc. (n=70) | 64/70 (91.43; 82.53, 96.01) | 94.12 | 96.61 | 40, (24.43–65.48) | 95.92 | |
| BCG uk/no vacc (n=71) | 69/71 (97.18; 90.3, 99.22) | 94.52 | 98.84 | 42.52, (26.03–69.46) | 97.56 | |
| Smear Pos (73) | 70/73 (95.89; 88.6, 98.59) | 94.59 | 98.28 | 41.95 (25.67–68.56) | 97.18 | |
| Smear Neg (68) | 63/68, (92.65; 83.91, 96.82) | 94.03 | 97.16 | 40.53 (24.77–66.33) | 96.3 | |
| MDR-TB | 37/37 (100; 90.59, 100) | 90.24 | 100 | 43.75 (26.8–71.41) | 98.11 | |
PTB: Pulmonary tuberculosis, EPTB: Extrapulmonary tuberculosis, MDR-TB: Multidrug-resistant tuberculosis cases, HIV: Human immunodeficiency virus, mAb: Monoclonal antibodies, TB: Tuberculosis, ELISA: Enzyme-linked immunosorbent assay, PPV: Positive predictive value, NPV: Negative predictive value, DC: Disease control, HC: Healthy control, CI: Confidence interval, DA: Diagnostic accuracy, IGRA: Interferon-gamma release assays, BCG: Bacille Calmette-Guerin
| Sensitivity [n(%; 95% CI)] | Specificity [n(%; 95% CI)] |
PPV (%) | NPV (%) | LRP (95% CI) | DA %, (95% CI) | |
|---|---|---|---|---|---|---|
| mAb_SS-1 | ||||||
| EPTB cases (n=68) | 63/68 (92.65; 83.91, 96.82) | 172/175 98.29 (95.08, 99.42) |
95.45 | 97.18 | 54.04 (28.05–104.1) | 96.71 |
| HIV Pos (n=18) | 17/18 (94.44; 74.24, 99.01) | 85 | 99.42 | 55.09 (28.47–106.6) | 97.93 | |
| HIV Neg (n=50) | 46/50 (92; 81.16, 96.85) | 93.88 | 97.73 | 53.67 (27.82–103.5) | 96.89 | |
| IGRA/Mx pos (n=42) | 38/42 (90.48; 77.93, 96.23) | 92.68 | 97.73 | 52.78 (27.31–102) | 96.77 | |
| IGRA/Mx Neg/ND (n=26) | 25/26 (96.15; 81.11, 99.32) | 89.29 | 99.42 | 56.09 (29.09–108.1) | 98.01 | |
| BCG vacc. (n=46) | 43/46 (93.48; 82.5, 97.76) | 93.48 | 98.29 | 54.53 (28.28–105.1) | 97.29 | |
| BCG uk/no vac (n=22) | 20/22 (90.91; 72.18, 97.47) | 86.96 | 98.85 | 53.03 (27.32–102.9) | 97.46 | |
| Smear Pos (46) | 45/46 (97.83; 88.66, 99.62) | 93.75 | 99.42 | 57.07 (29.66–109.8) | 98.19 | |
| Smear Neg (22) | 18/22 (81.82; 61.48, 92.69) | 85.71 | 97.73 | 47.73 (24.24–93.98) | 96.45 | |
| MDR-TB (11) | 11/11 (100; 72.12,100) | 78.57 | 100 | 58.33 (30.35–112.1) | 98.39 | |
| mAb_SS-4 | ||||||
| EPTB cases (n=68) | 62/68 (91.18; 82.06, 95.89) | 169/175 96.57 (92.72, 98.42) |
91.18 | 96.57 | 26.59, (19.12–36.98) | 95.06 |
| HIV Pos (n=18) | 13/18 (72.22; 49.13, 87.5) | 68.42 | 97.13 | 21.06 (14.34–30.95) | 94.3 | |
| HIV Neg (n=50) | 49/50 (98; 89.5, 99.65) | 89.09 | 99.41 | 28.58 (20.6–39.66) | 96.89 | |
| IGRA/Mx pos (n=42) | 41/42 (97.62; 87.68, 99.58) | 87.23 | 99.41 | 28.47 (20.51–39.52) | 96.77 | |
| IGRA/Mx Neg/ND (n=26) | 21/26 (80.77; 62.12, 91.49) | 77.78 | 77.78 | 23.56 (16.62–33.39) | 94.53 | |
| BCG vacc. (n=46) | 42/46 (91.3; 84.21, 98.68) | 87.5 | 97.69 | 26.63 (19.12–37.08) | 95.48 | |
| BCG uk/no vac (n=22) | 20/22 (90.91; 72.18, 97.47) | 76.92 | 98.83 | 26.52 (18.94–37.12) | 95.94 | |
| Smear Pos (46) | 44/46 (95.65; 85.47, 98.8) | 88 | 98.83 | 27.9 (20.08–38.76) | 96.38 | |
| Smear Neg (22) | 18/22 (81.82; 61.48, 92.69) | 75 | 97.69 | 23.86 (16.8–33.89) | 94.92 | |
| MDR-TB (11) | 11/11 (100; 74.12, 100) | 64.71 | 100 | 29.17 (21.04–40.43) | 96.77 | |
| mAb_SS-5 | ||||||
| EPTB cases (n=68) | 63/68, (92.65; 83.91, 96.82) | 171/175 97.71 (94.27, 99.11) |
94.03 | 97.16 | 40.53, (24.77–66.33) | 96.3 |
| HIV Pos (n=18) | 15/18 (83.33; 60.78, 94.16) | 78.95 | 98.28 | 36.46 (21.76–61.09) | ||
| HIV Neg (n=50) | 48/50 (96; 86.54, 98.9) | 92.31 | 98.84 | 42 (25.69-68.67) | ||
| IGRA/Mx pos (n=42) | 40/42 (95.24; 84.21, 98.68) | 90.91 | 98.84 | 41.67 (25.46–68.18) | 97.24 | |
| IGRA/Mx Neg/ND (n=26) | 23/26 (88.46; 71.02, 96) | 85.19 | 98.28 | 38.7 (23.45–63.88) | 96.52 | |
| BCG vacc. (n=46) | 42/46 (91.3; 84.21, 98.68) | 91.3 | 97.71 | 39.95 (24.36–65.49) | 96.38 | |
| BCG uk/no vac (n=22) | 21/22 (95.45; 78.2, 99.19) | 84 | 99.42 | 41.76 (25.47–68.47) | 97.46 | |
| Smear Pos (46) | 44/46 (95.65; 85.47, 98.8) | 91.67 | 98.84 | 41.85 (25.59–68.45) | 97.29 | |
| Smear Neg (22) | 19/22 (86.36; 66.66, 95.25) | 82.61 | 98.28 | 37.78 (22.77–62.69) | 96.45 | |
| MDR-TB (11) | 11/11 (100; 74.12, 100) | 73.33 | 100 | 43.75 (26.8–71.41) | 97.85 | |
PTB: Pulmonary tuberculosis, EPTB: Extrapulmonary tuberculosis, MDR-TB: Multidrug-resistant tuberculosis cases, HIV: Human immunodeficiency virus, mAb: Monoclonal antibodies, TB: Tuberculosis, ELISA: Enzyme-linked immunosorbent assay, PPV: Positive predictive value, NPV: Negative predictive value, DC: Disease control, HC: Healthy control, CI: Confidence interval, IGRA: Interferon-gamma release assays, ND: Not Done, BCG: Interferon-gamma release assays, DA: Diagnostic accuracy, LRP: Likelihood ratio of a positive test
The overall sensitivity and specificity of these mAbs were ranging 93.53% and 97.71% for mAb_SS-5, 93.32% and 98.29% for mAb_SS-1, and 82.96% and 96.57% for mAb_SS-4, respectively [Table 3]. A significant value was found between participants of the healthy and TB-positive group (PmAb_SS-1 <0.001, PmAb_SS-4<0.001, and PmAb_SS-5<0.001) that indicated the higher discriminatory power of the test [Figure 6]. The collective sensitivity of mAb_SS-1, mAb_SS-4, and mAb_SS-5 was between 86.49% and 95.95% in PTB; 89.74% and 97.44% in EPTB; 52.08% and 95.83% in HIV-TB; and 95.83% and 100% in MDR-TB cases, respectively [Table 3].
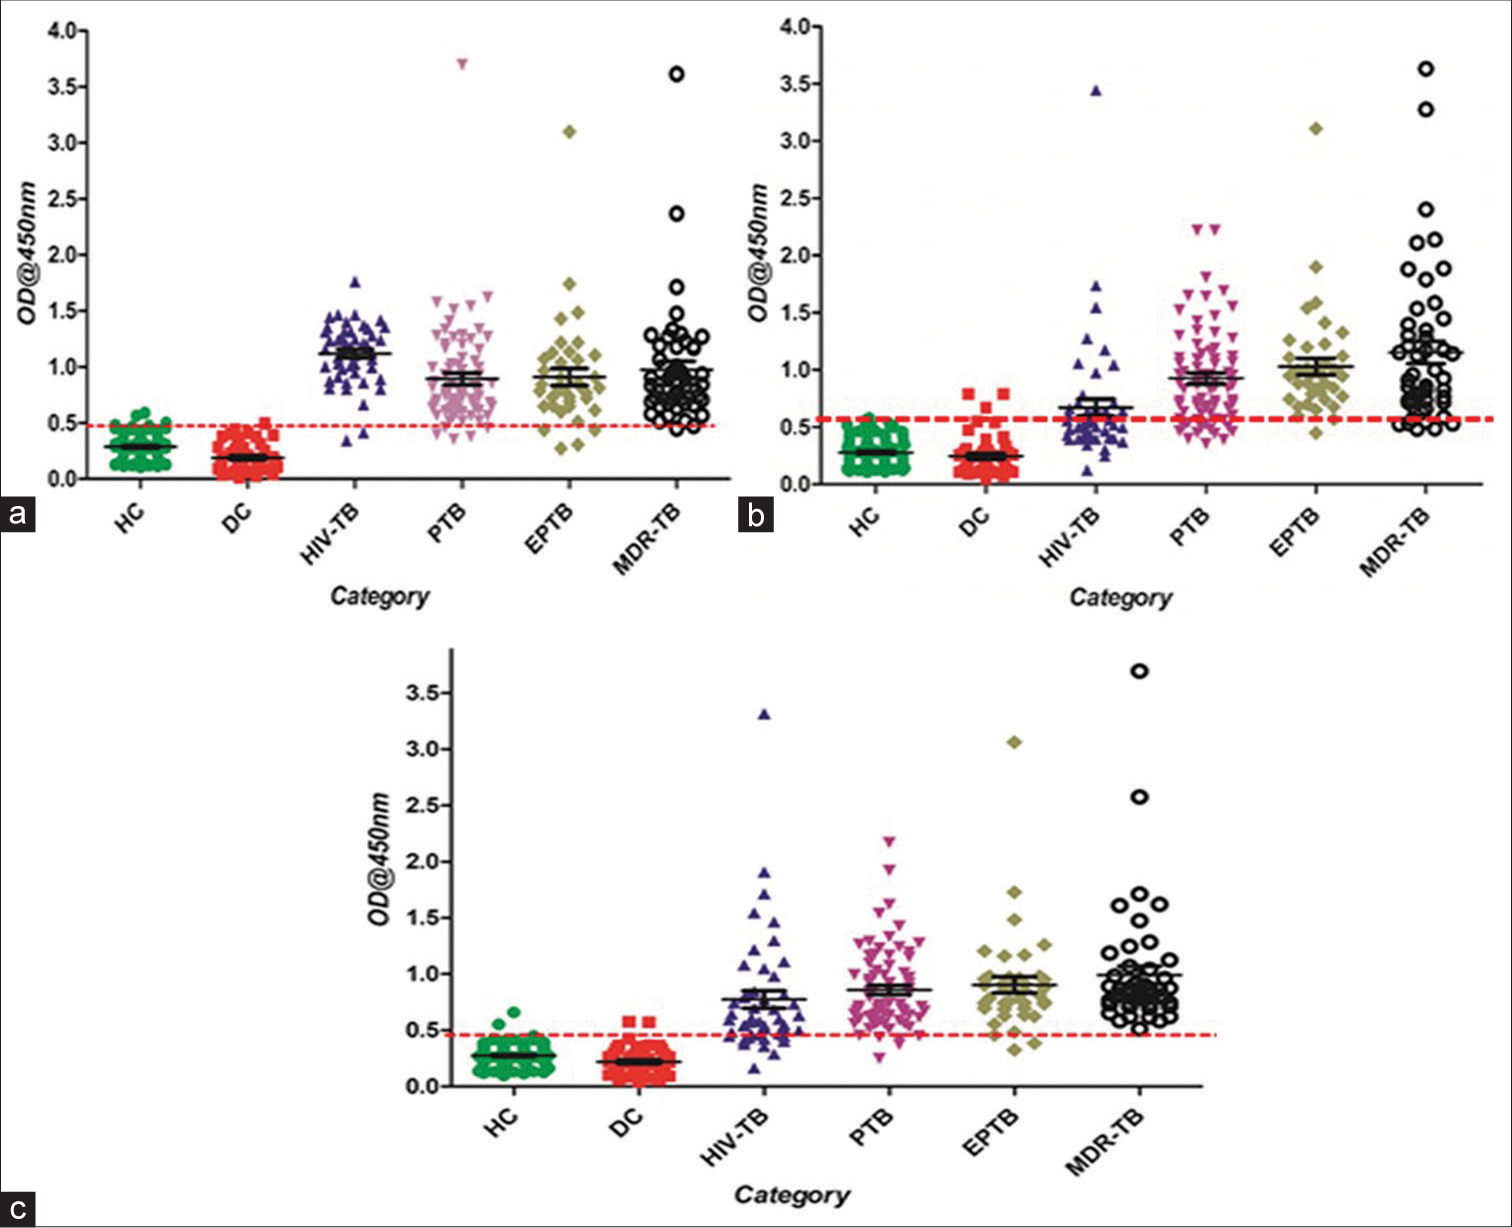
- Scatter plots of sandwich ELISA results obtained by clinical samples (a) mAb_SS-1, (b) mAb_ SS-4, and (c) mAb_SS-5. The activity of mAbs in serum samples HC, DC, and TB patients (EPTB, HIV-TB, PTB, and MDR-TB). Scatter plot indicates the antibody level per subject analyzed. A dotted horizontal line (red color) is included to show the cutoff value for a positive response of antigens. Any sample exhibiting absorbance above the cutoff value was classified as positive. ELISA: Enzyme-linked Immunosorbent Assay, HC: Healthy control, DC: Diseased Control, EPTB: Extrapulmonary Tuberculosis, HIV-TB: HIV-associated tuberculosis, PTB: Pulmonary Tuberculosis, MDR: Multidrug-Resistant Tuberculosis; Dotted red line showed the cutoff value.
The mAb_SS-5 displayed highest sensitivity in PTB (95.95%) and 100% with MDR-TB group while mAb_SS-4 in EPTB (97.44%) and mAb_SS-1 in HIV-TB (95.83%). The mAb_SS-1 shows the highest specificity (98.29%) than other antibodies [Figure 6; Table 3].
DISCUSSION
TB is a treatable infectious disease if diagnosed timely. In endemic countries like India, where the PTB is highly prevalent, the frontline diagnostic tests are based on two to three sequential sputum smear microscopy test and chest X-ray.[32,33] The sputum smear microscopy suffers from low and variable sensitivity (30–70%), while X-ray is less specific. Thus, a large number of suspected TB patients remain undetected. The culture tests (both solid and liquid culture) are less sensitive and have a long turnaround time for results.[34-36] Consequently, treatment may be delayed, or a patient may be treated inappropriately. In such cases, M. tuberculosis would continue to spread and increase the chances of drug resistance. Moreover, diagnosis of EPTB is more complex and difficult. To overcome these problems, WHO introduces a high priority target product profile (TPP) for new TB diagnostics, which recommends a TPP for developing rapid biomarkers or nonsputum-based test for TB diagnosis.[37,38]
Many biomarker-based tests (both antigen detection and antibody detection) have been reported in the past two decades, which failed badly due to several reasons, that is, insufficient sensitivity and specificity, complex and variable host immune response against M. tuberculosis, and the scarcity of bacteria in the clinical samples.[39,40] The meta-analysis of the commercial diagnostic test used for PTB and EPTB found poor and variable sensitivity and specificity. The pooled sensitivity of commercial serological tests was ranged from 63% to 85% and specificity 73% to 100% in PTB cases,[41] whereas in EPTB cases (all extrapulmonary sites), sensitivity ranged from 0% to 100% and specificity 59% to 100%, respectively, that suggest zero value of these kits or insufficient to replace the smear microscopy.[20,22,24] Therefore, WHO and STAG-TB committee issued a negative policy statement regarding the use of serological tests for TB diagnosis in 2011. Subsequently, GOI also banned the import, sale, and use of serology tests for TB in May 2012.[23] However, WHO gave a strong message to TB scientific society and research funding agencies that, further, targeted research is required to develop an accurate and simple serodiagnostic test for TB.[24] This advisory has opened new ways for TB scientific community toward the identification of newer biomarkers for TB detection. The utmost priority is a rapid and non-sputum-based test for the detection of TB at the early stage to initiate treatment followed by a triage test with high sensitivity that could rule out disease and would be useful to refer patients to the higher center for confirmation.[37,38,42]
Some antigens were reassessed in various platforms/combinations for developing better diagnostics for TB. These are 38kDa antigen[43] Malate synthase ([Rv1837c]; 81 kDa proteins), recombinant MPT51 ([Rv3803c],[44] 27 kDa) protein, MPT64 (Rv1980c),[32,45,46] LAM,[45,47] recombinant TbF6 antigen (fused polyproteins of 38kDa antigen,[48] CFP-10, Mtb8, and Mtb48),[45] native 38kDa antigen, Esat-6 and CFP-10,[32,43,49] fusion of ESAT-6, CFP-10, and Ag38kDa,[50] native 85 complex,[46] and a-crystallin (Rv2031c).[51]
In a recent study, the group used a cocktail of MPT64, Esat-6, and CFP-10 antigens and tested it with the urine of PTB patients. The sensitivity and specificity of urinary M. tuberculosis antigens cocktail were 68.2% and 33%, respectively.[47] Another study reported by Abebe et al.[52] showed variable IgA, IgG, and IgM antibody responses among a-crystallin, LAM, and 28kDa antigen in various TB and healthy individuals, suggesting the inability of this antigen as a potential biomarker of TB diagnosis.[52] The pooled sensitivity of a-crystallin (Rv2031c) antigens ranged from 73% to 81.2% in PTB and 42.2% to 63.83% in EPTB cases, respectively, whereas specificity was 94.7%,[53-55]
Feng et al.,[56] generated a polyprotein by fusion of 38 kDa and MPT64 antigen that had low sensitivity (70.4%), but better specificity (91.5%).[56] Another fusion protein TbF6 antigen, which was generated by the fusion of four distinct antigens 38 kDa, CFP-10, MTB8, and MTB48, in a single protein. However, its sensitivity in sputum smear-positive patients was found to be below 85% only.[5,22,48] The reduced sensitivity and specificity observed even combination of multiple earlier used peptide/antigen have failed the possibility for the development of an improved version of serodiagnostics for TB.[48]
Keeping in mind the above-mentioned points, we have tried to contribute a little more toward the development of the improved version of the serodiagnostic test for TB. In our previous study, we reported 27 upregulated proteins using the comparative proteomic approach from the sequential isolates of M. tuberculosis.[3] Of the 27 identified proteins, five novel proteins, that is, 145c (SS-1), Rv0164 (SS-2), Rv1437 (SS-3), Rv1827 (SS-4), and Rv2970c (SS-5) of M. tuberculosis were successfully cloned, expressed, purified, and evaluated by indirect ELISA and dot-blot assay using well-characterized sera of TB and healthy subjects. The sensitivity and specificity of SS-1, SS-4, and SS-5 had been much higher than earlier used and recently published antigens.[27] The SS-1 antigen is located close to the cluster of proteins responsible for regulating cell morphology and also plays as defensive role in mycobacteria that are oxidatively stressed. However, SS-4 antigen is a conserved hypothetical protein that activates the T-cell response in the host. The SS-5 antigen is a probable lipase/esterase LipN, located in the cytosol of mycobacteria and protects from acidic stress condition. The present study was carried out to develop a more accurate, indirect antigen detection test for TB. The recombinant proteins were successfully prepared using the procedure mentioned in the methodology section. A strong immune response was achieved after the first booster in the SS-1 and SS-5, whereas three booster doses were introduced to SS-4 group mice to get a significant antibody titer. The differences in the generation of strong immune response might be the presence of many immunodominant sequences (epitopes) in the SS-1 and SS-5 antigens as compared to SS-4 antigen. The fusion of mice myeloma cells and splenocytes was carried out using the PEG method. Positive hybridomas were screened by the HAT selection method. Through subcloning, individual hybridoma clone was isolated and produced identical colonies with approximately 99.99% clonality. The mAbs were successfully purified from the ascites by protein-A column chromatography with >95% purity levels.
The diagnostic potential of these mAbs was assessed using well-characterized sera of PTB, EPTB, DC, and HC participants. To analyze the specificity of these mAbs, participants of healthy and other diseases, that is, HIV, leishmaniasis, and toxoplasmosis were included in this study. The Mycobacteria Growth Indicator Tube- 960 (MGIT-960) culture (liquid culture) was taken as the gold standard for sensitivity analysis. We found higher sensitivity and specificity of our mAbs than recently published[45] studies, which utilized 38kDaAg, MPT-64, 16kDa, and 48kDa antigens. The sensitivity of ELISA in smear-positive cases (both PTB and EPTB) was significantly higher than recently published reports.[32,43,44,50,51] However, reduced sensitivity was estimated with mAb_SS-4 antibody in smear-negative cases, when compared with mAb_SS-1 and mAb_SS-5 antibodies. Nevertheless, we observed a superior statistical difference between TB patients and healthy controls (P < 0.001) [Tables 3-5]. All three mAbs showed superior sensitivity with sera of MDR-TB when compared with pan-susceptible active TB cases. This may be due to a higher antigenic load of multiplying Mycobacterium in MDR-TB cases.[54] Remarkably, we found that no serum sample of disease control groups was found to have significant activity with our mAbs, which suggests the superior specificity of our test [Table 3]. The sensitivity of mAb_SS-1 and mAb_SS-5 were significantly higher than earlier used antigens, that is, 38kDa Ag, LAM, Hsp, and Esat-6, while mAb_SS-4 showed almost similar activity in HIV-TB cases[52,57,58] [Tables 3-5].
The diagnostic accuracy of our test was also compared with recently identified biomarkers, two mAbs (mAbs_SS-1 and mAbs_SS-5) show better sensitivity than recently published studies by Shah et al.[59] that utilized anti-LAM antibodies and a cocktail of various secretary antigen-specific antibodies[60] [Table 3]. Interestingly, none of the serum samples of IGRA negative was found positive by these mAbs, indicating higher selectivity by our mAbs. The overall specificity of our mAbs was similar as mentioned by Aliannejad et al.[61]
GeneXpert MTB/RIF is a real-time PCR-based molecular test that amplifies a specific sequence of rpoB gene of M. tuberculosis and detects rifampicin (RIF) resistance mutations directly from clinical samples. The sensitivity of GeneXpert is closely related to the concentration of bacilli in the clinical specimen.[62,63] Various studies have been reported since 2012 that shows variable sensitivity ([86.8–100%] in PTB and [54.8–94.5%] in EPTB patients) and specificity (93.1–99.3%) of GeneXpert in detection of M. tuberculosis.[11,64-66] We intentionally compared our data with GeneXpert and observed more or less similar sensitivity with PTB and EPTB, especially smear-negative culture-positive cases [Tables 4 and 5].
The mAb_SS-1 and mAb_SS-5 antibodies have shown higher sensitivity than most of the recently published reports.[32,43,45,49,50,67,68] However, we noticed a slightly decline (insignificant difference) in the sensitivity, when compared to our previous study.[27] This could be a larger sample size compared to our earlier report or different diagnostic platforms used in this study. The diagnostic potential of a test in clinical practice is determined by its PPV and likelihood ratio (LR) of a positive test. High PPV of a test makes it useful and displays better test accuracy in disease, while a high-negative predictive value (NPV) of the test makes the test useful in the exclusion of disease in negative cases.[69] The PPV was 92.11–95.77% for mAb_SS-1, 80.65–91.43% for mAb_SS-4, and 90.24–94.52% for mAb_SS-5, while NPV 96.63–98.85% for mAb_SS-1, 88.02–99.41% for mAb_SS-4, and 95.56–100% for mAb_SS-5, respectively [Table 3]. The PPV and NPV of our study indicate that this test is extremely useful in the diagnosis of TB accurately. LR of a positive test is also an important statistical parameter that can give extra weightage to the acceptance of a test. A value greater than one supports or improves the test’s accuracy, whereas a value less than one reduces its accuracy. In our study, the LR-positive values of all three mAbs ranged from 15 to 53.6, which show the better diagnostic value of these antibodies in TB diagnosis.
Although the present study displayed the superior activity of all three mAbs in the detection of active TB, the study has some limitations. First, all mAbs could not be tested with other TB diseased groups, such as household contacts, LTBI, and other lung diseases, including asthma, bronchitis, pneumonia, allergies, and cancer. The study also had limitation of funds to screen all 125 healthy controls using IGRA test, which was desirable to have an uniform test. We also feel that it would be desirable to test our mAbs on a large number of patients population comprising of groups including the culture confirmed NTM infections, to rule out any cross reactivity.
To the best of our knowledge, no similar study has been reported in the literature that exploits the possibility of these M. tuberculosis antigen-specific anti-antibodies in TB diagnostics. The results of this study suggest that these mAbs could be used as a potential biomarker for the screening of suspected cases of active TB and ruling out the TB exposure, especially in situations where evidences of prior TB exposure may impede the immigration or recruitment to some specialized services, rapidly and at much cost-effective rates then the IGRA test.
CONCLUSIONS
The monoclonal antibodies generated and presented in this study were found to be highly sensitive and specific. The combination of novel recombinant antigens and generation of monoclonal antibodies against these antigens can be used for screening all forms of tuberculosis. It is proposed that rapid diagnostic tests developed using these monoclonal antibodies may serve as triage point of care test for screening all suspected cases of tuberculosis.
Acknowledgments
This study was supported by an extramural grant from the Indian Council of Medical Research (ICMR), New Delhi, and the Department of Biotechnology (DBT), New Delhi, to Prof. Sarman Singh. The authors are highly thankful to Dr. G. C. Varshney, Institute of Microbial Technology (IMTECH), Chandigarh, for providing Sp2/0-Ag14 myeloma cell line and Prof. H. K. Prasad, All India Institute of Medical Sciences (AIIMS), New Delhi for providing key suggestions during monoclonal antibody generation. AKG acknowledges AIIMS, New Delhi, for providing the institute PhD fellowship.
Authors’ contributions
AKG and SS experimented and compiled data for analysis. AKG, AS, PS, and SS conceived and designed the study. The AKG, AS, and SS interpreted the experiment data and drafted the manuscript. ASh and AGM helped in the preparation of the manuscript. SS arranged funds for the study and finalized the manuscript.
Ethical approval
The research/study approved by the Institutional Review Board at All India Institute of Medical Sciences, New Delhi, number Ref No. 48/03.03.2014, dated October 10, 2014.
Declaration of patient consent
The authors certify that they have obtained all appropriate patient consent.
Conflicts of interest
Dr. Sarman Singh is on the Editorial Board of the Journal.
Use of artificial intelligence (AI)-assisted technology for manuscript preparation
The authors confirm that there was no use of artificial intelligence (AI)-assisted technology for assisting in the writing or editing of the manuscript and no images were manipulated using AI.
Financial support and sponsorship
This study was supported in part by the Indian Council of Medical Research (ICMR), New Delhi (ICMR Sanction Order Number: 5/8/5/15/10-ECD-I) and Indo-U.S. Science and Technology Forum (IUSSTF) (Award Letter No. IUSSTF/USISTEF/8th Call/HI-051/2017/2018-19) granted to Prof. Sarman Singh (SS).
References
- Origins of combination therapy for tuberculosis: Lessons for future antimicrobial development and application. mBio. 2017;8:e01586-16.
- [CrossRef] [PubMed] [Google Scholar]
- Deciphering the sequential events during in vivo acquisition of drug resistance in Mycobacterium tuberculosis. Int J Mycobacteriol. 2014;3:36-40.
- [CrossRef] [PubMed] [Google Scholar]
- Controlling multidrug-resistant tuberculosis in India. Lancet. 2007;369:741-2.
- [CrossRef] [PubMed] [Google Scholar]
- High rate of extensively drug-resistant tuberculosis in Indian AIDS patients. AIDS. 2007;21:2345-7.
- [CrossRef] [PubMed] [Google Scholar]
- Scaling up anti-mycobacterial drug susceptibility testing services in India: It is high time. Indian J Med Microbiol. 2008;26:209-11.
- [CrossRef] [PubMed] [Google Scholar]
- Serodiagnostic efficacy of Mycobacterium tuberculosis 30/32-kDa mycolyl transferase complex, ESAT-6, and CFP-10 in patients with active tuberculosis. Arch Immunol Ther Exp (Warsz). 2010;58:57-65.
- [CrossRef] [PubMed] [Google Scholar]
- The impact and cost of scaling up GeneXpert MTB/RIF in South Africa. PLoS One. 2012;7:e36966.
- [CrossRef] [PubMed] [Google Scholar]
- Sputum smear microscopy in tuberculosis: Is it still relevant? Indian J Med Res. 2013;137:442-4.
- [Google Scholar]
- Multiplex PCR assay for simultaneous detection and differentiation of Mycobacterium tuberculosis, Mycobacterium avium complexes and other mycobacterial species directly from clinical specimens. J Appl Microbiol. 2009;107:425-35.
- [CrossRef] [PubMed] [Google Scholar]
- Performance of Xpert MTB/RIF on ascitic fluid samples for detection of abdominal tuberculosis. J Lab Physicians. 2017;9:47-52.
- [CrossRef] [PubMed] [Google Scholar]
- Loop-mediated isothermal amplification assay for rapid and sensitive diagnosis of tuberculosis. J Infect. 2014;69:607-15.
- [CrossRef] [PubMed] [Google Scholar]
- Comparison of Xpert MTB/RIF with line probe assay for detection of rifampin-monoresistant Mycobacterium tuberculosis. J Clin Microbiol. 2014;52:1846-52.
- [CrossRef] [PubMed] [Google Scholar]
- The role of antibodies in tuberculosis diagnosis, prophylaxis and therapy: A review from the ESGMYC study group. Eur Respir Rev. 2022;31:210218.
- [CrossRef] [PubMed] [Google Scholar]
- A toolbox for tuberculosis (TB) diagnosis: An Indian multi-centric study (2006-2008); Evaluation of serological assays based on PGL-Tb1 and ESAT-6/CFP10 antigens for TB diagnosis. PLoS One. 2014;9:e96367.
- [CrossRef] [PubMed] [Google Scholar]
- Interferon-gamma assays in the immunodiagnosis of tuberculosis: A systematic review. Lancet Infect Dis. 2004;4:761-76.
- [CrossRef] [PubMed] [Google Scholar]
- Host markers in QuantiFERON supernatants differentiate active TB from latent TB infection: Preliminary report. BMC Pulm Med. 2009;9:21.
- [CrossRef] [PubMed] [Google Scholar]
- Distinguishing tuberculosis from Mycobacterium avium complex disease using an interferon-gamma release assay. Int J Tuberc Lung Dis. 2011;15:635-40.
- [CrossRef] [PubMed] [Google Scholar]
- Diagnostic performance of commercially available enzyme-linked immunosorbent assay kit in the diagnosis of extrapulmonary tuberculosis. J Lab Physicians. 2013;5:11-6.
- [CrossRef] [PubMed] [Google Scholar]
- Poor performance of serological tests in the diagnosis of pulmonary tuberculosis: Evidence from a contact tracing field study. PLoS One. 2012;7:e40213.
- [CrossRef] [PubMed] [Google Scholar]
- Performance of purified antigens for serodiagnosis of pulmonary tuberculosis: A meta-analysis. Clin Vaccine Immunol. 2009;16:260-76.
- [CrossRef] [PubMed] [Google Scholar]
- Commercial serological tests for the diagnosis of active pulmonary and extrapulmonary tuberculosis: An updated systematic review and meta-analysis. PLoS Med. 2011;8:e1001062.
- [CrossRef] [PubMed] [Google Scholar]
- WHO-strategic and technical advisory group for tuberculosis (STAG-TB) Geneva, Switzerland: World Health Organization; 2011.
- [Google Scholar]
- Laboratory diagnosis of tuberculosis in resource-poor countries: Challenges and opportunities. Clin Microbiol Rev. 2011;24:314-50.
- [CrossRef] [PubMed] [Google Scholar]
- Comparative proteomic analysis of sequential isolates of Mycobacterium tuberculosis from a patient with pulmonary tuberculosis turning from drug sensitive to multidrug resistant. Indian J Med Res. 2015;141:27-45.
- [CrossRef] [PubMed] [Google Scholar]
- Evaluation of 5 novel protein biomarkers for the rapid diagnosis of pulmonary and extra-pulmonary tuberculosis: Preliminary results. Sci Rep. 2017;7:44121.
- [CrossRef] [PubMed] [Google Scholar]
- Continuous cultures of fused cells secreting antibody of predefined specificity 1975. J Immunol. 2005;174:2453-5.
- [Google Scholar]
- Comparison of hybridoma screening methods for the efficient detection of high-affinity hapten-specific monoclonal antibodies. J Immunol Methods. 2008;329:184-93.
- [CrossRef] [PubMed] [Google Scholar]
- A rapid and sensitive method for the quantitation of microgram quantities of protein utilizing the principle of protein-dye binding. Anal Biochem. 1976;72:248-54.
- [CrossRef] [PubMed] [Google Scholar]
- Preparation and purification of monoclonal antibodies against chloramphenicol. Cytotechnology. 2012;64:157-63.
- [CrossRef] [PubMed] [Google Scholar]
- Field evaluation of a blood based test for active tuberculosis in endemic settings. PLoS One. 2017;12:e0173359.
- [CrossRef] [PubMed] [Google Scholar]
- Tuberculosis diagnostics: Challenges and opportunities. Lung India. 2012;29:259-66.
- [CrossRef] [PubMed] [Google Scholar]
- Liquid vs. Solid culture for tuberculosis: Performance and cost in a resource-constrained setting. Int J Tuberc Lung Dis. 2010;14:1024-31.
- [Google Scholar]
- Comparison of Mycobacterium tuberculosis drug susceptibility using solid and liquid culture in Nigeria. BMC Res Notes. 2013;6:215.
- [CrossRef] [PubMed] [Google Scholar]
- Liquid vs solid culture medium to evaluate proportion and time to change in management of suspects of tuberculosis-a pragmatic randomized trial in secondary and tertiary health care units in Brazil. PLoS One. 2015;10:e0127588.
- [CrossRef] [PubMed] [Google Scholar]
- Point of care diagnostics for tuberculosis. Pulmonology. 2018;24:73-85.
- [CrossRef] [PubMed] [Google Scholar]
- A tuberculosis biomarker database: The key to novel TB diagnostics. Int J Infect Dis. 2017;56:253-7.
- [CrossRef] [PubMed] [Google Scholar]
- Tuberculosis: Advances and challenges in development of new diagnostics and biomarkers. Lancet Infect Dis. 2018;18:e199-210.
- [CrossRef] [PubMed] [Google Scholar]
- Tuberculosis biomarkers: From diagnosis to protection. Infect Dis Rep. 2016;8:6568.
- [CrossRef] [PubMed] [Google Scholar]
- Commercial serological antibody detection tests for the diagnosis of pulmonary tuberculosis: A systematic review. PLoS Med. 2007;4:e202.
- [CrossRef] [PubMed] [Google Scholar]
- Defining the needs for next generation assays for tuberculosis. J Infect Dis. 2015;211:S29-38.
- [CrossRef] [PubMed] [Google Scholar]
- Evaluation of antibody responses to panels of M. tuberculosis antigens as a screening tool for active tuberculosis in Uganda. PLoS One. 2017;12:e0180122.
- [CrossRef] [PubMed] [Google Scholar]
- Identification of specific antibodies against the Ag85C-MPT51-HspX fusion protein (CMX) for serological screening of tuberculosis in endemic area. Expert Rev Clin Immunol. 2017;13:837-43.
- [CrossRef] [PubMed] [Google Scholar]
- Diagnostic performance and problem analysis of commercial tuberculosis antibody detection kits in China. Mil Med Res. 2018;5:10.
- [CrossRef] [PubMed] [Google Scholar]
- Pathogen-derived biomarkers for active tuberculosis diagnosis. Front Microbiol. 2014;5:549.
- [CrossRef] [PubMed] [Google Scholar]
- Comparison of the performance of urinary Mycobacterium tuberculosis antigens cocktail (ESAT6, CFP10, and MPT64) with culture and microscopy in pulmonary tuberculosis patients. Int J Microbiol. 2017;2017:3259329.
- [CrossRef] [PubMed] [Google Scholar]
- Combined use of Western blot/ELISA to improve the serological diagnosis of human tuberculosis. Braz J Infect Dis. 2005;9:35-43.
- [CrossRef] [PubMed] [Google Scholar]
- Serodiagnosis efficacy and immunogenicity of the fusion protein of Mycobacterium tuberculosis composed of the 10-kilodalton culture filtrate protein, ESAT-6, and the extracellular domain fragment of PPE68. Clin Vaccine Immunol. 2012;19:536-44.
- [CrossRef] [PubMed] [Google Scholar]
- Mycobacterium tuberculosis secreted proteins as potential biomarkers for the diagnosis of active tuberculosis and latent tuberculosis infection. J Clin Lab Anal. 2015;29:375-82.
- [CrossRef] [PubMed] [Google Scholar]
- Identification of antibody targets for tuberculosis serology using high-density nucleic acid programmable protein arrays. Mol Cell Proteomics. 2017;16:S277-89.
- [CrossRef] [PubMed] [Google Scholar]
- IgA and IgG against Mycobacterium tuberculosis Rv2031 discriminate between pulmonary tuberculosis patients, Mycobacterium tuberculosisinfected and non-infected individuals. PLoS One. 2018;13:e0190989. doi:10.1371/journal.pone.0190989
- [CrossRef] [PubMed] [Google Scholar]
- Serological diagnostic assays for HIV-associated tuberculosis in sub-Saharan Africa? Clin Vaccine Immunol. 2014;21:787-90.
- [CrossRef] [PubMed] [Google Scholar]
- Diagnostic potential of 16 kDa (HspX, a-crystalline) antigen for serodiagnosis of tuberculosis. Indian J Med Res. 2012;135:771-7.
- [Google Scholar]
- Evaluation of the diagnostic potential of region of deletion-1-encoded antigen culture filtrate protein-10 in pulmonary tuberculosis. Diagn Microbiol Infect Dis. 2007;59:295-302.
- [CrossRef] [PubMed] [Google Scholar]
- IgG, IgM and IgA antibodies against the novel polyprotein in active tuberculosis. BMC Infect Dis. 2014;14:336.
- [CrossRef] [PubMed] [Google Scholar]
- Detection of tuberculosis in HIV Co-infected individuals: Use of multiple ELISA responses to 38kDa, lipoarabinomannan and ESAT-6 of M. tuberculosis. J Clin Diagn Res. 2016;10:KC01-4.
- [CrossRef] [PubMed] [Google Scholar]
- Commercial serological tests for the diagnosis of active tuberculosis in India: Time for introspection. Indian J Med Res. 2011;134:583-7.
- [CrossRef] [PubMed] [Google Scholar]
- Lateral flow urine lipoarabinomannan assay for detecting active tuberculosis in HIV-positive adults. Cochrane Database Syst Rev. 2016;2016:CD011420.
- [CrossRef] [Google Scholar]
- Systematic review and meta-analysis of antigen detection tests for the diagnosis of tuberculosis. Clin Vaccine Immunol. 2011;18:1616-27.
- [CrossRef] [PubMed] [Google Scholar]
- Accuracy of a new rapid antigen detection test for pulmonary tuberculosis. Iran J Microbiol. 2016;8:238-42.
- [Google Scholar]
- Comparative study of Genexpert with ZN stain and culture in samples of suspected pulmonary tuberculosis. J Clin Diagn Res. 2016;10:DC09-12.
- [CrossRef] [PubMed] [Google Scholar]
- Evaluating the diagnostic accuracy of Xpert MTB/RIF assay in pulmonary tuberculosis. PLoS One. 2015;10:e0141011.
- [CrossRef] [PubMed] [Google Scholar]
- Evaluation of GeneXpert MTB/RIF assay for direct diagnosis of pulmonary tuberculosis. Saudi Med J. 2016;37:1076-81.
- [CrossRef] [PubMed] [Google Scholar]
- Performance of Xpert MTB/RIF assay in diagnosis of pleural tuberculosis by use of pleural fluid samples. J Clin Microbiol. 2015;53:3636-8.
- [CrossRef] [PubMed] [Google Scholar]
- Evaluation of the GeneXpert MTB/RIF assay for rapid diagnosis of tuberculosis and detection of rifampin resistance in pulmonary and extrapulmonary specimens. J Clin Microbiol. 2011;49:4138-41.
- [CrossRef] [PubMed] [Google Scholar]
- Identification of murine T-cell epitopes on low-molecular-mass secretory proteins (CFP11, CFP17, and TB18.5) of Mycobacterium tuberculosis. Vaccine. 2010;28:4616-25.
- [CrossRef] [PubMed] [Google Scholar]
- A novel B-cell epitope identified within Mycobacterium tuberculosis CFP10/ESAT-6 protein. PLoS One. 2013;8:e52848.
- [CrossRef] [PubMed] [Google Scholar]
- A comparison of seven tests for serological diagnosis of tuberculosis. J Clin Microbiol. 2000;38:2227-31.
- [CrossRef] [PubMed] [Google Scholar]


