
Translate this page into:
Understanding the relevance of immunological markers in severe multisystem inflammatory syndrome in children through machine learning
 , Rahul Gupta2, Nidhi Desai1, Sneha Sawant Desai1, Vijaya Gowri2, Lakshmi Shobhavat2, Maya Gupta1, Umair Ahmad Bargir1, Neha Jodhawat1, Suchitra Surve3, Sudha Chandrashekhar2, Manisha Madkaikar1,
*Corresponding author: Dr. Manisha Madkaikar, Scientist G and Director, ICMR-National Institute of Immunohaematology, Mumbai, India. madkaikarmanisha@gmail.com
-
Received: ,
Accepted: ,
How to cite this article: Yadav RM, Gupta R, Desai N, Desai SS, Gowri V, Shobhavat L, et al. Understanding the relevance of immunological markers in severe multisystem inflammatory syndrome in children through machine learning. J Lab Physicians. 2024;16:399-412. doi: 10.25259/JLP-2023-7-17-(1869)
Abstract
Objectives:
Multisystem inflammatory syndrome in children (MIS-C) is a late manifestation of SARS-CoV-2 infection, which presents with symptoms ranging from milder mucocutaneous and gastrointestinal symptoms to severe cardiovascular and neurological manifestations. We studied the clinical, biochemical, hematological, and immunological characteristics of MIS-C patients to understand this disease entity and to identify markers of severe disease.
Materials and Methods:
Twenty-four MIS-C patients, four acute COVID-19 infections, and ten healthy controls (HC) from a tertiary care pediatric hospital in Mumbai were enrolled in the study. Clinical, biochemical, hematological, and immunological parameters comprising major lymphocyte, neutrophil, and monocyte subpopulations and key activator and inhibitory markers were studied.
Statistical Analysis:
All parameters were compared between the healthy, COVID and MIS-C groups at Day 0, 7 and 14 using non-parametric statistical tests. Machine learning tools were used for multivariate data analysis to identify the immunological parameters that could help predict severe disease.
Results:
NKp46pos NK cell (%), CD11 positive eosinophil (%), D-dimer, and Tim3pos Tc (%) were identified as the most important markers that could help predict severe disease, with NKp46pos NK cells as the top contributor. A disease severity metric utilizing these markers can be used to identify patients who are likely to have a severe course of disease.
Conclusions:
NK cells directly contribute to disease severity in MIS-C. As the JAK-STAT pathway is known to be important for NK cell development, maturation, and function, ruxolitinib, which is a JAK1/JAK2 inhibitor, might be beneficial in the management of this condition.
Keywords
Immune cells
NK cells
Hyperactivation
Exhaustion
Multivariate

INTRODUCTION
Although SARS-CoV-2 infection in the pediatric population has been associated with less severe disease and fewer deaths, a small proportion manifests with a severe form of disease referred to as pediatric inflammatory, multisystem syndrome temporally associated with SARS-CoV-2 (PIMS-TS) or multisystem inflammatory syndrome in children (MIS-C).[1] It is characterized by a multi-organ (>2) dysfunction with manifestations that may include mucocutaneous, gastrointestinal, cardiovascular, neurological manifestations, and renal or hematological manifestations, along with elevated markers of inflammation, as a result of COVID-19 infection and after ruling out other plausible diagnosis.[2,3] MIS-C was first reported from London, United Kingdom, in April 2020;[4] thereafter, several case reports and studies have been reported globally and from India.[5-8] An Indian study by Bagri et al. reported that raised ferritin level may be a poor prognostic marker and that the choice of immunomodulation between steroids and intravenous immunoglobulin (IVIG) did not affect outcome.[7] Another Indian study by Tiwari et al. reported hyperferritinemia, raised N-terminal pro b-type natriuretic peptide, and high D-dimer as predictors of severe outcome.[8] One study reported an estimated population-based incidence of MIS-C at 316 cases per million SARS-CoV-2 infections.[9]
Several hypotheses have tried to explain the pathogenesis of MIS-C. Being a late manifestation of COVID-19 with the presence of serum immunoglobulin G (IgG) antibodies against SARS-CoV-2 in over 70% at the time of presentation, there is the possibility of antibody-driven pathogenesis.[10] An exaggerated inflammatory response associated with slow viral clearance responsive to immunomodulatory treatment has also been implicated in the multiorgan involvement.[11] Few studies to decipher the immune profile in MIS-C have revealed a reduction of non-classical monocytes and subsets of NK and T lymphocytes, suggesting extravasation to affected tissues, which might be responsible for the multi-organ manifestations.[11,12] There is an increased level of infective biomarkers such as procalcitonin, serum ferritin, C-reactive protein, and also inflammatory cytokines resembling the cytokine storm seen in secondary hemophagocytic lymphohistiocytosis.[13,14]
As this disease entity presents with overlapping clinical manifestations and biochemical abnormalities with Kawasaki disease (KD)[15] and Macrophage Activation Syndrome,[16] the disease is managed mainly with IVIG and corticosteroids found to be beneficial in these conditions. However, MIS-C characteristically differs from KD in terms of age at onset (more than seven years), thrombocytopenia, predominantly gastrointestinal manifestations, and diffuse cardiovascular involvement pointing toward a generalized immune-mediated disease and higher inflammatory markers.[17-20] Hence, it becomes extremely important to understand the perturbations and pathophysiology unique to MIS-C to be able to diagnose, monitor, and manage more effectively. We conducted immune profiling of patients with MIS-C, COVID-19, and healthy controls (HCs) to compare the immune and cytokine signatures and to understand the immunological abnormalities in MIS-C.
MATERIALS AND METHODS
Selection of participants
A prospective observational pediatric hospital-based study was carried out from October 2020 to September 2021 in Mumbai, India [Figure 1]. The study recruited 24 patients diagnosed with MIS-C from the hospital intensive care unit, four patients with acute COVID-19 infection, and ten age-matched HCs. Acute COVID-19 and MIS-C were diagnosed according to WHO criteria. HCs were identified among accompanying siblings of patients admitted to the hospital and tested negative for SARS-CoV-2 on reverse transcription polymerase chain reaction (RT-PCR).
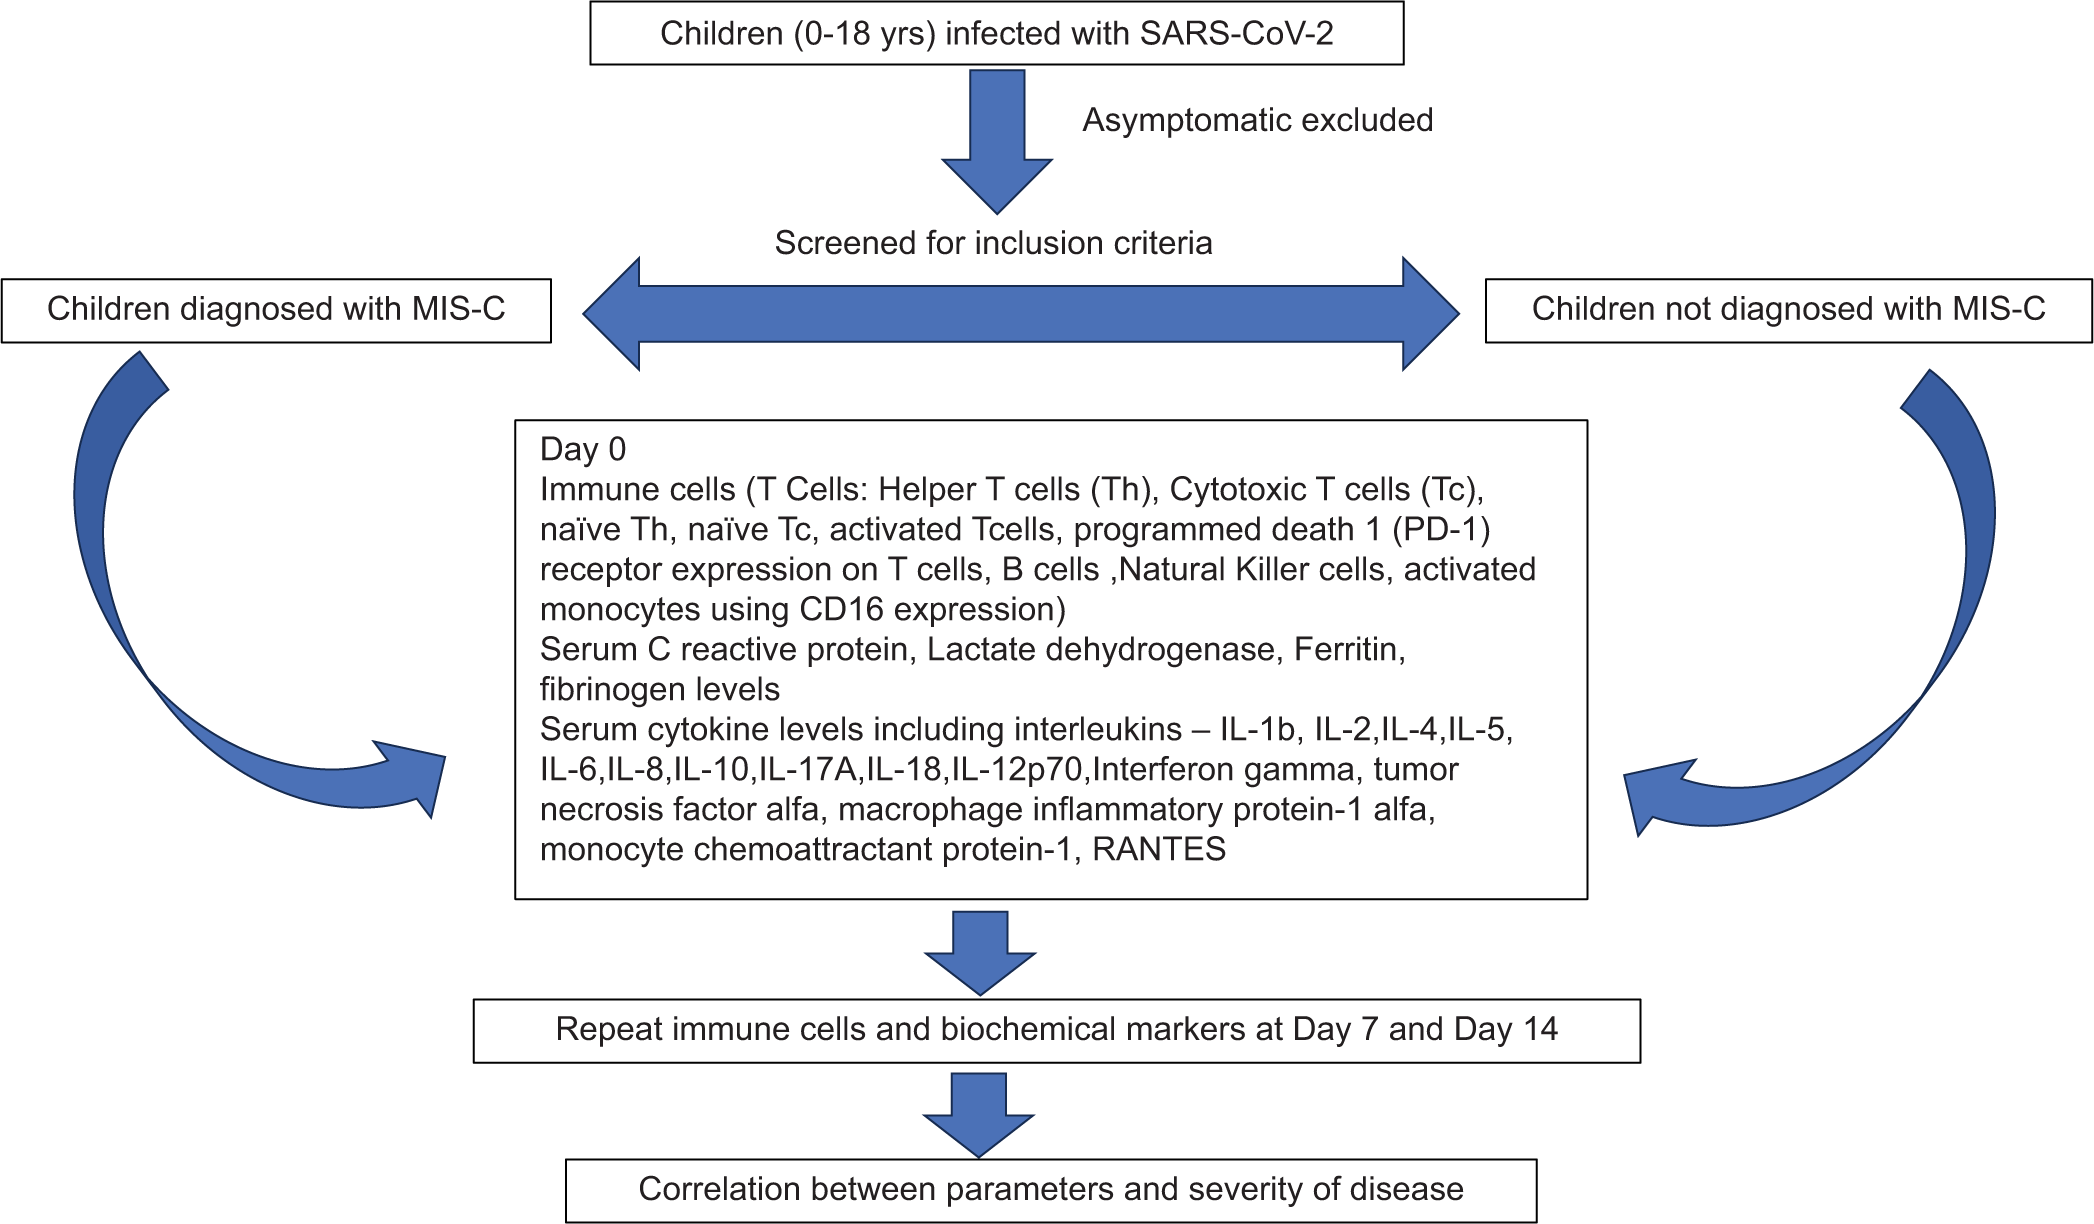
- Flow chart representing study methods. SARS-CoV-2: Severe Acute Respiratory Syndrome Coronavirus 2; MIS-C: Multisystem inflammatory syndrome in children; RANTES: Regulated upon Activation, Normal T Cell Expressed and Presumably Secreted. IL: Interleukin
The clinical details including symptoms, history of COVID contact, clinical examination findings, hematological parameters, liver and kidney function tests including serum creatinine, and liver enzymes, SARS-CoV-2 testing by RT-PCR, respiratory virus panel (including Respiratory synctitial virus A and B, Influenza A, B, C, and H1N1, Parainfluenza 1,2,3 and 4, Metapneumovirus A and B, Rhinovirus, Adenovirus, Enterovirus, Parechovirus, Bocavirus, and Coronavirus NL63, 229E, OC43, and HKU1), bacterial screen (including Streptococcus pneumoniae, Haemophilus influenzae type B, Staphylococcus aureus, Moraxella catarrhalis, Bordetella spp., Klebsiella pneumoniae, Pseudomonas aeruginosa, and Acinetobacter baumannii), biochemical profile for inflammatory (Serum C-reactive protein [CRP], lactate dehydrogenase [LDH] levels, and ferritin) and coagulation marker (prothrombin time [PT], activated partial thromboplastin time [aPTT], and D-dimer), radiological findings, 2D-ECHO findings, and management details were recorded in a structured questionnaire after obtaining informed consent. Blood samples from patients were drawn before initiation of treatment (Day 0) (n = 21) and while on treatment with steroids +/− IVIG on Day 7 (n = 5) and Day 14 (n = 5) for immune profiling and cytokine analysis. All patients were screened for coronary artery dilatation at admission. Patients with persistent fever or hemodynamic compromise were monitored for coronary artery dilatation during hospitalization.
Biochemical and immunological parameters
Serum CRP, LDH levels, and ferritin were detected by enzyme-linked immunosorbent assay (Calbiotech, CA). COVID-19 total antibodies (IgM+IgG+IgA) were tested by Microelisa kit (J Mitra&Co.). Serum cytokine levels of interferon-gamma (INFg), interleukin-1 receptor antagonist (IL1RA), interleukin 1 beta (IL-1b), interleukin (IL)-2, IL-4, IL-5, IL-6, IL-8, IL-10, IL-18, IL-17A, IL-18, IL12p70, tumor necrosis factor-alpha (TNFa), macrophage inflammatory protein-1 alpha, monocyte chemoattractant protein-1, and RANTES were assessed by bead-based assay (Custom Aimplex panel) on a DXFLEX flow cytometer (Beckman Coulter).
Thrombocytopenia was defined as a platelet count <150 × 109/L, and lymphopenia as a lymphocyte count <1 × 10⁹/L on admission. CRP <6 mg/L, D-dimer <1 mg/L, and ferritin <200 ng/mL were considered to be within the normal range.
The immune cell subsets of T-cells, B-cells, natural killer cells, monocytes, and neutrophils were determined by flow cytometry based immunophenotyping by staining them with fluorochrome conjugated antibodies (fluorochrome, clone, catalog number in Supplementary file S1) to cell surface proteins specific to the type of immune cells. The different immune cells and their subpopulations quantified are presented in Table 1.
| Major immune cell | Immune cell subpopulation | Surface markers |
|---|---|---|
| Lymphocytes | ||
| T lymphocytes | CD3+ | |
| Activated T lymphocytes | CD3+HLA-DR+ | |
| Exhausted T lymphocytes | CD3+PD1+Tim3+ | |
| Helper T lymphocytes | CD3+CD4+ | |
| Activated helper T lymphocytes | CD3+CD4+HLA-DR+ | |
| Exhausted helper T lymphocytes | CD3+CD4+PD1+Tim3+ | |
| Cytotoxic T lymphocytes | CD3+CD8+ | |
| Activated cytotoxic T lymphocytes | CD3+CD8+HLA-DR+ | |
| Exhausted cytotoxic T lymphocytes | CD3+CD8+PD1+Tim3+ | |
| Regulatory T cells | CD3+CD4+CD25+CD127low | |
| B lymphocytes | CD19+CD3− | |
| Naïve (pre-germinal) | CD19+CD27−IgD+IgM+ | |
| Total memory | CD19+CD27+ | |
| Class-switched memory | CD19+CD27+IgD−IgM− | |
| Marginal zone | CD19+CD27+IgD+IgM+ | |
| IgM only memory | CD19+CD27+IgD−IgM+ | |
| Plasmablast | CD19+CD27+CD24−CD38+high | |
| NK lymphocytes | CD3−CD16+and/or CD56+ | |
| Early NK | CD56bright | |
| Effector NK | CD56dim | |
| Terminal NK | CD16+CD56− | |
| Mature NK | CD16+CD56+CD57+ | |
| Activated NK cells | CD16+CD56+NKp46+ | |
| NK T lymphocytes | CD3+CD16+and/or CD56+ | |
| Monocyte | HLA-DR+CD14+and/or CD16+ | |
| Classical | CD14+CD16− | |
| Intermediate | CD14+CD16+ | |
| Non-classical | CD14−CD16+ | |
| Activated monocytes | CD206+CD14+ | |
| Neutrophils | CD45intCD15hiCD16+ | |
| Eosinophils | CD45hiCD15intCD16− |
CD: Cluster of differentiation molecule, HLA-DR: Human Leukocyte Antigen – DR, NK: Natural Killer, Ig: Immunoglobulin, Tim3- T cell immunoglobulin and mucin domain-containing protein 3, PD1- Programmed death-1
Statistical analysis
Statistical tests were performed in RStudio version 3.3.2 using non-parametric tests unless specified otherwise using ggplot2 for data visualization. Comparisons across groups were done using Kruskal–Wallis using Dunn’s post hoc test for subsequent pairwise comparisons between the groups. Data are represented as median (Q1 and Q3) for relevant parameters. When analyzing patient samples collected at different time points (D0, D7, and D14), we compared values from each time point to the HC. Comparison between COVID and MIS-C (D0) was also performed.
We conducted multivariate analysis to identify the immunological parameters that could help predict severe disease. We first used the least absolute shrinkage and selection operator (LASSO) regression technique to select the set of features that best contributed to the model and then used principal component analysis (PCA) to visualize the differences between mild and severe disease courses using the LASSO selected features. LASSO regression was performed using the glmnet package. PCA was performed using the ggfortify and factoextra packages. Correlation between clinical manifestations, biochemical parameters, and history was done using Spearman rank order correlation. corrplot package was used for visualization of the Spearman correlation coefficient using hierarchical clustering. A variable importance plot was created using the randomForest package. igraph package was used for network analysis. For all comparisons, P < 0.05 was considered significant.
RESULTS
Demographic and clinical characteristics
The demographic and clinical characteristics of MIS-C patients are depicted in Table 2. The median age of presentation with MIS-C was 6 years (interquartile range [IQR] 5–9 years) as compared to COVID-19 with a median age of 3.5 years (IQR 2 months to 6 years). Fourteen (58%) MIS-C patients were more than 5 years of age, and 55% were male. The median interval from symptom onset to admission was 3 days (IQR 3–4 days). The most common clinical manifestation was coagulation abnormalities depicted by abnormal PT, aPTT, or D-dimer (96%), bilateral non-purulent conjunctivitis (79%), polymorphous non-blanching rash (75%), hypotension (67%), gastrointestinal manifestations comprising abdominal pain and vomiting (60%), respiratory distress (40%), cardiac abnormalities (38%) comprising dilated coronaries, myalgia (29%), and abnormal liver enzymes (20%). Radiological evidence of pneumonia was present in 16% of MIS-C patients and about 45% also had upper respiratory symptoms. Respiratory virus panels, including RT-PCR for SARS-CoV-2 and bacterial infection screens, were negative in all patients at hospitalization. Eighteen (75%) patients were seropositive for SARS-CoV-2 IgG antibodies, and 3 (12.5%) though seronegative for SARS-CoV-2 IgG antibodies, had a history of COVID-19 infection. The range of clinical manifestations observed in MIS-C and COVID-19 is presented in a radar plot, as shown in Figure 2a. One patient had the involvement of two organ systems, 13 with the involvement of five organ systems, seven with the involvement of four organ systems, and eight with the involvement of five organ systems. There were no pre-existing comorbidities except for one patient with pre-existing heart disease. Pediatric early warning signs score (PEWS score) was determined to identify pediatric patients at risk for clinical deterioration based on behavior, capillary filling time, respiratory rate, quarter-hourly nebulization requirement, and persistent vomiting. The median PEWS score was five in MIS-C patients, indicating high risk, and two for patients with COVID-19, indicating low risk of deterioration of the clinical condition. Among patients with PIMS, 25% of patients had scores between 0 and 2, indicating low risk; 8% of patients had scores between 3 and 4, indicative of intermediate risk; and 67% of patients had a score ≥5, indicative of high risk of deterioration.
| Parameter | Frequency (%) (n=24) |
|---|---|
| Gender, male | 13 (55) |
| Age more than 5 years | 14 (58) |
| Symptoms (at admission) | |
| Fever | 24 (100) |
| Cough | 8 (33) |
| Rhinorrhea | 7 (29) |
| Myalgia | 7 (29) |
| Rash | 18 (75) |
| Conjunctivitis | 19 (79) |
| Reduced appetite | 6 (25) |
| Abdominal pain | 14 (58) |
| Vomiting | 4 (17) |
| Diarrhea | 3 (12) |
| Hypotension | 16 (67) |
| Evidence of coagulopathy | 23 (96) |
| Cardiac abnormalities | 9 (38) |
| Need for ICU at admission | 18 (75) |
| PEWS score | |
| 0–2 (low risk) | 6 (25) |
| 3–4 (intermediate risk) | 2 (8) |
| ≥5 (high risk) | 16 (67) |
| Pre-existing chronic illness | |
| Diabetes | 0 (0) |
| Hypertension | 0 (0) |
| Liver disease | 1 (4) |
| Heart disease | 1 (4) |
| Kidney disease | 0 (0) |
| Malnutrition | 0 (0) |
| Tuberculosis | 0 (0) |
| Management | |
| Modality of respiratory support | |
| Nasal Cannula | 8 (33) |
| Face mask | 0 (0) |
| BiPAP | 0 (0) |
| Vasopressor support | 15 (62) |
| Mechanical ventilation support | 4 (17) |
| Drugs | |
| Remdesivir | 0 (0) |
| Tocilizumab | 1 (4) |
| Azithromycin | 3 (12) |
| Methylprednisolone | 24 (100) |
| Intravenous immunoglobulin | 10 (42) |
| Outcome | |
| Recovered | 23 (96) |
| Death | 1 (4) |
MIS-C: Multisystem Inflammatory Syndrome in Children, ICU: Intensive care unit, BiPAP: Bilevel positive airway pressure. PEWS: Pediatric early warning systems
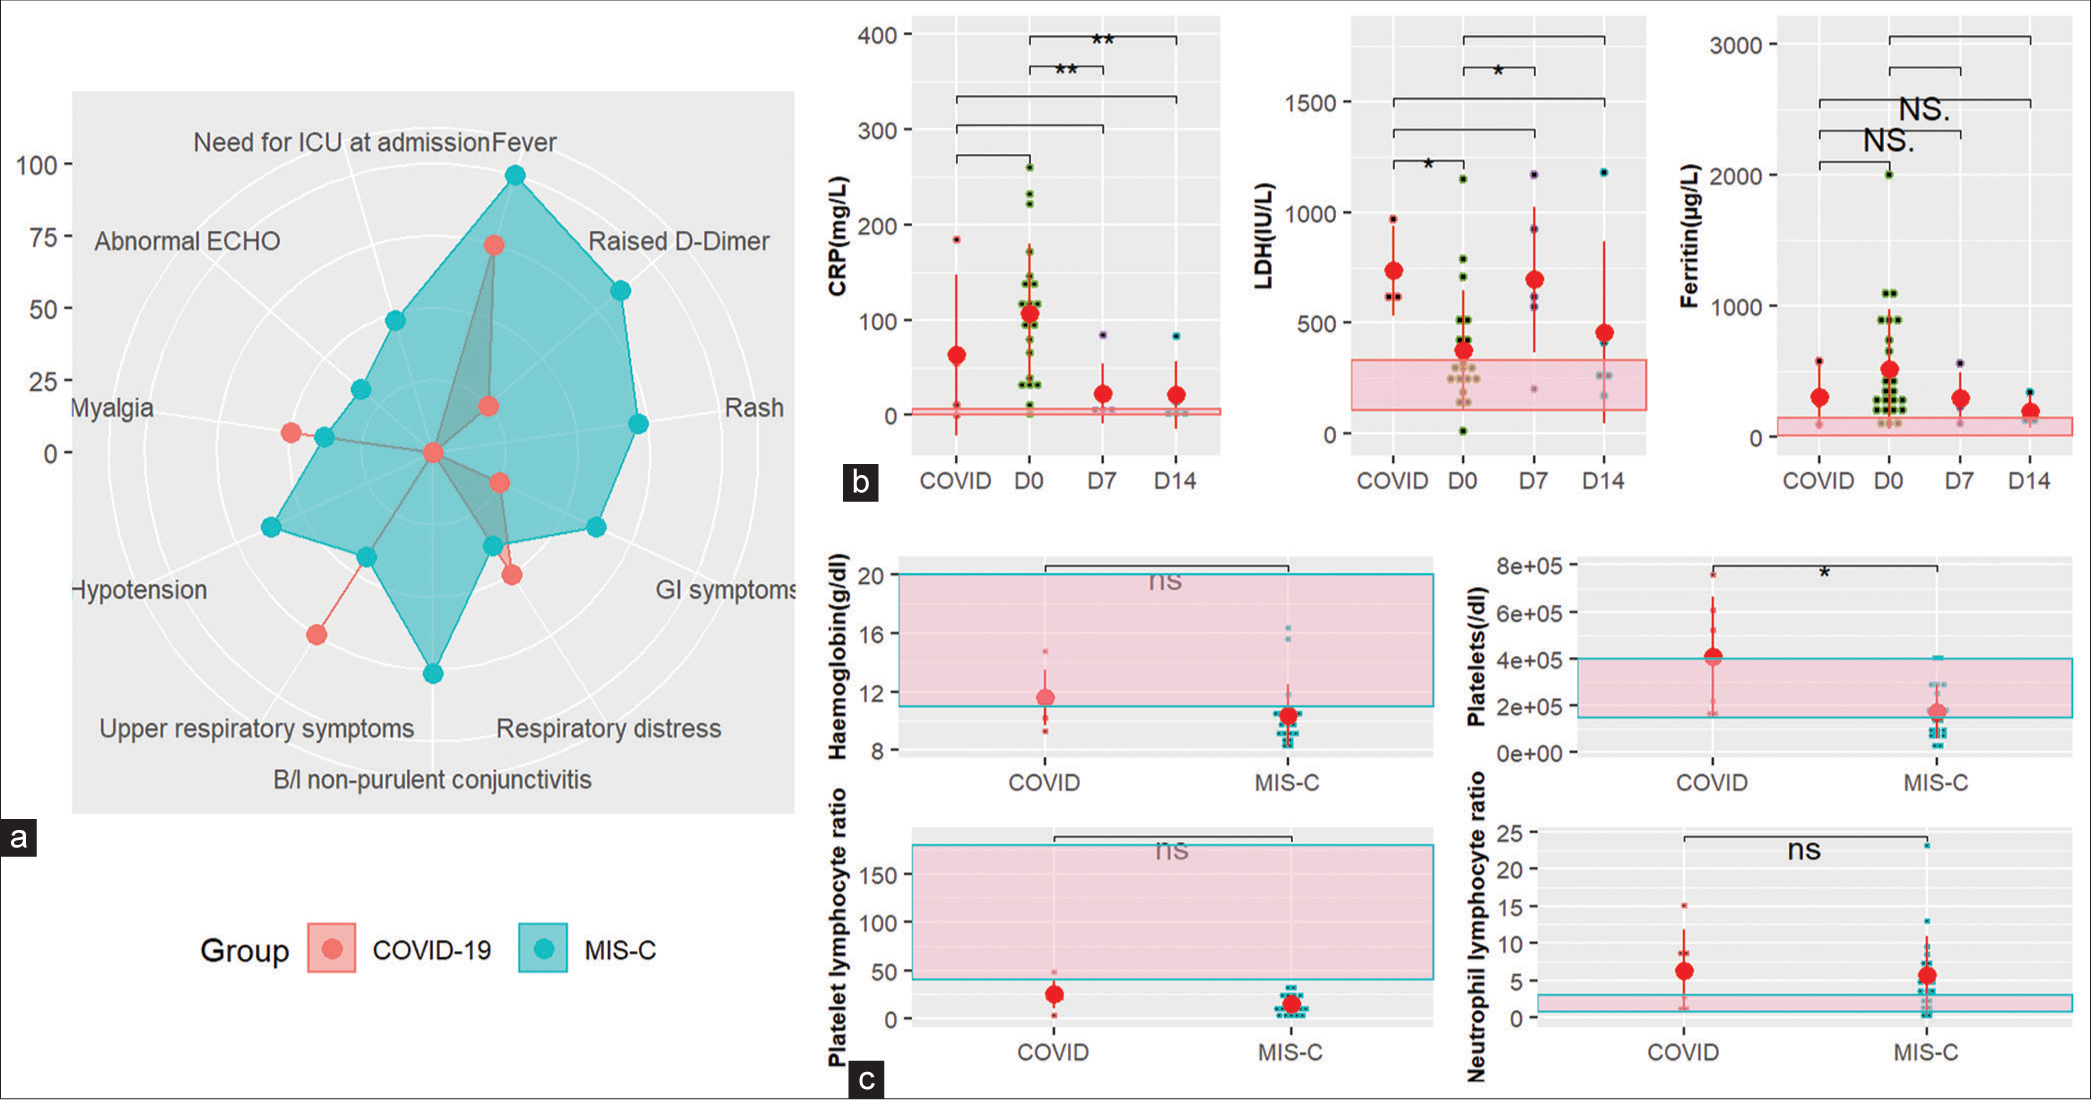
- Clinical, biochemical, and hematological characteristics. (a) Radar plot showing the range of manifestations in PIMS and COVID-19 patients. (b) Trend of inflammatory markers CRP, LDH, and ferritin in MIS-C patients over 2 weeks compared to COVID-19 patients at diagnosis. (c) Hematological parameters at admission in MIS-C patients compared to COVID-19 patients. CRP: C-reactive protein, LDH: Lactate dehydrogenase, MIS-C: Multisystem inflammatory syndrome in children, ICU: Intensive care unit, ECHO: Echocardiogram, GI: Gastrointestina, NS/ns: Not significant. If p-value is <0.05, 0.01, and 0.001, it is flagged as ‘*’, ‘**’, and ‘***’ respectively. (b-c) Black small dots represent patient values, and big red dots represent the median. Red vertical line represents the interquartile range.
Eighteen (75%) of the patients required intensive care unit admission at the time of diagnosis, either for monitoring or management of hypotension/shock/respiratory distress. The vasoactive infusion was required by 15 (62%) of the patients and mechanical ventilation by 4 (16.7%). All patients received methylprednisolone (MP) for immunomodulation, 10 (42%) patients received IVIG, and 1 (4%) each received remdesivir and tocilizumab in addition to MP. The outcome for all but one patient with pre-existing heart disease was favorable.
Inflammatory and hematological characteristics
Inflammatory markers were elevated at the time of enrolment, with CRP elevated in all (median 99 [62.25– 143.5] mg/L]), LDH in 61.9% (median 277 [236–501 IU/L]), and ferritin in 83% (median 342 [195–885 mg/L]) patients. The levels gradually reduced toward the baseline for CRP and ferritin; however remained elevated for LDH, as shown in Figure 2b. The platelet counts were low in 61.9% of the MIS-C patients at enrolment, and the difference was significant (P < 0.05) between COVID and MIS-C. Platelet lymphocyte ratio was low in both groups; however, the difference was not significant. Hemoglobin levels were low in 85% of MIS-C patients; however, the difference with the COVID group was not significant. A majority of patients (75%) had high polymorphonuclear (PMN) counts along with a high neutrophil-to-lymphocyte ratio (70%) consistent with observations during COVID-19 illness [Figure 2c]. The median absolute neutrophil and lymphocyte counts were 11303 (5500–24500)/mL and 859 (24–4293)/mL at admission.
Innate and adaptive immune cells
The major lymphocyte subsets, namely, B, T, and NK lymphocyte subset absolute counts were significantly reduced (P < 0.05) between HC and MIS-C patients at enrolment with a median count of 217 (46–659)/mL, 597 (318–1782)/mL, and 61 (12–86)/mL, respectively, and continued to remain low after two weeks. Although the absolute counts were low, T-cell percentages remained unchanged between PIMS and HC, and B-cell and NK cell percentages were reduced. The NK cell percentages recovered in two weeks; however, B-cell percentages remained low.
The absolute monocyte count was on the lower limit of normal with a median count of 219 (61–1516)/mL at admission and improved to 869/mL in two weeks. Classical, intermediate, and non-classical monocytes were significantly elevated as compared to HCs (P < 0.0001) at admission and remained high at two weeks, with classical monocytes showing a decreasing trend. The proinflammatory classical monocytes were higher than the non-classical monocytes in MIS-C, the difference being statistically significant (P < 0.0001).
The early NK cell percentage was significantly elevated (P < 0.05) in patients of MIS-C as compared to HCs, effector NK cell percentage was unaltered, and terminal NK cell percentage was reduced as compared to HCs, thereby implying that the majority of the NK cell were early NK cells.
Activation and exhaustion markers on immune subsets
Given their role in response to viral infection, we first focused on the activation and exhaustion of T-cells and their subtypes. The HLA-DR expression on T-cells, CD4 T-cells, and CD8 T-cells was elevated as compared to HC [Figure 3a], the difference though not being statistically significant. The activation of CD8 T-cells was more as compared to CD4 T-cells, which is expected in viral infections, the difference being statistically significant (P < 0.0001). Furthermore, the expression of HLA-DR remained elevated after 2 weeks on T-cells and CD8 T-cells and reduced on CD4 T-cells eventually over a period of two weeks to levels below HCs [Figure 3a].
![Immunological markers (a) HLA-DR expression (%) on T-cells, CD4 T-cells, and CD8 T-cells. (b) PD1 expression (%) on T-cells, CD4 T-cells, and CD8 T-cells. (c) Tim3 expression (%) on T-cells, CD4 T-cells, and CD8 T-cells. (d) Expression of activation markers CD206, CD64, and HLA-DR on classical and non-classical monocytes. (e) Trend of regulatory T-cell [Treg] (%) and comparison with COVID-19 and healthy controls. (f) Trend of memory and switched memory B-cells(%) and plasma blast(%). HLA-DR: Human Leukocyte Antigen – DR isotype, PD1: Programmatic cell death 1, Th: Helper T cells, Tc: Cytotoxic T cells, Tim: Transmembrane immunoglobulin and mucin, CD: cluster of differentiation, D0: Day 0, HC: Healthy control, NS/ns: Not significant, Treg: Regulatory T cells. If p-value is <0.05, 0.01, and 0.001, it is flagged as ‘*’, ‘**’, and ‘***’ respectively. Black small dots represent patient values, and big red dots represent the median. Red vertical line represents the interquartile range.](/content/164/2024/16/3/img/JLP-16-399-g003.png)
- Immunological markers (a) HLA-DR expression (%) on T-cells, CD4 T-cells, and CD8 T-cells. (b) PD1 expression (%) on T-cells, CD4 T-cells, and CD8 T-cells. (c) Tim3 expression (%) on T-cells, CD4 T-cells, and CD8 T-cells. (d) Expression of activation markers CD206, CD64, and HLA-DR on classical and non-classical monocytes. (e) Trend of regulatory T-cell [Treg] (%) and comparison with COVID-19 and healthy controls. (f) Trend of memory and switched memory B-cells(%) and plasma blast(%). HLA-DR: Human Leukocyte Antigen – DR isotype, PD1: Programmatic cell death 1, Th: Helper T cells, Tc: Cytotoxic T cells, Tim: Transmembrane immunoglobulin and mucin, CD: cluster of differentiation, D0: Day 0, HC: Healthy control, NS/ns: Not significant, Treg: Regulatory T cells. If p-value is <0.05, 0.01, and 0.001, it is flagged as ‘*’, ‘**’, and ‘***’ respectively. Black small dots represent patient values, and big red dots represent the median. Red vertical line represents the interquartile range.
The frequency of exhaustion markers PD1+ and Tim3+ was significantly high (P < 0.01) among T-cells from MIS-C patients compared to HC, also suggesting T-cell activation. The increase in PD1 and Tim3 expression was more pronounced on CD4 T and CD8 T-cells, respectively [Figure 3b and c]. The difference in expression of PD1+ and Tim3+ among CD4 and CD8 T-cells was statistically significant (P < 0.0001).
Expression of activation markers CD64 (%) on classical monocytes was significantly elevated (P < 0.05) compared to non-classical monocytes at enrolment, while HLA-DR (%) was reduced [Figure 3d]. Expression of CD64 on monocytes remained elevated even after 2 weeks; however, there was an improvement in the expression of HLA-DR on classical monocytes to near normal.
Regulatory T-cells were significantly elevated at the time of enrolment (P < 0.001) and remained elevated at Day 14 [Figure 3e]. Plasma blast expansion was observed among B-cells, which returned to normal on Day 14 [Figure 3f].
Activated innate and adaptive immune cells mark the difference in severity among PIMS patients
The severity of disease among MIS-C patients was defined as the presence of shock requiring vasopressor support for more than 6 h, coronary dilatation, or need for mechanical ventilation. Although the overall percentage of lymphocytes was significantly reduced in patients with severe disease (P < 0.05), the frequency of activated T-cells and their subsets was higher. We compared the immunological parameters among patients who developed dilated coronaries with those who did not. It was observed that NKT cells (%) and markers of cytotoxicity on NK cells, namely, NKp46 (%), were significantly low (P < 0.05), as were activation marker CD206 on monocytes among patients with dilated coronaries. The frequency of exhaustion markers, namely, PD1 and Tim3 on T-cells and adhesion marker 11b on eosinophils, was significantly increased (P < 0.05) in patients with dilated coronaries. The percentage of NKp46pos NK cells was negatively correlated with exhausted T-cells [Figure 4a].
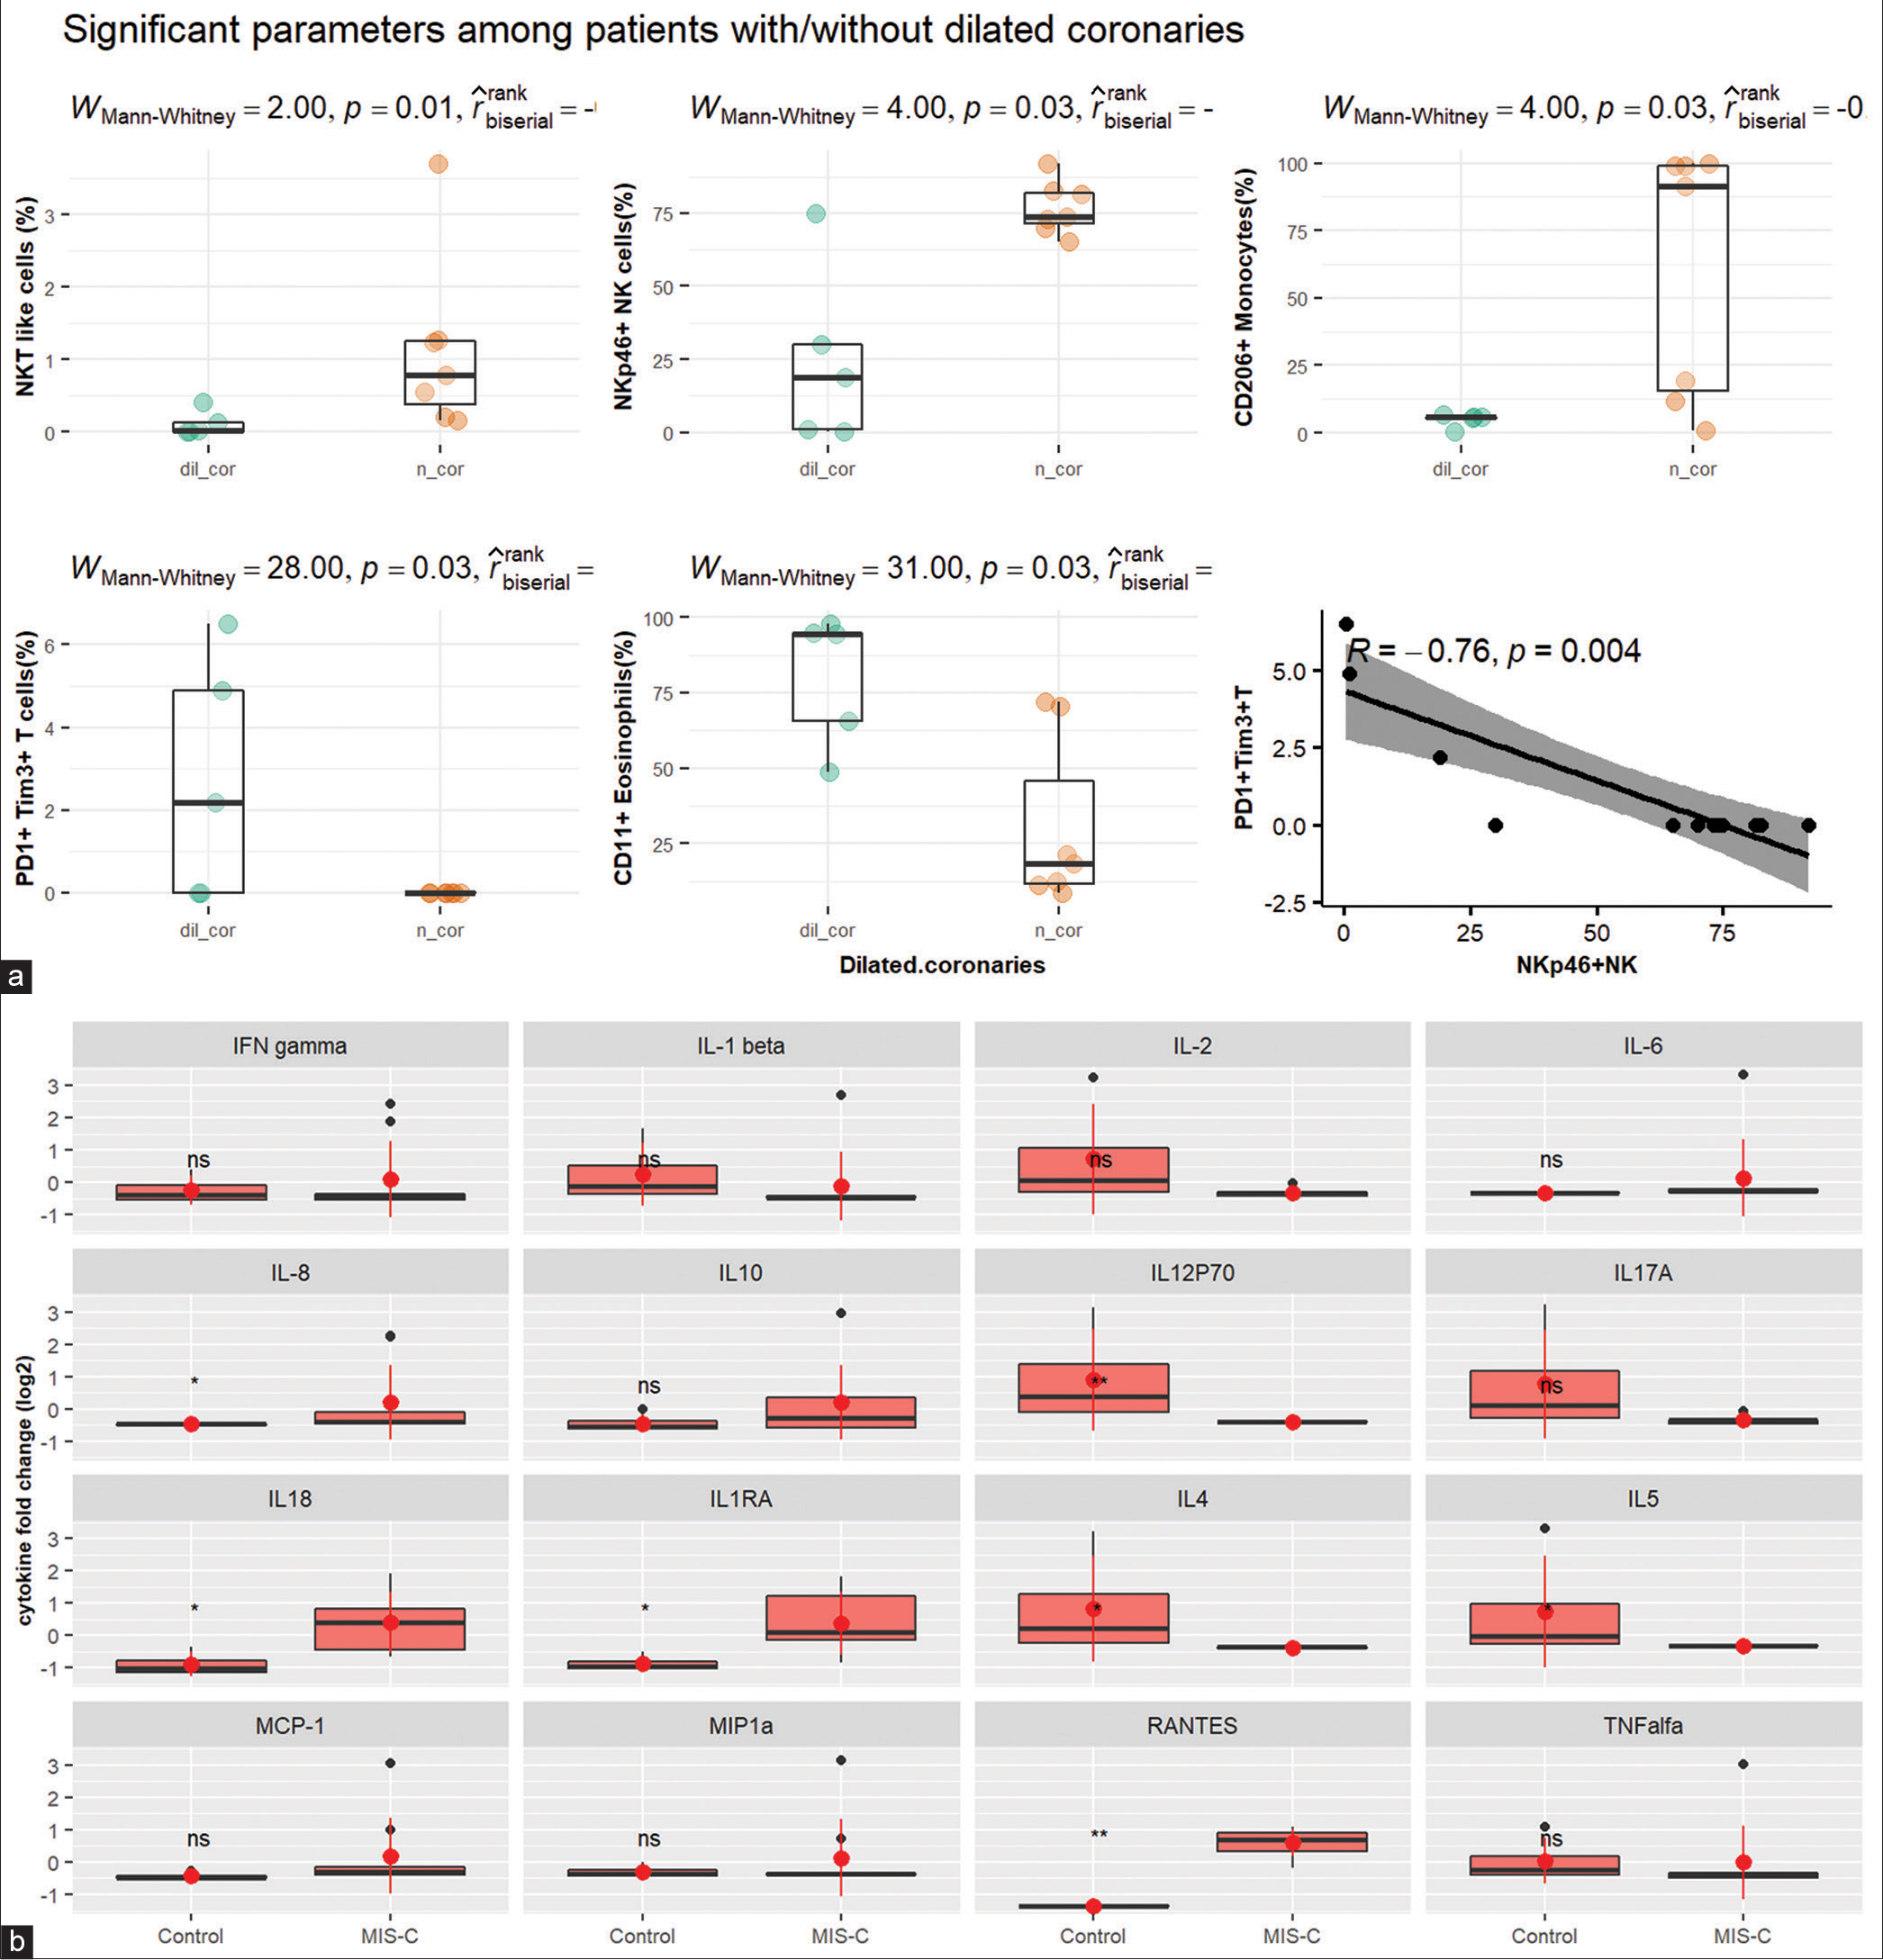
- (a) Significant parameters among patients with/without dilated coronaries. (b) Facet plot showing a comparison of cytokines between patients and healthy controls. IFN: Interferon, IL: Interleukin, MCP: Monocyte chemoattractant protein, MIP: Macrophage Inflammatory Proteins, RANTES: Regulated upon Activation, Normal T Cell Expressed and Presumably Secreted, TNF: Tumor necrosis factor. The dots represent individual patient values - orange (patients with normal coronaries), green and black dots (patients with dilated coronaries), Black small dots represent patient values, and big red dots represent the median. Red vertical line represents the interquartile range.
Cytokines
The cytokine levels could be performed for nine patients, and on comparison with HC [Figure 4b], IL-8, IL12P70, IL-18, IL1RA, IL-4, IL-5, and RANTES were found to be significantly different (P < 0.05). PCA was conducted to study the difference between mild and severe disease course using the cytokines which were significantly different among patients and controls. IL-8 and RANTES were the top two contributors to the first principal component, which explained 86% of the variability between groups.
Multivariate analysis to define parameters of disease severity
Multivariate analysis using LASSO regression selected features, namely, CD11bpositive Eosinophils (%), Tim3positive Tc cell (%), and NKp46positive NK cells (%) for differentiating mild from severe disease. These were features that were also significantly different among patients with/without dilated coronaries in univariate analysis. PCA could segregate patients into mild and severe diseases on the basis of the LASSO-selected features [Figure 5a]. NKp46pos NK cell (%) was the top contributing parameter, followed by CD11bpositive eosinophil (%), D-dimer, and Tim3pos Tc (%) [Figure 5b]. To substantiate the findings of LASSO, we also conducted a random forest classification, and a variable importance score was calculated using random forest analysis, which revealed the LASSO identified features among the top variables along with D-dimer, absolute NKT, and absolute neutrophil count [Figure 5c].
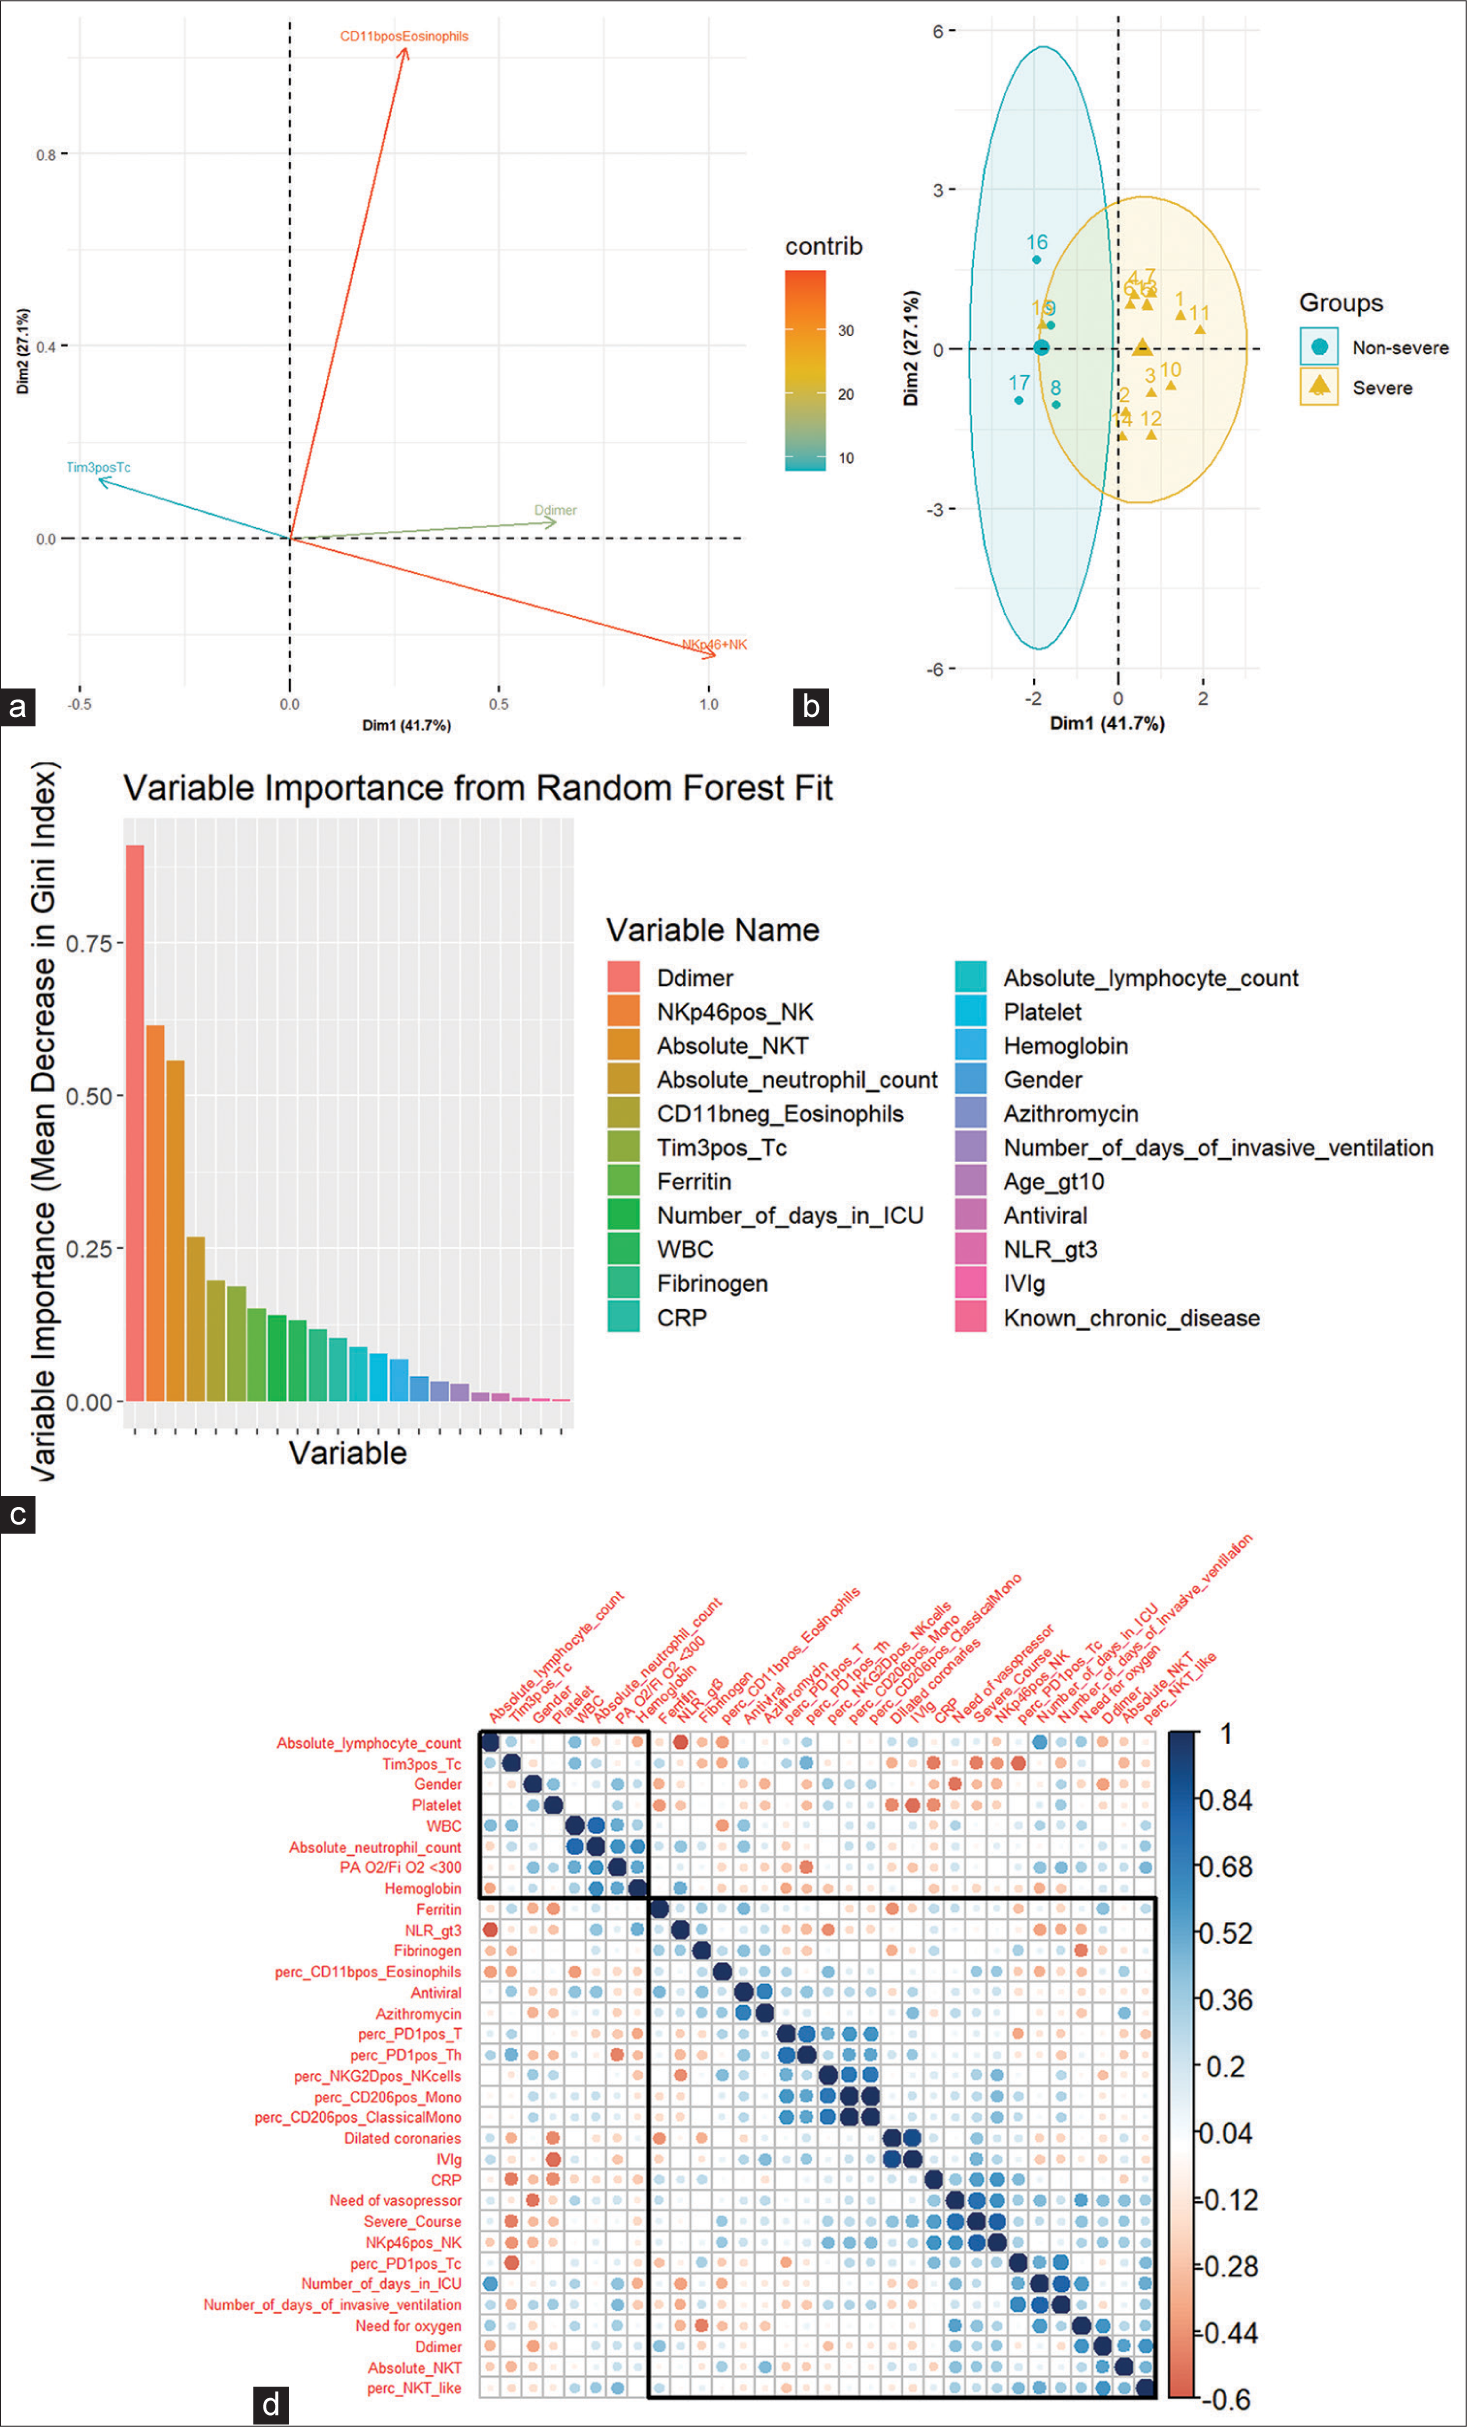
- (a) Loading plot of PCA of severity classification of variables. Each line represents one of the LASSO selected features which was significantly different between patients and controls. (b) PCA visualization of severity classification of individual patients based on LASSO-selected features. (c) Variable importance plot. (d) Spearman correlation of LASSO selected features and clinical characteristics. PCA: Principal component analysis, LASSO: Least absolute shrinkage and selection operator. NK: Natural killer cells, NKT: Natural killer T cells, WBC: White blood cells, CRP: C reactive protein, Age_gt10: Age greater than 10, NLR: Neutrophil lymphocyte ratio, IVIg: Intravenous immunoglobulin. The blue dots show a positive correlation, The red dots show a negative correlation, The size of the dots signifies the strength of the correlation
To evaluate potential associations between the clinical characteristics and the significant variables selected by LASSO regression and univariate analysis, we performed Spearman’s correlation analysis [Figure 5d]. This analysis revealed a direct positive correlation between severe disease and CRP (P = 0.02), NKp46pos NK cell % (P = 0.0), and a negative correlation with Tim3pos Tc % (P = 0.04). Other relationships were also observed between the metrics of disease severity and laboratory measures of disease and inflammation, as shown in Figure 5d.
Network analysis was performed on all immunological parameters and cytokines to study how directly the identified significant immunological parameters contributed to disease severity [Figure 6a]. The shortest path between disease severity and NKp46pos NK cells spanned through CD56bright NK cell (%) and early NK cell (%) [Figure 6b], and that between severity and absolute NKT cells spanned through CD56bright NK cell (%) and CD57pos NK cell (%) [Figure 6c], we can infer that activation of NK cells is directly correlated with severity in PIMS. Severity connects to Tim3pos Tc (%) through CD56bright NK cell (%) highlighting again the direct role of NK cells in severe disease [Figure 6d]. No direct path was observed between severity and CD11b positive eosinophils.
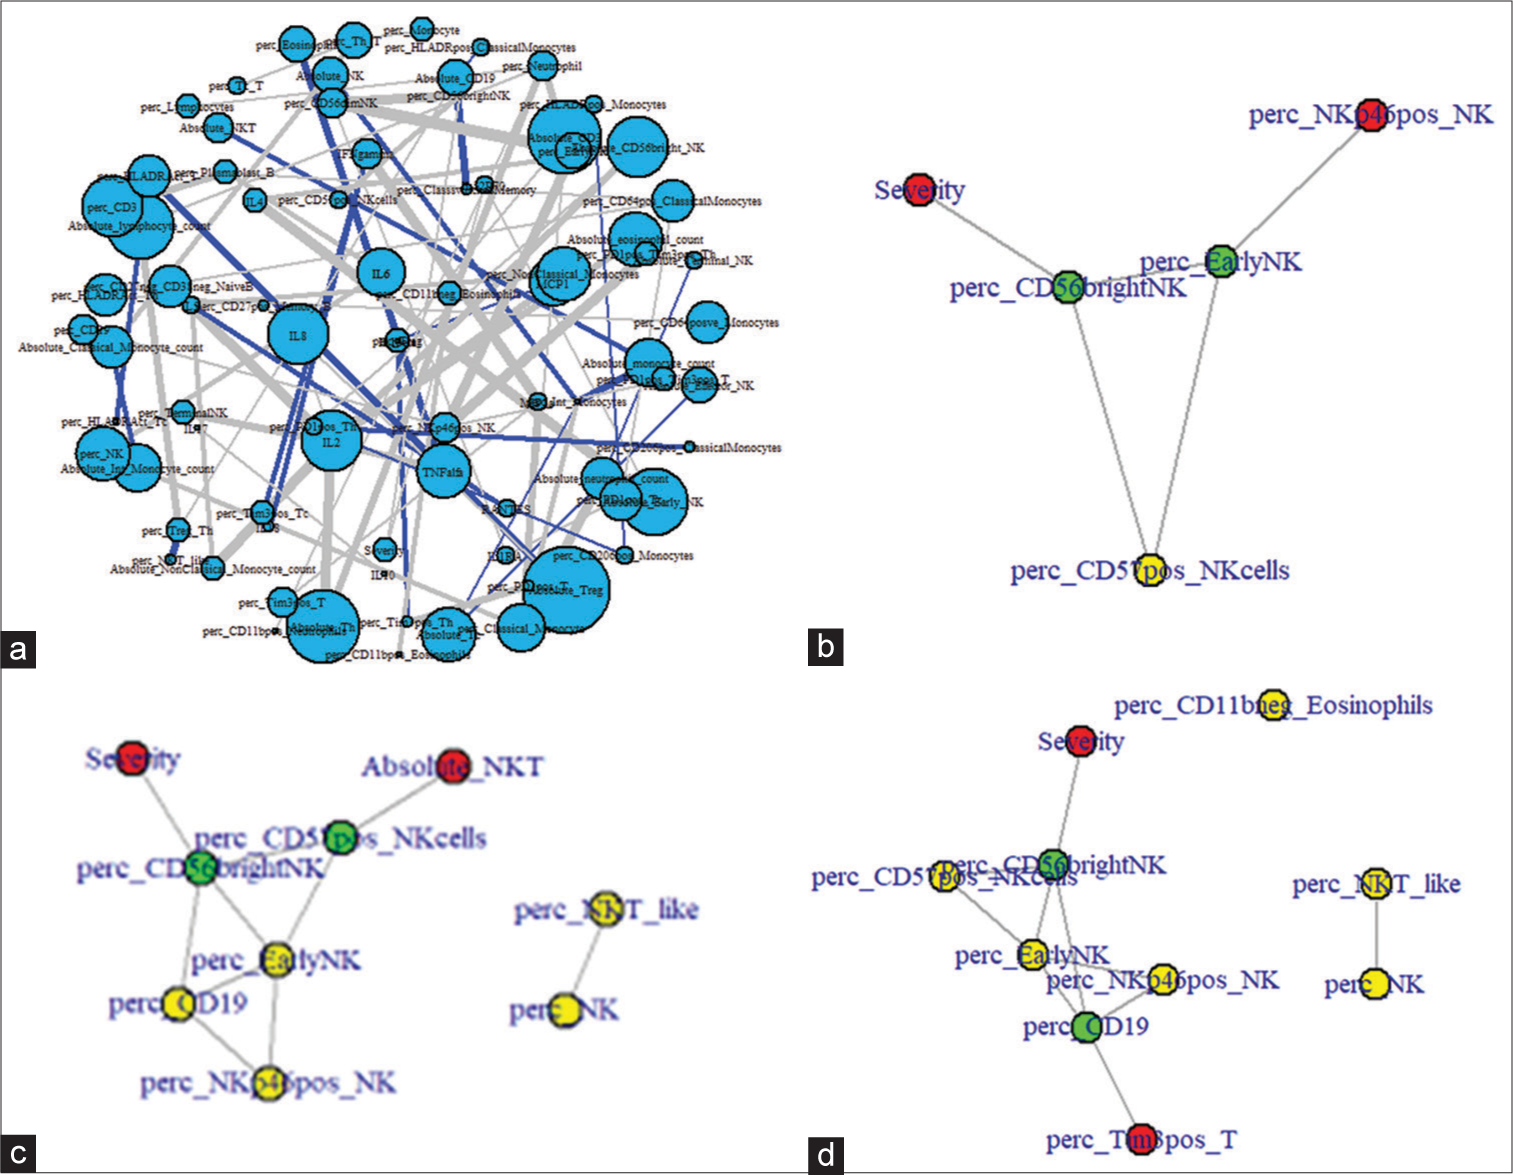
- (a) Network plot of immunological parameters and disease severity. Positive correlations between parameters are depicted in blue and negative correlations in gray. Only significant correlations have been plotted. (b) Shortest path between severity and NK+ NK cells (%). (c) Shortest path between severity and CD11+ Eosinophil (%). (d) Shortest path between severity and Tim3+ T-cell (%). perc: percentage.
Disease severity metric
The first principal component of the top five important parameters among those identified by multivariate analysis was used as a continuous severity score, the disease severity metric [Figure 7a]. Disease severity scores were then calculated for all patients using the disease severity metric and were found to be significant when compared between severe and non-severe disease course [Figure 7b]. A cutoff value of 0.2 had a sensitivity of 76% and specificity of 75% with an area under the curve of 0.84 (P < 0.002) to differentiate between mild and severe disease course [Figure 7c]. We also tried to see if more direct measures such as absolute NK/absolute NKT cells and absolute/percentage Tc cells could replace NKp46+ NK cells and Tim3+ Tc (%) to calculate the disease severity metric; however, the correlations between these parameters were not significant.
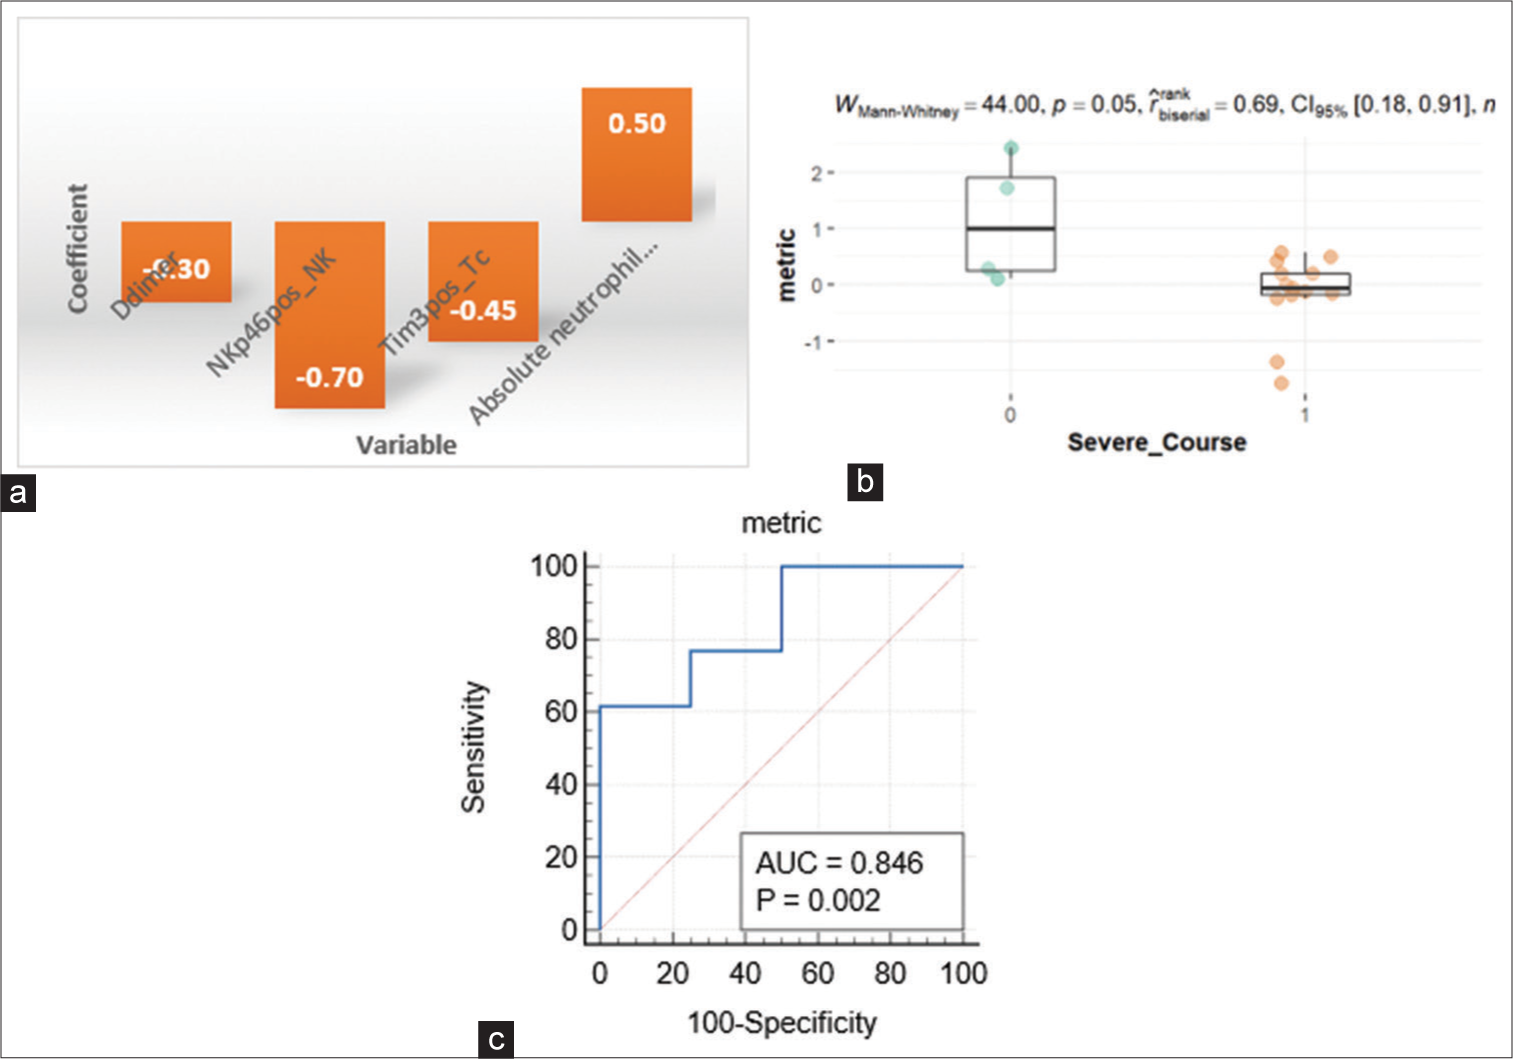
- (a) Disease severity metric. (b) Severity score comparison among severe and non-severe groups. (c) ROC for the disease severity metric. ROC: Receiver operating characteristic. AUC: Area under curve. The orange and green dots represent individual metric values for patients with severe and non-severe course respectively.
DISCUSSION
Several studies have described clinical presentations and outcomes of children with COVID-19 presenting with MIS-C.[6,7,17] This is probably the first study reported from India looking into the immunological aspects of the disease and its correlation with the disease course.
The clinical manifestations of MIS-C are heterogeneous. Although MIS-C has been described as a post-infectious phenomenon, about 60% of our patients suffered from upper respiratory symptoms, and 27% had respiratory distress despite having SARS-CoV-2 IgG antibodies, thereby implying that slow viral clearance in addition to an exaggerated inflammatory response might be responsible for the clinical manifestations. Children are also known to excrete the SARS-CoV-2 virus in stool for a long duration despite being free of respiratory symptoms.[21-23] The presence of the virus in the gastrointestinal tract might be responsible for more frequent gastrointestinal manifestations in children suffering from COVID-19, as well as MIS-C. The majority (67%) of our MIS-C patients had severe disease courses comprising a combination of coagulation, hemodynamic, and cardiovascular abnormalities. It would be advisable to monitor symptomatic pediatric COVID-19 patients aged more than 5 years for a longer time for D-dimer and fibrinogen levels. A simple parameter in the complete blood count, namely, the platelet count, can also give a clue to identify patients who might need long-term monitoring, as evidenced by the presence of thrombocytopenia in almost half of our patient cohort. Centers that have availability of flowcytometry may benefit from evaluating a few immunological parameters, namely, CD11bpositive eosinophils (%), Tim3positive Tc cell (%), and NKp46positive NK cells (%) in addition to D-dimer levels to calculate a disease metric which may help in predicting a severe course of the disease.
A study by Syrimi et al. compared KD and acute MIS-C patients reporting highly activated classical monocytes and memory CD8+ T-cells with increased frequencies of B-cell plasmablasts in patients with MIS-C, findings which were also observed in our cohort.[24] The effect of SARS-CoV-2 infection on lymphocytes primarily, especially NK cells and T lymphocytes, resulting in a significant decrease in percentage, changes in subpopulations, and elevated expression levels of activation and exhaustion markers [25] may be associated with tipping the balance toward a hyperinflammatory immune insult, thereby leading to MIS-C. Our multivariate analysis revealed the innate immune NK cells to be a more important contributor to disease severity than T-cells. Increased expression of adhesion markers, including CD11b, on PMN leucocytes has been implicated in the pathogenesis of KD mediating trans-endothelial migration, where they cause free radical generation and release of cytokines, which can cause further recruitment and activation of leucocytes to initiate tissue damage.[26] Since PIMS is a hyperinflammatory state comparable to KD capable of causing damage to coronary vasculature, the mechanism might be similar. The reduction of NKT and activated NK cells in the peripheral blood seen in our patients with dilated coronaries might indicate local infiltration of these cells mediated by cytokine secretion, thereby leading to tissue damage.[27] In addition, NK cells are known to negatively regulate T-cells to promote immune exhaustion[28] which might explain the case in our patients with dilated coronaries where the observed NK cells were negatively correlated with exhausted T-cells. It was also observed that INFg and TNFa, which are secreted by NK cells, were not significantly different from HCs, further supporting our hypothesis of local tissue infiltration by NK cells, thereby causing damage to coronary vasculature. Current treatment guidelines recommend the use of IVIG in addition to steroids for the management of MIS-C. The major mechanisms of action of IVIG include (a) blockage of intact Fcg receptors on immune cells to inhibit their activation and subsequent intracellular signaling and cell function, (b) up-regulation of inhibitory Fcg receptor IIB (CD32B) on various immune cells, including B-cells, dendritic cells, monocytes/macrophages, and basophils, which switches off the intracellular inflammatory cascades; (c) inhibiting complement-mediated tissue damage, and d) down-regulating proinflammatory cytokines (TNFa, IL-1b, IL-6, and IL-12) while up-regulating anti-inflammatory cytokines (IL-10 and transforming growth factor).[29,30] A few studies have recommended the use of IVIG in severe COVID-19[31,32] and management guidelines recommend the use of corticosteroids in pediatric patients with rapidly progressive COVID-19.[33,34] However, the non-judicious use of corticosteroids and IVIG in non-severe COVID-19 may lead to a prolonged excretion of the virus[35] in these patients.
The JAK-STAT pathway is known to be important for NK cell development, maturation, and function. Both mice and patients treated with the JAK1/JAK2 inhibitor ruxolitinib show reduced NK cell numbers, impaired maturation, and function.[36-38] Ruxolitinib has proven to be efficacious in conditions characterized by exaggerated release of inflammatory cytokines and activation of immunocompetent cells, such as hemophagocytic lymphohistiocytosis[39] and also recently in COVID-19. In recent studies on COVID-19, treatment with ruxolitinib and another JAK inhibitor, bariticinib, decreased the time on mechanical ventilation, hospitalization time, and the need for vasopressor support.[40,41] Since aberrant NK cell function and cytokine storm are implicated in the severe course of PIMS, patients may benefit from the use of ruxolitinib.
Flowcytometry panels
The T-cell panel consisted of the following antibodies (fluorochrome, clone, and catalog number) from Beckman Coulter unless otherwise mentioned: CD127 (FITC, R34.34, B25366), PD1 (PE, PD1.3, B30634), CD3 (ECD, UCHT1, A07748), CD25 (Becton Dickinson and Company, PerCP Cy5.5, M-A251, 560503), CD4 (PC7, SFCI12T4D11, 737660), TIM3(Becton Dickinson and Company, APC, 7D3, 565558), CD8 (APC750, B9.11, A94683), HLADR (PB, Immu-357, A74781), and CD45 (KO, J33, A96416).
The B-cell panel consisted of the following antibodies (fluorochrome, clone, and catalog number) from Beckman Coulter unless otherwise mentioned: IgD (FITC, IA6-2, B0652), CD27 (PE, 1A4CD27, IM2578), IgM (Becton Dickinson and Company, PerCP Cy5.5, G20-127, 561285), CD38 (Becton Dickinson and Company, PE Cy7, HB7, 335790), CD19 (APC, J3- 119, IM2470U), CD45 (APC700, J33, A71117), CD24 (APC750, ALB9, B10738), and CD21(Becton Dickinson and Company, BV510, 1048, 742760).
The NK cell panel consisted of the following antibodies (fluorochrome, clone, and catalog number) from Beckman Coulter unless otherwise mentioned: CD3 (FITC, UCHT1, A07746), CD336 (Becton Dickinson and Company, PE, p44-8, 558563), CD27 (ECD, 1A4CD27, B26603), CD335 (Becton Dickinson and Company, PerCP Cy5.5, 29A1.4, 560800), CD56 (PC7, N901, A51078), CD314 (APC, ON72, A22329), CD8 (APC750, B9.11, A94683), CD57 (PB,NC1, A74779), and CD16 (Becton Dickinson and Company, BV510, 3G8, 563830).
The monocyte panel consisted of the following antibodies (fluorochrome, clone, and catalog number) from Beckman Coulter unless otherwise mentioned: CD206 (Becton Dickinson and Company, PE, 19.2, 555954), CD64 (ECD), CD14 (PC5, RMO52, A07765), CD11b (PC7, Bear1, A54822), CD45 (APC700, J33, A71117), HLADR (PB, Immu-357, A74781), and CD16 (Becton Dickinson and Company, BV510, 3G8, 563830).
The neutrophil panel consisted of the following antibodies (fluorochrome, clone, and catalog number) from Beckman Coulter unless otherwise mentioned: CD11b (PC7, Bear1, A54822), CD15 (Becton Dickinson and Company, APC, HI98, 551376), and CD45 (APC700, J33, A71117).
CONCLUSIONS
MIS-C results from the continuing immune insult instigated by the COVID-19 infection and is caused by dysregulation resulting in hyper-activation and exhaustion of immune cells, especially the innate immune NK cells. Periodic monitoring of complete blood count and D-dimer in pediatric patients above the age of five may help in the early identification of cases of MIS-C. Immunological parameters, namely, CD11bpositive eosinophils (%), Tim3positive Tc cell (%), and NKp46positive NK cells (%), may help in predicting a severe course of the disease and identify patients who may benefit from treatment with JAK inhibitors.
Ethical approval
The study was approved by the Institutional Human Ethics committee of all the three institutions involved in the study. The ethics approval number is ICMR-NIIH/IEC/22/2020 dated 3 Oct 2020.
Declaration of patient consent
The authors certify that they have obtained all appropriate patient consent.
Conflicts of interest
There are no conflicts of interest.
Use of artificial intelligence (AI)-assisted technology for manuscript preparation
The authors confirm that there was no use of artificial intelligence (AI)-assisted technology for assisting in the writing or editing of the manuscript and no images were manipulated using AI.
Financial support and sponsorship
Nil.
References
- Why is COVID-19 less severe in children? A review of the proposed mechanisms underlying the age-related difference in severity of SARS-CoV-2 infections. Arch Dis Child 2020
- [CrossRef] [PubMed] [Google Scholar]
- Multisystem inflammatory syndrome in children and adolescents temporally related to COVID-19. Available from: https://www.who.int/news-room/commentaries/detail/multisystem-inflammatory-syndrome-in-children-and-adolescents-with-covid-19 [Last accessed on 2023 Oct 10]
- [Google Scholar]
- Multisystem inflammatory syndrome. 2020. Available from: https://www.cdc.gov/mis-c/hcp [Last accessed on 2023 Oct 10]
- [Google Scholar]
- Hyperinflammatory shock in children during COVID-19 pandemic. Lancet. 2020;395:1607-8.
- [CrossRef] [PubMed] [Google Scholar]
- Multi-system inflammatory syndrome in children and adolescents (MIS-C): A systematic review of clinical features and presentation. Paediatr Respir Rev. 2021;38:51-7.
- [CrossRef] [PubMed] [Google Scholar]
- Clinical characteristics of 58 children with a pediatric inflammatory multisystem syndrome temporally associated with SARS-CoV-2. JAMA. 2020;324:259-69.
- [CrossRef] [PubMed] [Google Scholar]
- Outcomes of multisystem inflammatory syndrome in children temporally related to COVID-19: A longitudinal study. Rheumatol Int. 2022;42:477-84.
- [CrossRef] [PubMed] [Google Scholar]
- COVID-19 related multisystem inflammatory syndrome in children (MIS-C): A hospital-based prospective cohort study from Kerala, India. BMJ Paediatr Open. 2021;5:e001195.
- [CrossRef] [PubMed] [Google Scholar]
- Incidence of multisystem inflammatory syndrome in children among US persons infected with SARSCoV-2. JAMA Netw Open. 2021;4:e2116420.
- [Google Scholar]
- Multisystem inflammatory syndrome in children related to COVID-19: A systematic review. Eur J Pediatr. 2021;180:2019-34.
- [CrossRef] [PubMed] [Google Scholar]
- Imbalanced host response to SARS-CoV-2 drives development of COVID-19. Cell. 2020;181:1036-45.e9.
- [CrossRef] [PubMed] [Google Scholar]
- Mapping systemic inflammation and antibody responses in multisystem inflammatory syndrome in children (MIS-C) Cell. 2020;183:982-95.e14.
- [CrossRef] [PubMed] [Google Scholar]
- COVID-19: Consider cytokine storm syndromes and immunosuppression. Lancet. 2020;395:1033-4.
- [CrossRef] [PubMed] [Google Scholar]
- Plasmacytoid dendritic cells depletion and elevation of IFN-g dependent chemokines CXCL9 and CXCL10 in children with multisystem inflammatory syndrome. Front Immunol. 2021;12:654587.
- [CrossRef] [PubMed] [Google Scholar]
- MIS-C and kawasaki disease: The mystery deepens. Pediatr Infect Dis J. 2020;39:E215-6.
- [CrossRef] [PubMed] [Google Scholar]
- Macrophage activation syndrome: A diagnostic challenge (review) Exp Ther Med. 2021;22:904.
- [CrossRef] [PubMed] [Google Scholar]
- COVID-19 and multisystem inflammatory syndrome in children and adolescents. Lancet Infect Dis. 2020;20:e276-88.
- [CrossRef] [PubMed] [Google Scholar]
- Cardiac pathology and outcomes vary between Kawasaki disease and MIS-C. Clin Immunol. 2021;229:108780. Erratum in: Clin Immunol 2021;231:108855
- [CrossRef] [PubMed] [Google Scholar]
- Distinguishing between typical Kawasaki disease and multisystem inflammatory syndrome in children (MIS-C) associated with SARS-CoV-2. Med Hypotheses. 2020;144:110263.
- [CrossRef] [PubMed] [Google Scholar]
- Similarities and differences between COVID-19-related multisystem inflammatory syndrome in children and Kawasaki disease. Front Pediatr. 2021;9:640118.
- [CrossRef] [PubMed] [Google Scholar]
- Epidemiological features and viral shedding in children with SARS-CoV-2 infection. J Med Virol. 2020;92:2804-12.
- [CrossRef] [PubMed] [Google Scholar]
- Prolonged fecal shedding of SARS-CoV-2 in pediatric patients: A quantitative evidence synthesis. J Pediatr Gastroenterol Nutr. 2020;71:150-2.
- [CrossRef] [PubMed] [Google Scholar]
- Prolonged fecal shedding of SARS-CoV-2 in asymptomatic children with inborn errors of immunity. J Clin Immunol. 2021;41:1748-53.
- [CrossRef] [PubMed] [Google Scholar]
- The immune landscape of SARS-CoV-2-associated multisystem inflammatory syndrome in children (MIS-C) from acute disease to recovery. iScience. 2021;24:103215.
- [CrossRef] [PubMed] [Google Scholar]
- Elevated exhaustion levels of NK and CD8+ T cells as indicators for progression and prognosis of COVID-19 disease. Front Immunol. 2020;11:1.
- [CrossRef] [PubMed] [Google Scholar]
- Increased CD11b expression on polymorphonuclear leucocytes and cytokine profiles in patients with Kawasaki disease. Clin Exp Immunol. 2007;148:112-8.
- [CrossRef] [PubMed] [Google Scholar]
- The innate immune system: Fighting on the front lines or fanning the flames of COVID-19? Cell Host Microbe. 2020;27:863-9.
- [CrossRef] [PubMed] [Google Scholar]
- The depletion of NK cells prevents T cell exhaustion to efficiently control disseminating virus infection. J Immunol. 2013;190:641-9.
- [CrossRef] [PubMed] [Google Scholar]
- Diagnosis, treatment, and long-term management of Kawasaki disease: A scientific statement for health professionals from the American Heart Association. Circulation. 2017;135:e927-99.
- [CrossRef] [PubMed] [Google Scholar]
- Adjunctive intravenous immunoglobulins (IVIg) for moderate-severe COVID-19: Emerging therapeutic roles. Curr Med Res Opin. 2021;37:903-5.
- [CrossRef] [PubMed] [Google Scholar]
- Efficacy of IVIG (intravenous immunoglobulin) for corona virus disease 2019 (COVID-19): A meta-analysis. Int Immunopharmacol. 2021;96:107732.
- [CrossRef] [PubMed] [Google Scholar]
- Hyperimmune anti-COVID-19 IVIG (C-IVIG) treatment in severe and critical COVID-19 patients: A phase I/II randomized control trial. EClinicalMedicine. 2021;36:100926.
- [CrossRef] [PubMed] [Google Scholar]
- Children - COVID-19 treatment guidelines. Available from: https://www.covid19treatmentguidelines.nih.gov/special-populations/children [Last accessed on 2021 Oct 17]
- [Google Scholar]
- Guidelines for management of COVID-19 in children (below 18 years) Ministry of Health and Family Welfare Government of India.
- [Google Scholar]
- Clinical characteristics and factors associated with long-term viral excretion in patients with severe acute respiratory syndrome coronavirus 2 infection: A single-center 28-day study. J Infect Dis. 2020;222:910-8.
- [CrossRef] [PubMed] [Google Scholar]
- Mechanisms underlying the anti-inflammatory and immunosuppressive activity of ruxolitinib. Front Oncol. 2019;9:1186.
- [CrossRef] [PubMed] [Google Scholar]
- Decreased NK-cell tumour immunosurveillance consequent to JAK inhibition enhances metastasis in breast cancer models. Nat Commun. 2016;7:12258.
- [CrossRef] [PubMed] [Google Scholar]
- JAK inhibition impairs NK cell function in myeloproliferative neoplasms. Cancer Res. 2015;75:2187-99.
- [CrossRef] [PubMed] [Google Scholar]
- Ruxolitinib and the mitigation of severe COVID-19: A systematic review and meta-analysis. Infect Chemother. 2021;53:436-48.
- [CrossRef] [PubMed] [Google Scholar]
- Compassionate use of JAK1/2 inhibitor ruxolitinib for severe COVID-19: A prospective observational study. Leukemia. 2021;35:1121-33.
- [CrossRef] [PubMed] [Google Scholar]
- Baricitinib in hospitalised patients with COVID-19: A meta-analysis of randomised controlled trials. EClinicalMedicine. 2022;49:101489.
- [CrossRef] [PubMed] [Google Scholar]


