
Translate this page into:
C-Reactive Protein-to-Albumin Ratio as a Prognostic Inflammatory Marker in COVID-19

Address for correspondence: Aliye Çelikkol, MD, PhD, Department of Clinical Biochemistry, Medical Faculty of Tekirdağ Namık Kemal University, Kampüs Cad., Süleymanpaşa, 59030, Turkey (e-mail: acelikkol@nku.edu.tr).
This article was originally published by Thieme Medical and Scientific Publishers Pvt. Ltd. and was migrated to Scientific Scholar after the change of Publisher.
Abstract
Objectives
As a result of developed generalized inflammation, the main prognostic factor determining morbidity and mortality in coronavirus disease 2019 (COVID-19) patients is acute respiratory distress syndrome. The purpose of our study was to define (1) the laboratory tests that will contribute to the diagnosis and follow-up of COVID-19 patients, (2) the differences between the laboratory-confirmed (LC), unconfirmed (LUC), and control (C) groups, and (3) the variation between groups of acute-phase reactants and biomarkers that can be used as an indicator of disease severity and inflammation.
Materials and Methods
A total of 102 patients undergoing treatment with COVID-19 interim guidelines were evaluated. Reverse transcriptase-polymerase chain reaction (RT-PCR) test was positive in 56 (LC), classified as mild or severe, and negative in 46 (LUC) patients. In addition, 30 healthy subjects (C) with negative RT-PCR tests were also evaluated.
All statistical analyses were performed with the SPSS 22.0 program and the p-values for significant findings were less than 0.05. Parametric/nonparametric distribution was determined by performing the Kolmogorov–Smirnov test for all groups. Student's t-test was used for variables with parametric distribution and the Mann–Whitney U-test for variables with the nonparametric distribution. A cut-off level for biomarkers was determined using the ROC (receiver operator characteristic) curve.
Results
In the LC group, platelet, platecrit, mean platelet volume, platelet diameter width, white blood cell, lymphocyte, eosinophil, neutrophil, immature granulocyte, immature lymphocyte, immature monocyte, large immune cell, and atypical lymphocyte counts among the complete blood count parameters of mature and immature cell counts showed a significant difference according to the C and LUC groups. C-reactive protein, neutrophil-to-lymphocyte ratio, platelet-to-lymphocyte ratio, and C-reactive protein-to-albumin ratio (CAR) indices were significantly elevated in LC patients and were significantly higher in patients classified as severe compared to mild. When CAR optimal cutoff was determined as 0.475, area under the curve was 0.934, sensitivity was 90.91%, specificity was 86.21%, positive predictive value was 92.59%, and negative predictive value was 83.33%. The diagnostic accuracy for CAR was 89.29%.
Conclusion
The CAR index with the highest diagnostic value and the highest predictability could be the most useful biomarker in the diagnosis and evaluation of disease severity in COVID-19 patients.
Keywords
SARS-CoV-2
neutrophil-tolymphocyte ratio (NLR)
platelet-tolymphocyte ratio (PLR)
systemic immune inflammation index (SII)
C-reactive protein-toalbumin ratio (CAR)
immature cell counts present in complete blood count

Introduction
The coronavirus disease 2019 (COVID-19) pandemic is still ongoing.[1,2] Direct cytopathic effects caused by the virus and the host immune responses play a role in disease severity.[3] Cytokines and chemokines also play a role in the immunopathology of virus infections. Changes in inflammatory biomarkers such as lymphopenia and increased neutrophil-to-lymphocyte ratio (NLR) in serum also indicate that the hyperinflammatory response plays a role in disease severity.[4]
It would be beneficial (1) to define laboratory tests that will contribute to the diagnosis and prognosis of COVID-19 patients and (2) to distinguish the severity of the disease, and (3) to determine the risk of mortality. For these reasons clinical evaluation needs early predictive markers.[5-8]
In this study, the hematological and biochemical laboratory profiles of patients with laboratory-confirmed (LC; reverse transcriptase-polymerase chain reaction [RT-PCR] positive) and unconfirmed (LUC; RT-PCR negative) COVID-19 patients whose disease severity was mild, severe, and critical were retrospectively analyzed alongside healthy (RT-PCR negative) age-matched patients. NLR,[9] platelet-to-lymphocyte ratio (PLR),[10] systemic immune inflammation index (SII),[11] C-reactive protein (CRP), and CRP-to-albumin ratio (CAR) as inflammatory indices[12] and changes in immature cell counts present in complete blood count (CBC) were evaluated. CAR index had the highest diagnostic value and the highest predictability and could be the most useful biomarker in the diagnosis and evaluation of disease severity in COVID-19 patients. This study contributes to the existing literature by comparing COVID-19 patients with the healthy and age-matched control (C) group and examining the diagnostic predictive values of inflammatory markers such as CAR.
Materials and Methods
Content of the Study and Participants
This retrospective cohort study was performed at Medical Faculty Research and Application Hospital between March 11, 2020, and June 01, 2020, following the MoH Diagnosis and Treatment Guidelines.[13,14] A total of 125 patients initially diagnosed with COVID-19 and 30 healthy individuals constituted the study universe. Among the 125 COVID-19 patients, 68 were positive for the RT-PCR test (LC) and 57 were negative for the RT-PCR test (LUC). The LUC group had negative PCR tests and respiratory cultures, but their computed tomography (CT) findings were compatible with COVID-19 and could not be attributed to any other cause. A total of 23 individuals in both groups were excluded because they were under 18 or pregnant or required intensive care. Nasopharyngeal samples of the remaining 56 patients with positive RT-PCR tests (LC) and 46 patients with negative (LUC) were included in the study. Additional nasopharyngeal samples from 30 age-matched healthy participants, with negative RT-PCR tests, were evaluated as the control group (►Fig. 1).
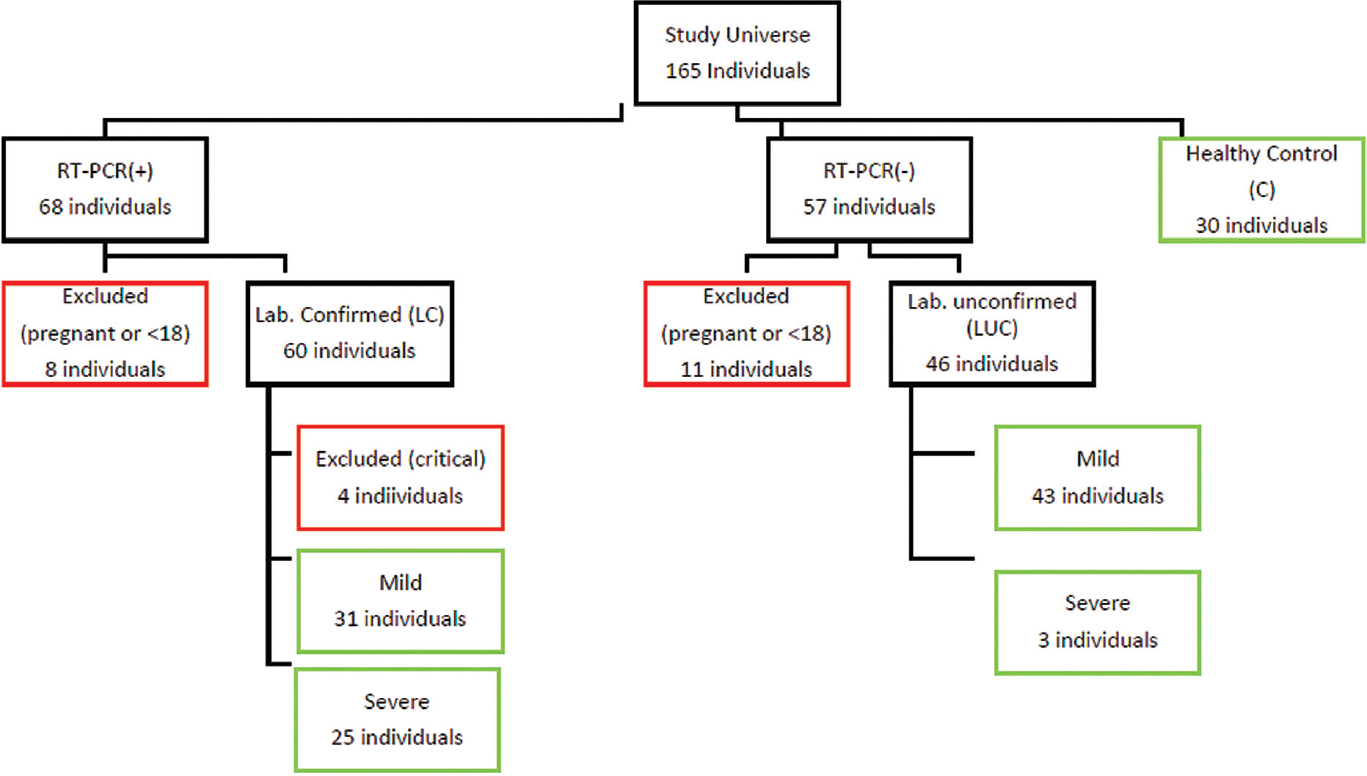
- Study participants.
Data
Demographic information, epidemiological history, clinical symptoms, comorbid diseases, imaging features, laboratory data, and length of stay were collected through an electronic medical record system. CBC data were determined using an ABX Pentra DX 120 (Horiba Medical, Montpellier, France) hematology analyzer. Biochemical tests were performed with Roche's Cobas 8000 c502 Analyzer (Roche diagnostics; Geneva, Switzerland). Coagulation tests were performed with the Sysmex CS-2500 System coagulation analyzer (Siemens Healthcare Diagnostics, Erlangen, Germany).
COVID-19 PCR Test
RNA isolation from the nasopharyngeal sample was conducted with Speedy vNAT Bio-viral extraction kit (Bioeksen, Turkey). From the obtained mixture, the real-time qPCR RdRp gene was identified with Bio-speedy COVID-19 RT-qPCR kit (Bioeksen, Turkey). The PCR process was performed by programming the thermal cycler device for 20 minutes at 450°C (once), 5 minutes at 950°C (once), at 950°C for 15 seconds + at 550°C for 40 seconds (45 times). PCR results were evaluated as positive/negative considering the cycle threshold (ct) values according to the amplification curves.
Diagnosis and Follow-Up
COVID-19 was diagnosed according to Diagnosis and Treatment Guidelines.[14] Patients with acute respiratory tract infection developed in the last 14 days who required hospitalization due to fever, cough, and dyspnea, tachypnea, hypoxemia, hypotension, had diffuse radiological findings on lung imaging, change in consciousness, and who were found to be SARS-CoV-2 positive by molecular methods were considered to have COVID-19.
In this study, we classified COVID-19 patients into three groups based on the severity of their illness (mild, severe, and critical). Patients were assigned to these groups based on their length of hospitalization, symptoms, accompanying diseases, radiological findings, and treatments. Mild patients were those patients who had mild or no signs of pneumonia. Patients with dyspnea, hypoxia, or opacities over 50% in lung imaging within 24 to 48 hours of hospitalization were categorized in the severe group, and respiratory failure, shock, or multiple organ failure in the critical group.[15] Patients who were admitted to the intensive care unit were not evaluated further. The end of the follow-up period was June 1, 2020.
Statistical Evaluation
In ►Table 1, we report the frequency and percentage values for categorical variables, and mean, standard deviation, and minimum and maximum values for continuous variables (►Table 1).
| COVID-19 patients (n: 102) | Healthy cases | ||
|---|---|---|---|
| Confirmed cases (n = 56), mean ± SD (min–max) | Unconfirmed cases (n = 46), mean ± SD (min–max) | (n = 30), mean ± SD (min–max) | |
| Age | 47.5 ± 18.8 | 46.09 + 17.66 | 44.3 + 9.48 |
| Gender | |||
| Female | 33 (58.9%) | 23 (50%) | 9 (30%) |
| Male | 23 (41.1%) | 23 (50%) | 21 (70%) |
| Hospitalized time (d) | 8.82 ± 4.3 (2–24) | 4.65 + 2.01 (2–10) | |
| CT results | |||
| No findings | 13 (23.2%) | 0 | |
| Local GGO | 24 (42.9%) | 42 (91.3%) | |
| Diffuse GGO | 19 (33.9%) | 4 (8.7%) | |
| Symptoms | |||
| Fever (>38.2°C) | 26 (46.6%) | 33 (71.7%) | |
| Cough | 32 (57.1%) | 32 (69.6%) | |
| Shortness of breath | 13 (23.2%) | 14 (30.4%) | |
| Headache | 7 (12.5%) | 7 (15.2%) | |
| Throat ache | 9 (16.1%) | 8 (17.4%) | |
| Myalgia | 8 (14.3%) | 16 (34.8%) | |
| Loss of sensation (anosmia, etc.) | 5 (8.9%) | NA | |
| Vomiting | 2 (3.6%) | 2 (4.3%) | |
| Diarrhea | 4 (7.1%) | NA | |
| Comorbidity | |||
| Hypertension | 13 (23.2%) | 8 (17.4%) | |
| Diabetes mellitus | 9 (16.1%) | 15 (32.6%) | |
| Cancer | 4 (7.1%) | 2 (4.3%) | |
| Others | 13 (23.2%) | 2 (4.3%) | |
Abbreviations: CT, computerized Tomography; GGO, ground glass opacities.
Parametric/nonparametric distribution was determined by performing the Kolmogorov–Smirnov test for all groups. Student's t-test was used for variables with parametric distribution and the Mann–Whitney U-test for variables with the nonparametric distribution. A cut-off level for biomarkers was determined using the ROC (receiver operator characteristics) curve and the median value. All statistical analyses were performed with the SPSS 22.0 program and the p-values for significant findings were less than 0.05.
Results
Laboratory data on hospitalization are shown in ►Table 2. When the LC group was evaluated, the CBC parameters PLT (platelet), MPV (mean platelet volume), PDW (platelet diameter width), PCT (platecrit), WBC (white blood cell), LY (lymphocyte count), EOS (eosinophil count), NEU (neutrophil count), IMG (immature granulocyte count), IML (immature lymphocyte count), IMM (immature monocyte count), LIC (large immune cell count), and ALY (atypical lymphocyte count) showed a significant difference when compared to C and LUC groups. Significant elevations were found in other laboratory parameters such as AST (aspartate transaminase), ALT (alanine transaminase), LDH (lactate dehydrogenase), troponin T, D-dimer, and fibrinogen. A significant reduction was detected only in sodium and albumin levels. Among the inflammation parameters, NLR, PLR, SII, CAR, and CRP were found to be significantly higher than the control group. Although NLR and PLR evaluation showed higher levels than the control group, these parameters were not significantly different between the LC and LUC groups (►Table 2).
| Parameter | (1) Confirmed cases (n: 56) | (3) Unconfirmed cases (n: 46) | (5) Healthy cases (n: 30) |
|---|---|---|---|
| PLT (106/mm3) | 203.09 ± 92,88 a: 0.02 b: 0.001 |
236.33 ± 90.97 c: 0.45 |
242.07 ± 49.6 |
| MPV (fL) | 8.93 ± 0.89 a: 0.02 b: 0.011 |
8.58 ± 0.97 c: 0.815 |
8.48 ± 0.64 |
| PDW (%) | 16.02 ± 2.96 a: 0.02 b: 0.017 |
15.04 ± 3.29 c: 0.852 |
14.51 ± 1.9 |
| PCT (%) | 0.17 ± 0.06 a: 0.61 b: 0.008 |
0.18 ± 0.07 c: 0.029 |
0.21 ± 0.05 |
| WBC (109/mm3) | 5.32 (0.19–17) a: 0.000 b: 0.003 |
8.17 (2.63–60.7) c: 0.059 |
6.92 (3.91–12.14) |
| LY # (109/mm3) | 1.41 (0.15–9.96) a: 0.06 b: 0.000 |
1.59 (0.61–4.17) c: 0.001 |
2.17 (1.27–3.27) |
| NEU # (106/mm3) | 4.08 ± 2.82 a: 0.000 b: 0.027 |
5.81 ± 3.16 c: 0.003 |
3.87 ± 0.76 |
| EOS # (106/mm3) | 0.07 ± 0.05 a: 0.04 b: 0.000 |
0.12 ± 0.11 c: 0.000 |
0.19 ± 0.1 |
| IMG # (106/mm3) | 0.03 ± 0.038 a: 0.27 b: 0.000 |
0.04 ± 0.05 c: 0.000 |
0.31 ± 0.19 |
| IMM # (106/mm3) | 0.01 (0–0.11) a: 0.04 b: 0.000 |
0.04 (0–0.11) c: 0.000 |
0.20 (0–1.5) |
| IML # (106/mm3) | 0.02 ± 0.04 a: 0.13 b: 0.000 |
0.03 ± 0.01 c: 0.000 |
0.23 ± 0.13 |
| LIC # (106/mm3) | 0.05 (0–0.39) a: 0.04 b: 0.000 |
0.11 (0–0.33) c: 0.000 |
0.60 (0.1–2.8) |
| ALY # (106/mm3) | 0.07 (0–2.58) a: 0.04 b: 0.000 |
0.12 (0.01–0.4) c: 0.000 |
1.35 (0.7–4.1) |
| CRP (mg/dL) | 12.59 (0.78–293.29) a: 0.04 b: 0.000 |
31.1 (0.18–320.21) c: 0.000 |
1 (0.25–4.17) |
| SII | 402.98 (30.6–2,436.48) a: 0.000 b: 0.800 |
621.52 (80.12–2,686.93) c: 0.000 |
425.5 (190.63–758.86) |
| CAR | 4.49 (0.17–148.21) a: 0.03 b: 0.000 |
6.65 (0.04–126.07) c: 0.000 |
0.21 (0.05–1.08) |
| PLR | 132 (12.35–1,020) a: 0.81 b: 0.004 |
133.41 (20.93–549.47) c: 0.014 |
103.28 (43.42–211.81) |
| NLR | 2.22 (0.2–9.56) a: 0.08 b: 0.000 |
3.81 (0.68–11.93) c: 0.000 |
1.29 (0.23–3) |
| ALB (g/dL) | 4.16 ± 0.63 a: 0.75 b: 0.000 |
4.25 ± 0.53 c: 0.001 |
4.65 ± 0.38 |
| TPRO (g/dL) | 7.33 ± 0.68 a: 0.08 b: 0.783 |
7.58 ± 0.78 c: 0.061 |
7.36 ± 0.48 |
| PT (sn) | 12.63 ± 1.27 a: 0.66 d: 0.240 |
13.18 ± 2.77 c: 0.27 |
12.3 ± 0.66 |
| APTT (sn) | 24.65 ± 3.63 a: 0.18 b: 0.803 |
25.64 ± 4.263 c: 0.349 |
24.6 ± 2.75 |
| FİB (mg/dL) | 328.39 ± 130.72 a: 0.65 b: 0.000 |
304.36 ± 131.11 c: 0.001 |
175.38 ± 58.81 |
| D-Dimer (mg/L) | 0.55 (0.19–28.89) a: 0.85 b: 0.000 |
0.57 (0.19–67) c: 0.000 |
0.19 (0.19–0.56) |
| Ferritin (ng/mL) | 139.3 (14–4,138) a: 0.20 b: 0.648 |
83.02 (19–794) c: 0.005 |
168 (26–287) |
| Glucose (mg/dL) | 125.61 ± 59.81 a: 0.885 b: 0.064 |
121.56 ± 28.52 c: 0.180 |
103.53 ± 11.16 |
| Creatinine (mg/dL) | 0.86 ± 0.36 a: 0.81 b: 0.714 |
0.82 ± 0.19 c: 0.992 |
0.82 ± 0.14 |
| AST (IU/L) | 24.35 (12–193) a: 0.17 b: 0.006 |
21.65 (13–95) c: 0.102 |
20(12–46) |
| ALT (IU/L) | 20.5 (4–135) a: 0.49 b: 0.066 |
20 (8–77) c: 0.097 |
15 (8–40) |
| LDH (IU/L) | 215 (138–924) a: 0.94 b: 0.000 |
216 (125–559) c: 0.000 |
171.5 (124–241) |
| Sodium (mmol/L) | 137.75 ± 3.59 a: 0.68 b: 0.000 |
137.76 ± 3.22 c: 0.000 |
140.33 ± 0.99 |
| Potassium (mmol/L) | 4.18 ± 0.56 a: 0.39 b: 0.903 |
4.08 ± 0.45 c: 0.422 |
4.13 ± 0.21 |
| CK (IU/L) | 69 (22–1,096) a: 0.19 b: 0.074 |
91 (26–2,000) c: 0.927 |
87 (54–244) |
| CK-MB (IU/L) | 19 (9–161) a: 0.68 b: 0.117 |
20.3 (10–84) c: 0.065 |
19 (11–24) |
| Trop T (ug/L) | 5 (3–75) a: 0.15 b: 0.000 |
5 (3–62) c: 0.000 |
3 (2–7) |
Note: Bold values denote p < 0.05 (p-Values between groups a: 1–3, b: 1–5, c: 3–5).
Abbreviations: NLR, neutrophil lymphocyte ratio; PLR, platelet lymphocyte ratio; CAR, C reactive protein albumin ratio; SII, systemic immune inflammation index; CRP, C reactive protein; ALY, Atypical lymphocyte count; LIC, large immune cells count; IML, Immature lymphocyte count; İMM, immature monocyte count; IMG, immature granulocyte count; EOS, eosinophil count; NEU, neutrophil count; LY, lymphocyte count; WBC, white blood cell count; PCT, platecrit; PDW, platelet diameter width; MPV, mean platelet volume; PLT, platelet count; ALB, albumin; TPRO, total protein; PT, prothrombin time; APTT, activated partial thromboplastin time; FİB, fibrinogen; AST, aspartate transaminase; ALT, alanine transaminase; LDH, lactate dehydrogenase; CK, creatinine kinase; CK-MB, creatinine kinase MB isoenzyme.
In terms of disease severity, CRP, CAR, NLR, and PLR of the LC patients were found to be significantly higher in the severe patients compared with the mild, while differences in SII were insignificant. In LC and LUC groups the higher values of CAR were predictive of disease severity (►Table 3).
| Parameter | Mild (n: 31) | Severe (n: 25) | p |
|---|---|---|---|
| PLT (106/mm3) | 218.04 ± 78.24 | 191.03 ± 78.24 | 0.283 |
| MPV (fL) | 8.9 ± 0.93 | 8.97 ± 0.85 | 0.776 |
| PDW (%) | 16.05 ± 3.24 | 15.98 ± 2.63 | 0.921 |
| PCT (%) | 0.16 (0.03–0.38) | 0.19 (0.5–0.28) | 0.729 |
| WBC (109/mm3) | 6.7 ± 3.10 | 6.06 ± 3.89 | 0.503 |
| LY # (109/mm3) | 1.47 (0.71–9.96) | 1.29 (0.15–2.09) | 0.121 |
| NEU # (106/mm3) | 3.09 (1.40–10.5) | 3.13 (0.03–14.20) | 0.979 |
| EOS # (106/mm3) | 0.07 (0.02–0.31) | 0.06 (0.02–0.29) | 0.856 |
| IMG # (106/mm3) | 0.02 (0.0–0.12) | 0.02 (0.00–0.16) | 0.923 |
| IMM # (106/mm3) | 0.02 (0–0.11) | 0.02 ± 0.02 | 0.772 |
| IML # (106/mm3) | 0.03 (0.01–0.25) | 0.01 (0.0–0.05) | 0.096 |
| LIC # (106/mm3) | 0.07 (0.02–0.39) | 0.04 (0.02–0.30) | 0.367 |
| ALY # (106/mm3) | 0.07 (0.05–2.58) | 0.06 (0.04–0.26) | 0.345 |
| ALB (g/dL) | 4.38 ± 0.441 | 3.92 ± 0.732 | 0.007 |
| CRP (mg/dL) | 8.27 (0.92–65.36) | 16.84 (0.78–293.29) | 0.003 |
| SII | 537.01 ± 392.01 | 682.76 ± 670.38 | 0.342 |
| CAR | 3.04 ± 3.46 | 30.45 ± 34.0 | 0.001 |
| PLR | 113.57 ± 55.12 | 229.88 ± 182.84 | 0.005 |
| NLR | 2.12 ± 1.34 | 4.15 ± 2.3 | 0.001 |
Note: Bold values denote p < 0.05.
Abbreviations: NLR, neutrophil to lymphocyte ratio; PLR, platelet to lymphocyte ratio; CAR, C reactive protein to albumin ratio; SII, systemic immune inflammation index; CRP, C reactive protein; ALY, atypical lymphocyte; LIC, large immune cells; IML, Immature lymphocyte; İMM, immature monocyte; IMG, immature granulocyte; EOS, eosinophil; NEU, neutrophil; LY, lymphocyte; WBC, white blood cell; PCT, Platecrit; PDW, platelet diameter width; MPV, mean platelet volume; PLT, platelet; ALB, albumin.
SII, CAR, PLR, and NLR were evaluated with the ROC curve (area under the curve [AUC]: 0.555, 0.934, 0.747, and 0.796, respectively) (►Fig. 2). The cut-off for CAR was determined as 0.475 and the AUC was 0.934. At optimal cut-off for CAR, sensitivity was 90.91%, specificity was 86.21%, positive predictive value (PPV) was 92.59%, and negative predictive value (NPV) was 83.33%. Among the evaluated inflammatory parameters, CAR showed the best diagnostic accuracy with 89.29% (►Table 4).
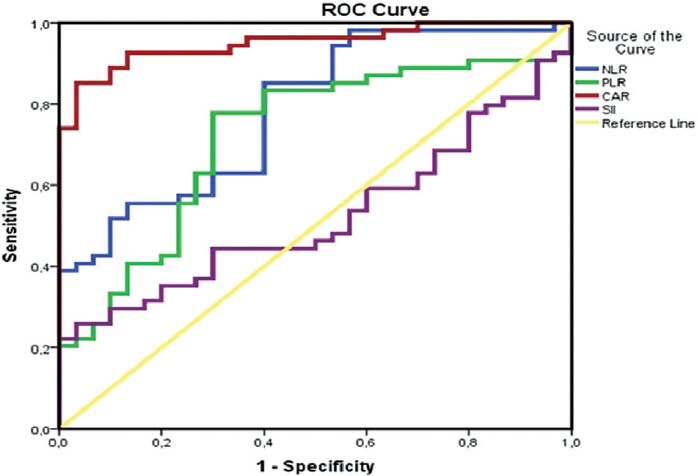
- ROC curve used to distinguish patients with severe and nonsevere COVID-19. ROC, receiver operating curve.
| Test | AUC | p | Cut-off | Sens % | Spes % | LR+ | LR- | Prev % | PPV % | NPV % | DA % |
|---|---|---|---|---|---|---|---|---|---|---|---|
| SII | 0.555 | 0.429 | 424.82 | 65 | 34.78 | 1 | 1.01 | 46.51 | 46.43 | 53.33 | 48.84 |
| CAR | 0.934 | 0.000 | 0.475 | 90.91 | 86.21 | 6.59 | 0.11 | 65.48 | 92.59 | 83.33 | 89.29 |
| PLR | 0.747 | 0.000 | 121.45 | 79.07 | 48.84 | 1.55 | 0.43 | 50 | 60.71 | 70 | 63.95 |
| NLR | 0.796 | 0.000 | 1.82 | 71.79 | 40.43 | 1.21 | 0.7 | 45.35 | 50 | 63.33 | 54.65 |
Note: Bold values denote p < 0.05.
Abbreviations: NLR, neutrophil to lymphocyte ratio; PLR, platelet to lymphocyte ratio; CAR, C reactive protein to albumin ratio; SII, systemic immune inflammation index; AUC, area under curve; Sens, sensitivity; Spes, specificity; LR, likelihood ratio; PPV, positive predictive value; NPV, negative predictive value; DA, diagnostic accuracy.
Discussion
COVID-19 caused by SARS-CoV-2 continues to spread around the world. Although the symptoms of most cases are mild and the prognosis is good, it can progress to acute respiratory distress syndrome and even death in patients.[16] Moreover, the clinical sensitivity of SARS-CoV-2 RNA tests is between 55 and 75% based on current evidence, and negative results cannot exclude COVID-19 or SARS-CoV-2 infection.[17] Therefore, it is important to identify markers that can be used to diagnose and monitor disease progression independent of the significant numbers of false positives and false negatives in PCR-based tests. We investigated several different metrics toward this end, including: (1) CBC, (2) inflammatory markers, and (3) disease severity.
Complete Blood Count and Immature Parameters
Similar to other publications, in our study absolute numbers of WBC#, LY#, and EOS# were found to be lower than the control group, and NEU# absolute counts were found to be higher. Among the platelet fraction parameters, PLT# absolute count and PCT% were low, and MPV and PDW% were found to be significantly higher in LC and LUC patients compared with the control group. Sun et al reported that CBC parameters of COVID-19 patients were significantly abnormal with hemoglobin, platelets, and lymphocyte count significantly lower than those in the control group.[18] Xu et al also reported infiltration of mononuclear cells, especially lymphocytes, in the interstitial lung in COVID-19 patients.[19,20] Li et al found that some deaths from COVID-19 had overlapping bacterial pneumonia.[21] Yang et al reported lymphopenia in 80% of adult COVID-19 patients with critical illnesses, while Chen et al reported lymphopenia in only 25% of patients with mild COVID-19 infection.[22,23] Lymphocyte counts reflect the effect of acute physiological stress and there is reason to expect that lymphopenia may be related to the severity of the SARS-CoV-2 infection.[24]
In our study, immature cell parameters IMG, IMM, IML, LIC, and ALY, in absolute numbers, and platecrit (PCT%) were also found to be lower in confirmed cases than in the control group. However, there is limited literature on this subject regarding COVID-19. It would not be correct to make a comparison since different devices such as IG%[25] and LUC%[26] have different units such as the measured parameters and percentage.[27-29] LY did not differ significantly in LUC compared with the LC group, while PLT, WBC, NEU, EO, IMM, LIC, and ALY had significantly lower values. Additionally, while LY was significantly lower in LUC cases compared with the healthy control group, NEU numbers of unconfirmed cases were higher than healthy control and confirmed groups. This indicates that the number of NEU may be a good indicator in unconfirmed patients with positive CT findings but negative PCR tests. We found no significant difference between the confirmed and unconfirmed groups in other coagulation and biochemical parameters. Therefore, inflammatory markers are very valuable in terms of diagnostic and prognostic follow-up of unconfirmed patients.
Inflammatory Markers
Higher numbers of proinflammatory cytokines in the serum of COVID-19 patients and the use of anti-inflammatory agents for treatment highlight the critical role of inflammation in the progression of the disease. Zeng et al concluded that inflammatory markers, especially CRP, PCT, interleukin (IL)-6, and ESR, had a positive correlation with the severity of COVID-19.[30] In our study, we examined CRP, NLR, PLR, SII, and CAR tests in detail as markers of inflammation. CRP, SII, CAR, PLR, and NLR were significantly higher in confirmed cases compared with the control group. CRP, SII, CAR, PLR, and NLR were higher than the control group also in unconfirmed cases. Compared with unconfirmed patients, SII, CRP, and CAR were significantly lower in confirmed patients.
The literature only points to relationships between NLR, PLR, and COVID-19.[10,31] Mazza et al have also found a direct correlation between obsessive-compulsive disorders and MLR, NLR, and SII, suggesting that higher initial inflammation may be associated with later obsessive-compulsive disorder symptoms.[32,33] Our findings of CAR are unique and an important addition to the literature in this rapidly evolving field.
Disease Severity
We also evaluated LC patients according to the severity of the disease. CRP, CAR, PLR, and NLR indices showed increasing values as disease severity increased. In our study, the fact that NLR was significantly higher in cases with severe disease supports the literature.[10,34] However, although the optimal cut-off determined for NLR is 1.82 and LR+ is 1.21, this offers a low diagnostic accuracy (54.65%) in making a differential diagnosis between severe and nonsevere patients. In the literature, different NLR cut-off values have been reported in different populations (with or without cancer) with different methods. No universal cut-off values are available yet. It would be reasonable to interpret such a parameter carefully in a clinical context, even if based on data from a comparable population.[35] Our study also revealed that CRP level was positively correlated with the severity of COVID-19, similarly to other studies.[19,23,36,37]
Low albumin levels are associated with poor prognosis and mortality for COVID-19 patients in the literature and serum albumin-mediated strategies were shown to be useful in treating COVID-19 patients.[38] One of the noninvasive markers for albumin, CAR, stands out as the most appropriate potential marker in our study. CBC parameters used in other markers are affected by any inflammation, infection, physiological stress, changes in significant serum parameters, or biological variation, such as age, gender, and race.[39]
Consisting of CRP and ALB, CAR has the potential to show inflammation and infection processes more clearly. CAR has also been recognized as an independent factor useful in predicting short-term survival within 2 weeks for COVID-19 patients.[40] The fact that CRP and ALB are less affected by changes such as biological variation compared with other blood count parameters increases the diagnostic and prognostic potential of CAR.
In our study, ALB values at hospitalization were found to be significantly lower compared with the control group. Also, there was a significant decrease in ALB levels in the group with severe disease compared with the mild group. The CAR index, in which albumin and CRP values were evaluated together, was significantly higher in LC compared with the control group, and lower in LUC compared with LC. In the examination of disease severity, CAR was found to be significantly higher in patients with severe illness compared with mild patients. Among the parameters we studied as an inflammatory marker, CAR had the highest AUC of 93% and PPV of 92.5%. It was also 6.59 times better at distinguishing between patients with severe and mild disease progression with a high positive predictability rate (LR+). Its diagnostic accuracy was 89.29%.
Inflammatory markers show activation of systemic inflammatory processes but are not specific to COVID-19. Although there are evident abnormalities in these inflammatory markers in COVID-19 patients, they are important only for diagnostic and prognostic predictability. The use of markers alone for systemic inflammation can also be misleading. Until the pathogenesis of COVID-19 is fully clarified and specific diagnosis and treatment methods are developed, the use of markers together with other data (history, symptoms, comorbidity, radiological findings, and other laboratory parameters) will be more meaningful.
Nonetheless, CAR, which has the highest diagnostic accuracy compared with other inflammatory markers, is a useful parameter in the diagnosis and estimation of disease severity for COVID-19. Of course, it would be appropriate to support our findings with data from larger samples.
Limitation of the Study
Our study is limited due to being retrospective, single-center, and small sample. Our findings cannot easily be generalized for other regions. The accuracy of data collection is limited by the accuracy of electronic records. Of course, the effect of disease stress on laboratory parameters should not be ignored. More studies with larger samples are needed to overcome these limitations. Still, we think our results shed important light on this issue.
Author Contribution
Substantial contributions to conception and design, acquisition of data, or analysis and interpretation of data: A.Ç., E.Ç.G., M.D., B.E., A.Y.
Drafting the article or revising it critically for important intellectual content: A.Ç., E.Ç.G., A.Y., B.E., M.D.
Final approval of the version to be published: A.Ç., E.Ç.G., M.D., B.E., A.Y.
Agreement to be accountable for all aspects of the work in ensuring that questions related to the accuracy or integrity of any part of the work are appropriately investigated and resolved: A.Ç., E.Ç.G., M.D., B.E., A.Y.
Guarantor: AÇ.
Ethical Approval
This study was approved by the Ministry of Health (2020–06–15T15_01_35) and the Faculty of Medicine Non-Interventional Clinical Research Ethics Committee on June 18, 2020 with the number of 2020.167.06.29.
Statement on Liability
The responsibility for the correctness of data and statements made in the manuscript rests entirely with the author.
Copyright Statement
The submitted manuscript represents original research, not previously published nor being considered for publication elsewhere.
Conflict of Interest
The authors declare that they have no known competing financial interests or personal relationships that could have appeared to influence the work reported in this article.
Funding
The study was conducted without the use of research-specific funding.
References
- Updates on laboratory investigations in coronavirus disease 2019 (COVID-19) Acta Biomed. 2020;91(03):e2020030.
- [Google Scholar]
- Coronavirus disease (COVID-19) situation reports in Malaysia [Internet] World Health Organisation 2020:1. Accessed Aug 7, 2020 at: https://www.who.int/emergencies/diseases/novel-coronavirus-2019/situation-reports/
- [Google Scholar]
- Pathogenic human coronavirus infections: causes and consequences of cytokine storm and immunopathology. Semin Immunopathol. 2017;39(05):529-539.
- [CrossRef] [PubMed] [Google Scholar]
- Dysregulation of immune response in patients with coronavirus 2019 (COVID-19) in Wuhan, China. Clin Infect Dis. 2020;71(15):762-768.
- [CrossRef] [PubMed] [Google Scholar]
- Clinical characteristics of 2019 novel coronavirus infection in Gansu province, China. Ann Palliat Med. 2020;9(04):1404-1412. DOI: 10.21037/apm-20-887. Epub: July 13, 2020
- [CrossRef] [PubMed] [Google Scholar]
- Clinical and biochemical indexes from 2019-nCoV infected patients linked to viral loads and lung injury. Sci China Life Sci. 2020;63(03):364-374.
- [CrossRef] [PubMed] [Google Scholar]
- Biomarkers associated with COVID-19 disease progression. Crit Rev Clin Lab Sci. 2020;57(06):389-399.
- [CrossRef] [PubMed] [Google Scholar]
- The hemocyte counts as a potential biomarker for predicting disease progression in COVID-19: a retrospective study. Clin Chem Lab Med. 2020;58(07):1106-1115.
- [CrossRef] [PubMed] [Google Scholar]
- Neutrophil-to-lymphocyte ratio as a predictive biomarker for moderate-severe ARDS in severe COVID-19 patients. Crit Care. 2020;24(01):288.
- [CrossRef] [PubMed] [Google Scholar]
- Platelet-to-lymphocyte ratio is associated with prognosis in patients with coronavirus disease-19. J Med Virol. 2020;92(09):1533-1541.
- [CrossRef] [PubMed] [Google Scholar]
- Dynamic changes of D-dimer and neutrophil-lymphocyte count ratio as prognostic biomarkers in COVID-19. Respir Res. 2020;21(01):169.
- [CrossRef] [PubMed] [Google Scholar]
- A retrospective propensity score matched study of the preoperative C-reactive protein to albumin ratio and prognosis in patients with resectable non-metastatic breast cancer. Med Sci Monit. 2019;25:4342-4352.
- [CrossRef] [PubMed] [Google Scholar]
- RE: ISTH interim guidance to recognition and management of coagulopathy in COVID-19. J Thromb Haemost. 2020;18(08):2057-2058. DOI: 10.1111/jth.14853. Epub: July 15, 2020
- [CrossRef] [PubMed] [Google Scholar]
- Guıdance to COVID-19 outbreak management and workıng: study of scientific advisory board. 2020 Accessed on December 14, 2020, at: https://hsgm.saglik.gov.tr/depo/covid19/Ingilizce/Salgin_Yonetimi_ve_Calisma_Rehberi/COVID19-Q13:SALGIN-YONETIMI-VE-CALISMA-REHBERI-ENG.pdf
- [Google Scholar]
- Characteristics of and important lessons from the coronavirus disease 2019 (COVID-19) outbreak in China: summary of a report of 72 314 cases from the Chinese Center for Disease Control and Prevention. JAMA. 2020;323(13):1239-1242.
- [CrossRef] [PubMed] [Google Scholar]
- Can we predict the severity of coronavirus disease 2019 with a routine blood test? Pol Arch Intern Med. 2020;130(05):400-406.
- [CrossRef] [Google Scholar]
- COVID-19 Pandemisinde SARS-CoV-2 ve Mikrobiyolojik Tanı Dinamikler. Mikrobiyol Bul. 2020;54(03):497-509.
- [CrossRef] [PubMed] [Google Scholar]
- Abnormalities of peripheral blood system in patients with COVID-19 in Wenzhou, China. Clin Chim Acta. 2020;507:174-180.
- [CrossRef] [PubMed] [Google Scholar]
- Immune-inflammatory parameters in COVID-19 cases: a systematic review and meta-analysis. Front Med (Lausanne). 2020;7:301.
- [CrossRef] [PubMed] [Google Scholar]
- Pathological findings of COVID-19 associated with acute respiratory distress syndrome. Lancet Respir Med. 2020;8(04):420-422.
- [CrossRef] [PubMed] [Google Scholar]
- Clinical characteristics of 25 death cases with COVID-19: a retrospective review of medical records in a single medical center, Wuhan, China. Int J Infect Dis. 2020;94:128-132.
- [CrossRef] [PubMed] [Google Scholar]
- Clinical course and outcomes of critically ill patients with SARS-CoV-2 pneumonia in Wuhan, China: a single-centered, retrospective, observational study. Lancet Respir Med. 2020;8(05):475-481.
- [CrossRef] [PubMed] [Google Scholar]
- Epidemiological and clinical characteristics of 99 cases of 2019 novel coronavirus pneumonia in Wuhan, China: a descriptive study. Lancet. 2020;395(10223):507-513.
- [CrossRef] [PubMed] [Google Scholar]
- Lymphopenia predicts disease severity of COVID-19: a descriptive and predictive study. Signal Transduct Target Ther. 2020;5:1-3.
- [CrossRef] [PubMed] [Google Scholar]
- The role of immature granulocytes and inflammatory hemogram indices in the inflammation. Int J Med Biochem. 2020;3(03):2.
- [CrossRef] [Google Scholar]
- Clinical and laboratory features of COVID-19: predictors of severe prognosis. Int Immunopharmacol. 2020;88:106950.
- [CrossRef] [PubMed] [Google Scholar]
- Delta neutrophil index as a prognostic marker in emergent abdominal surgery. J Clin Lab Anal. 2019;33(06):e22895.
- [CrossRef] [PubMed] [Google Scholar]
- Cord blood delta neutrophil index values of term neonates. Turk J Pediatr. 2020;62(01):35-38.
- [CrossRef] [PubMed] [Google Scholar]
- Analysis of the level of selected parameters of inflammation, circulating immune complexes, and related indicators (neutrophil/lymphocyte, platelet/lymphocyte, CRP/CIC) in patients with obstructive diseases. Cent Eur J Immunol. 2019;44(03):292-298.
- [CrossRef] [PubMed] [Google Scholar]
- Association of inflammatory markers with the severity of COVID-19: A meta-analysis. Int J Infect Dis. 2020;96:467-474.
- [CrossRef] [PubMed] [Google Scholar]
- Neutrophil-to-lymphocyte ratio as an independent risk factor for mortality in hospitalized patients with COVID-19. J Infect. 2020;81(01):e6-e12.
- [CrossRef] [PubMed] [Google Scholar]
- Admission D-dimer levels, D-dimer trends, and outcomes in COVID-19. Thromb Res. 2020;196:99-105.
- [CrossRef] [PubMed] [Google Scholar]
- Anxiety and depression in COVID-19 survivors: role of inflammatory and clinical predictors. Brain, behavior, and immunity [Internet]. 2020;89:594-600. Accessed on December 21, 2021, at: https://pubmed.ncbi.nlm.nih.gov/32738287/
- [CrossRef] [PubMed] [Google Scholar]
- Clinical characteristics and outcomes of COVID-19 patients with a history of stroke in Wuhan, China. Stroke. 2020;51(07):2219-2223. DOI: 10.1161/STROKEAHA.120.030365. Epub: May 29, 2020
- [CrossRef] [PubMed] [Google Scholar]
- What is the normal value of the neutrophil-to-lymphocyte ratio? BMC Res Notes. 2017;10(01):12.
- [CrossRef] [PubMed] [Google Scholar]
- Clinical characteristics of COVID-19 patients with abnormal liver tests. J Hepatol. 2020;73(03):712-713. DOI: 10.1016/j.jhep.2020.04.028
- [CrossRef] [PubMed] [Google Scholar]
- Hematological findings and complications of COVID-19. Am J Hematol. 2020;95(07):834-847. DOI: 10.1002/ajh.25829. Epub: May 23, 2020
- [CrossRef] [PubMed] [Google Scholar]
- The association of low serum albumin level with severe COVID-19: a systematic review and meta-analysis. Crit Care. 2020;24(01):255.
- [CrossRef] [PubMed] [Google Scholar]
- The significance of neutrophil-lymphocyte ratio, platelet-lymphocyte ratio and lymphocyte-monocyte ratio in predicting peripheral arterial disease, peripheral neuropathy, osteomyelitis and amputation in diabetic foot infection. Diabetes Res Clin Pract. 2018;144:118-125.
- [CrossRef] [PubMed] [Google Scholar]
- High-sensitivity C-reactive protein/albumin ratio as a predictor of in-hospital mortality in older adults admitted to the emergency department. Clin Exp Emerg Med. 2017;4(01):19-24.
- [CrossRef] [PubMed] [Google Scholar]


