
Translate this page into:
Endothelial dysfunction and inflammatory biomarkers as a response factor of concurrent coenzyme Q10 add-on metformin in patients with type 2 diabetes mellitus
Address for correspondence: Prof. Hayder M. Al-Kuraishy, Department of Pharmacology, Toxicology and Medicine, College of Medicine, Al-mustansiriya University, PO Box: 14132, Baghdad, Iraq. E-mail: hayderm36@yahoo.com
-
Received: ,
Accepted: ,
This is an open access journal, and articles are distributed under the terms of the Creative Commons Attribution-NonCommercial-ShareAlike 4.0 License, which allows others to remix, tweak, and build upon the work non-commercially, as long as appropriate credit is given and the new creations are licensed under the identical terms.
This article was originally published by Wolters Kluwer - Medknow and was migrated to Scientific Scholar after the change of Publisher.
Abstract
OBJECTIVES:
The objective of the study was to evaluate the effect of metformin alone or in combination with coenzyme Q10 (CoQ10) on inflammatory changes and endothelial dysfunction in patients with type 2 diabetes mellitus (T2DM).
MATERIALS AND METHODS:
A total numbers of 54 patients with T2DM compared to 30 healthy subjects were divided into three groups: Group A (n = 30): healthy subjects without any medications; Group B (n = 24): T2DM patients treated with metformin 1 g/day; and Group C (n = 30): T2DM patients treated with metformin 1 g/day plus CoQ10, 300 mg/day. The duration of the study was 8 weeks. Fasting blood glucose, glycated hemoglobin, lipid profile, blood pressure variables, fasting insulin, insulin resistance, homeostatic model assessment of insulin resistance, vascular cell adhesion molecule 1 (VCAM-1), and E-selectin were measured before and after therapy.
RESULTS:
Metformin and/or CoQ10 therapy illustrated an insignificant effect on the fody mass index. This combination produced a significant improvement of metabolic changes in patients with T2DM (P < 0.01). sVCAM-1 serum level was decreased significantly after the initiation of metformin and/or CoQ10 therapy compared to the baseline P < 0.05. E-selectin was declined significantly following metformin monotherapy and after metformin plus CoQ10 therapy (P = 0.0001).
CONCLUSION:
CoQ10 add-on metformin therapy improves endothelial dysfunction and inflammatory changes in patients with T2DM alongside with amelioration of metabolic profile.
Keywords
Coenzyme Q10
endothelial dysfunction
inflammatory changes
metformin
type 2 diabetes mellitus

Introduction
Type 2 diabetes mellitus (T2DM) is a metabolic disorder due to impaired insulin action, which leads to hyperglycemia and metabolic complications. T2DM is associated with oxidative stress due to the imbalance between body free-radical production and antioxidant capacity.[1] Oxidative stress is an imbalance between free-radical productions and antioxidant defenses mechanisms which involved in the pathogenesis of endothelial dysfunction and peripheral insulin resistance.[2]
Endothelial dysfunction is a condition of decreased endothelium-dependent vasodilation, in which there are pro-inflammatory and proliferative changes with the induction of atherogenesis. It has been reported that the metabolic disorders of T2DM lead to the induction of mitochondrial superoxide in endothelial cells which lead to endothelial dysfunction.[3]
Metformin is an insulin sensitizer agent which is the first-line therapy in patients with T2DM. It acts through the inhibition of hepatic gluconeogenesis, increase of insulin sensitivity, and suppression of intestinal glucose absorption.[4]
Coenzyme Q10 (CoQ10) is a lipophilic molecule with a potent antioxidant effect, protects against oxidative stress. CoQ10 is a key component of the mitochondrial oxidative phosphorylation process involved in the carbohydrate and fatty acid metabolisms. The clinical uses of CoQ10 are fibromyalgia, T2DM, mitochondrial dysfunction, neurodegenerative diseases, male infertility, and periodontal disease.[5]
In T2DM, CoQ10 levels are reduced due to the oxidative stress and inflammatory changes; thus, CoQ10 supplementation may improves endothelial function.[6]
Therefore, objective of the present study was to evaluate the effect of metformin and/or CoQ10 on endothelial dysfunction in patients with T2DM.
Materials and Methods
This clinical prospective study was completed and permitted by an explicit controlled Ethical Committee under Principled Clearance Number RTD13MF 4/8/2018 in reverence to the Declaration of Helsinki.[7] All patients and enrolled subjects gave informed verbal consent for their participation in this study. Inclusion criteria included newly diagnosed patients with T2DM with an age range of 47–65 years on metformin therapy. Exclusion criteria included psychological diseases, neurological diseases, hypothyroidism, end-stage kidney disease, hepatic dysfunction, connective tissue disorders, history of intake of dopamine receptor agonist and antagonist agents, malignant disorders, and sexual dysfunction.
Study design
The present study was a prospective, randomized, and open-label study. A total number of 54 (26 female + 28 males) patients with T2DM were recruited from the diabetic center compared with matched 30 healthy subjects; they divided into three groups:
-
Group A (n = 30): healthy subjects without any medications
-
Group B (n = 24): T2DM patients treated with metformin 1 g/day
-
Group C (n = 30): T2DM patients treated with metformin 1 g/day plus CoQ10, 300 mg/day
The duration of the study was 8 weeks. All drugs were purchased from a private pharmaceutical company: metformin (metformin HCL 500 mg Actavis, India) and CoQ10 capsule (Ubiquinol CoQ10 300 mg, Natrol, USA).
Anthropometric measurements
The body mass index (BMI) was estimated by specific equation BMI = weight (kg)/height (cm2). Blood pressure measurements were determined by the digital sphygmomanometer at the supine position. Pulse pressure = systolic blood pressure (SBP)−diastolic blood pressure [DBP], mean arterial pressure (MAP),
Biochemical assay
After an overnight fast, 5 mL of venous blood was obtained from the recruited patients and enrolled healthy subjects; the blood samples were centrifuged at 3000/rpm and stored at − 20°C for later analysis. Fasting blood glucose (FBG) was measured by the glucose oxidase method.[9] Lipid profile was estimated by specific enzyme-linked immunosorbent assay (ELISA) according to the kit instructions, whereas high-density lipoprotein (HDL), low-density lipoprotein (LDL), and atherogenic index were determined by the modified Friedewald formula (AIP = log [triglyceride/HDL]).[10]
Fasting insulin was measured by the ELISA method (insulin human ELISA kit, Catalog number: KAQ1251). Insulin resistance and β-cell function of the pancreas were determined by homeostatic model assessment (HOMA-2) that measures HOMA-IR (insulin resistance) and HOMA-S% (insulin sensitivity). Glycated hemoglobin (HbA1c) was measured by a specific kit (human glycated hemoglobin AIi1c, GHbA1c, and MBS702379). Endothelial biomarkers were serum human vascular cell adhesion molecule 1 (VCAM-1)(Catalog BMS232, Kono biotech, China) and serum human E-selectin (Lot number 130676075, Kono biotech, China). All kit procedures were done according to the kit instructions.
Statistical analysis
The data were presented as mean ± standard deviation and unpaired or paired Student's t-test was used to determine the differences. Analysis of variance followed by Bonferroni post hoc test was used to compare the results of the study variables among different groups. Data analysis was done using SPSS (IBM SPSS Statistics for Windows version 20.0, 2014 Armonk, NY, IBM, Corp, USA). The level of significance was regarded when P < 0.05.
Results
Baseline data
The present study illustrated that a total number of 84 subjects were recruited with 54 (64.28) T2DM and 30 (35.71) healthy subjects as controls. The duration of T2DM was 2–4 months. About 44.44% followed metformin therapy, while 55.55% followed metformin plus CoQ10 therapy. Other characteristics are presented in Table 1.
| The characteristics | Mean±SD, n (%) |
|---|---|
| n | 84 |
| T2DM | 54 (64.28) |
| Healthy subjects (control) | 30 (35.71) |
| Age (years) | |
| T2DM | 56.23±5.99 |
| Control | 55.69±5.87 |
| Race, white: black ratio | 90:4 |
| Duration of T2DM (months) | 2-4 |
| Current pharmacotherapy | |
| M | 24 (44.44) |
| M+Co | 30 (55.55) |
| Antihypertensive drugs | |
| Amlodipine | 33 (61.11) |
| B-blockers | 5 (9.25) |
| Statins | 21 (38.88) |
| Fenofibrate | 41 (75.92) |
| Aspiri | 45 (83.33) |
| Duration of the study (weeks) | 8 |
Data are presented as mean±SD, n (%). SD=Standard deviation, T2DM=Type 2 diabetes mellitus, CoQ10=Coenzyme Q10, M=Metformin, M+Co=Metformin plus CoQ10
In patients with T2DM, there were significant metabolic changes compared with healthy controls. BMI, blood pressure, and glucolipid changes were high in patients with T2DM compared with controls (P < 0.01). As well, insulin sensitivity was low, while insulin resistance and fasting insulin were high in patients with T2DM compared with controls (P < 0.01) [Table 2].
| Variables | Control (n=30) | T2DM (n=54) | P |
|---|---|---|---|
| BMI (kg/m2) | 27.62±4.32 | 31.56±6.12 | 0.002* |
| SBP (mmHg) | 119.45±7.23 | 134.34±7.94 | 0.0001* |
| DBP (mmHg) | 71.53±6.34 | 80.74±8.98 | 0.0001* |
| PP (mmHg) | 47.92±6.88 | 53.60±7.63 | 0.001* |
| MAP (mmHg) | 87.5±4.49 | 98.6±8.52 | 0.0001* |
| FBG (mg/dL) | 86.43±6.94 | 169.88±11.68 | 0.0001* |
| HbA1c (%) | 5.1±1.44 | 8.85±4.78 | 0.0001* |
| FSI (μIU/mL) | 6.11±1.76 | 23.11±5.67 | 0.0001* |
| HOMA-IR | 0.79±0.02 | 3.86±1.02 | 0.0001* |
| IS (%) | 127.6±11.82 | 29.8±5.11 | 0.0001* |
| TC (mg/dL) | 185.98±10.84 | 231.97±16.73 | 0.0001* |
| TG (mg/dL) | 108.22±7.69 | 342.81±19.33 | 0.0001* |
| HDL (mg/dL) | 53.49±5.91 | 31.73±6.33 | 0.0001* |
| LDL (mg/dL) | 110.8±5.93 | 131.7±9.41 | 0.0001* |
| VLDL (mg/dL) | 20.044±4.28 | 68.56±7.91 | 0.0001* |
| AI | 0.05±0.001 | 0.674±0.12 | 0.0001* |
Data are presented as mean±SD, unpaired t-test,*P<0.01. SD=Standard deviation, T2DM=Type 2 diabetes mellitus, BMI=Body mass index, SBP=Systolic blood pressure, DBP=Diastolic blood pressure, PP=Pulse pressure, MAP=Mean arterial pressure, FBG=Fasting blood glucose, HbA1c=Glycated hemoglobin, FSI=Fasting serum insulin, HOMA-IR=Homeostatic model assessment-insulin resistance, IS=Insulin sensitivity, TC=Total cholesterol, TG=Triglyceride, HDL=High-density lipoprotein, LDL=Low-density lipoprotein, VLDL=Very LDL, AI=Atherogenic index
Effects of metformin and/or coenzyme Q10 on glucose-metabolic variables in patients with type 2 diabetes mellitus
Regarding the effect of diabetic pharmacotherapy, metformin therapy illustrated an insignificant effect on BMI and blood pressure variables compared with baseline data (P > 0.05). Indeed, metformin reduced FBG, FSI, HbA1c, and HOMA-IR (P < 0.05) for HbA1c and P < 0.01 for others compared with baseline data. Furthermore, metformin ameliorated lipid profile (P < 0.01) with the exception of LDL which was not affected significantly (P > 0.05).
CoQ10 add-on metformin therapy in patients with T2DM showed an insignificant effect in the reduction of BMI compared with baseline data (P > 0.05), but this combination illustrated a more significant reduction in blood pressure changes compared with baseline (P < 0.01). Furthermore, CoQ10 plus metformin combination led to a significant amelioration of glucose indices through the reduction of FBG, FSI, HbA1c, and HOMA-IR (P < 0.01) with a significant increment in the insulin sensitivity compared with the baseline (P < 0.01). As well, this combination led to the improvement of lipid profile compared with the baseline (P < 0.01). The effect of CoQ10 and metformin combination was more effective than metformin alone mainly on SBP, MAP, and lipid profile as these variables were significantly differed (P < 0.05) [Table 3].
| Variables | Baseline (n=54) | T2DM (M) (n=24) | T2DM (M+Co) (n=30) | A | B | C | ANOVA |
|---|---|---|---|---|---|---|---|
| BMI (kg/m2) | 31.56±6.12 | 30.09±6.19 | 30.00±4.12 | NS | NS | NS | NS |
| SBP (mmHg) | 134.34±7.94 | 130.09±6.94 | 124.34±6.33 | NS | 0.0001* | 0.01# | 0.0001* |
| DBP (mmHg) | 80.74±8.98 | 77.74±8.11 | 72.39±7.11 | NS | 0.0001* | NS | 0.0001* |
| PP (mmHg) | 53.6±7.63 | 52.35±6.87 | 51.95±6.12 | NS | NS | NS | NS |
| MAP (mmHg) | 98.6±8.52 | 95.19±7.98 | 89.7±5.11 | NS | 0.0001* | 0.02# | 0.0001* |
| FBG (mg/dL) | 169.88±11.68 | 119.33±8.67 | 120.91±7.69 | 0.0001* | 0.0001* | NS | 0.0001* |
| HbA1c (%) | 8.85±4.78 | 6.15±3.44 | 6.01±3.12 | 0.02# | 0.008* | NS | 0.002* |
| FSI (μIU/mL) | 23.11±5.67 | 6.17±1.62 | 6.05±1.23 | 0.0001* | 0.0001* | NS | 0.0001* |
| HOMA-IR | 3.86±1.02 | 0.86±0.11 | 0.84±0.10 | 0.0001* | 0.0001* | NS | 0.0001* |
| IS (%) | 29.8±5.11 | 116.4±8.93 | 118.4±8.11 | 0.0001* | 0.0001* | NS | 0.0001* |
| TC (mg/dL) | 231.97±16.73 | 211.08±11.56 | 191.88±10.22 | 0.0001* | 0.0001* | 0.0001* | 0.0001* |
| TG (mg/dL) | 342.81±19.33 | 200.91±10.33 | 180.09±13.56 | 0.0001* | 0.0001* | 0.0001* | 0.0001* |
| HDL (mg/dL) | 31.73±6.33 | 41.08±4.18 | 49.77±4.89 | 0.0001* | 0.0001* | 0.01# | 0.0001* |
| LDL (mg/dL) | 131.7±9.41 | 129.8±7.99 | 106.1±7.87 | NS | 0.0001* | 0.0001* | 0.0001* |
| VLDL (mg/dL) | 68.56±7.91 | 40.18±4.88 | 36.01±3.89 | 0.0001* | 0.0001* | 0.04# | 0.0001* |
| AI | 0.674±0.12 | 0.32±0.08 | 0.19±0.09 | 0.0001* | 0.0001* | 0.0001* | 0.0001* |
Data are presented as mean±SD, one-way ANOVA and post hoc test. *P<0.01, #P<0.05. ANOVA=Analysis of variance, SD=Standard deviation, CoQ10=Coenzyme Q10, T2DM=Type 2 diabetes mellitus, T2DM (M)=T2DM on metformin, T2DM (M+Co)=T2DM on metformin plus CoQ10, A=Baseline versus T2DM on metformin, B=Baseline versus T2DM on metformin plus CoQ10, C=T2DM on metformin versus T2DM on metformin plus CoQ10, BMI=Body mass index, SBP=Systolic blood pressure, DBP=Diastolic blood pressure, PP=Pulse pressure, MAP=Mean arterial pressure, FBG=Fasting blood glucose, HbA1c=Glycated hemoglobin, FSI=Fasting serum insulin, HOMA-IR=Homeostatic model assessment-insulin resistance, IS=Insulin sensitivity, TC=Total cholesterol, TG=Triglyceride, HDL=High-density lipoprotein, LDL=Low-density lipoprotein, VLDL=Very LDL, AI=Atherogenic index, NS=Not significant
Effects of metformin and/or coenzyme Q10 on the biomarkers of endothelial dysfunction in patients with type 2 diabetes mellitus
Regarding changes in the biomarkers of endothelial dysfunction, sVCAM-1 and E-selectin were high in patients with T2DM at the baseline before starting diabetic therapy (4.74 ± 2.34 ng/ml) for sVCAM-1 and (9.55 ± 3.56 ng/L) for E-selectin. sVCAM-1 serum level was decreased significantly after the initiation of metformin therapy within 3 months to reach to 3.32 ± 1.99 ng/ml (Diff = −1.4200, 95% confidence interval [CI] = −2.5713–0.2687, P = 0.01) compared with the baseline. Metformin plus CoQ10 therapy revealed a significant effect on sVCAM-1 serum level compared with the baseline to reach to 1.98 ± 0.98 ng/ml (Diff = −2.7600, 95% CI = −3.8286–1.6914, P = 0.0000). Besides, E-selectin was declined significantly (P = 0.04) (Diff = −1.8400, 95% CI = −3.6771–0.0029) following metformin monotherapy and after metformin plus CoQ10 therapy, P = 0.0001 (Diff = −4.6400, 95% CI= −6.3452–2.9348) to reach to 7.71 ± 2.60 ng/L and 4.91 ± 2.72 ng/L, respectively. The difference between metformin monotherapy and metformin plus CoQ10 therapy was P = 0.03 for sVCAM-1 and P = 0.004 for E-selectin, Figure 1.
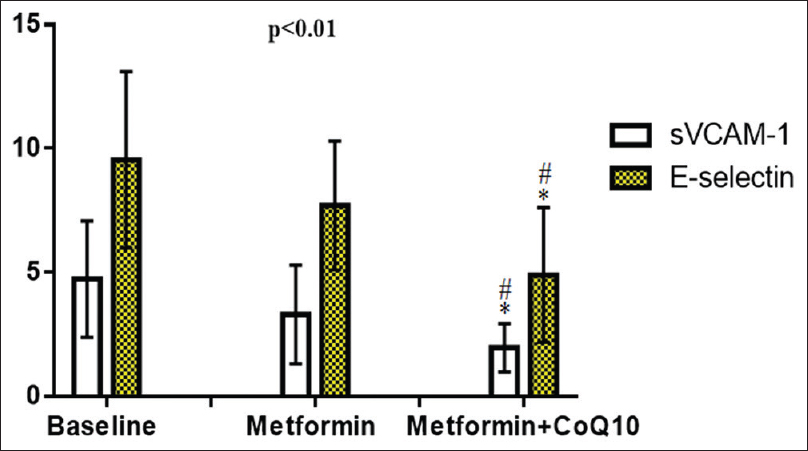
- Effects of metformin and/or coenzyme Q10 on the biomarkers of endothelial dysfunction in patients with type 2 diabetes mellitus * P< 0.01 versus baseline;#P< 0.05 versus metformin
Discussion
The present study illustrated that metformin was not able to reduced BMI since metformin has a neutral effect on the body weight which is in concord with the results of the previous study.[11] However, Apovian et al.'s study revealed that metformin causes a modest weight reduction in overweight patients with T2DM.[12]
Besides, metformin plus CoQ10 combination produced an insignificant effect in the reduction of BMI. This finding was in agreement with Maheshwari et al.'s study which illustrated an insignificant effect of CoQ10 on the body weight.[13]
In our study, metformin therapy demonstrated an insignificant effect on the reduction of blood pressure variables which coincided with a previous study that showed an insignificant effect of metformin on systolic and DBPs after 3 months of the treatment.[14]
As well, the present study points up that metformin plus CoQ10 combination caused significant lowering of SBP compared to the baseline and metformin monotherapy, as revealed by Ho et al.'s study that showed a significant effect of CoQ10 in the reduction of systolic and DBPs through the improvement of endothelial oxidative stress and mitochondrial function.[15]
Regarding the effect of metformin and/or CoQ10 on glycemic and insulin indices after 8 weeks of treatment, metformin monotherapy and metformin plus CoQ10 combination established a significant reduction of FBG, HbA1c, fasting insulin, and HOMA-IR with a significant improvement of insulin sensitivity which is in harmony with a recent study.[16]
In the present study, metformin monotherapy led to a significant improvement of lipid profile without a significant effect on LDL serum level, as demonstrated by Alsharidah et al.'s study.[17]
It has been revealed that metformin improves lipid profile through inhibition of lipolysis, inhibition of LDL glycation, and suppression of intestinal absorption of cholesterol and triglyceride.[18]
The insignificant effect of metformin in the reduction of LDL in the present study might due to the short duration of the study since Orchard et al.'s study revealed that metformin effect on LDL needs duration more than 6 months.[19]
Moreover, metformin plus CoQ10 combination in the present study showed a more significant effect on lipid profile compared to metformin monotherapy since this combination led to a significant amelioration of lipid profile. CoQ10 improves the lipid profile through the inhibition of LDL, protein, DNA, membrane lipid oxidations, and attenuation of oxidative stress through augmentation of cellular ubiquinol-10.[20]
What's more, the present study disclosed that metformin alone or combination with CoQ10 produced a significant effect in attenuation of endothelial dysfunction in patients with T2DM through the reduction of E-selectin and sVCAM-1 as presented by earlier study.[21]
Alongside, the previous study indicated that there is nonsignificant change in these parameters following short-term management with low dose of metformin. While the significant reduction in serum E-selectin and sVCAM-1 may occur following large doses of metformin.[22]
The endothelial protective effect of metformin is attributed to the inhibition of mitochondrial complex 1 and activation of the AMPK pathway. Dai et al.'s study revealed that CoQ10 therapy improves endothelial dysfunction in patients with T2DM due to the potent antioxidant effect, free-radical scavenging effect, and inhibition of endothelial oxidative stress which is linked to the amelioration of endothelial nitric oxide synthase and mitochondrial oxidative phosphorylation.[23]
Recently, CoQ10 supplementation plays a potential role in amelioration of endothelial dysfunction in patients withT2DM through the augmentation of total antioxidant capacity and NO levels with a significant reduction of high-sensitive C-reactive protein.[24]
The limitations of the present study were relatively small sample size which may limit the significance of findings, all of the enrolled patients were from single-center, only newly diagnosed patients with T2DM were included in this study, T2DM patients with chronic kidney disease or complications were not evaluated in the present study, plasma level of CoQ10 was not estimated in relation to metformin plasma levels, and finally, gender differences were not evaluated in this study. In spite of these limitations, this study is considered as a preliminary step for large-scale studies to observe the beneficial effects of CoQ10 in the management of T2DM.
Conclusion
CoQ10 add-on metformin therapy improves endothelial dysfunction and inflammatory changes in patients with T2DM alongside with amelioration of metabolic profile.
Financial support and sponsorship
Nil.
Conflicts of interest
There are no conflicts of interest.
Acknowledgments
We would like to acknowledge Dr. Salah Al-windy for his great supports.
References
- Differential effect of metformin and/or glyburide on apelin serum levels in patients with type 2 diabetes mellitus: Concepts and clinical practice. J Adv Pharm Technol Res. 2018;9:80-6.
- [Google Scholar]
- Concept and connotation of oxidative stress in preeclampsia. J Lab Physicians. 2018;10:276-82.
- [Google Scholar]
- Erectile dysfunction and low sex drive in men with type 2 DM: The potential role of diabetic pharmacotherapy. J Clin Diagn Res. 2016;10:FC21-6.
- [Google Scholar]
- New insights into the role of metformin effects on serum omentin-1 Levels in acute myocardial infarction: Cross-sectional study. Emerg Med Int. 2015;2015:283021.
- [Google Scholar]
- CoQ10 a super-Vitamin: Review on application and biosynthesis. 3 Biotech. 2018;8:249.
- [Google Scholar]
- Supplementation of coenzyme Q10 among patients with Type 2 diabetes mellitus. Healthcare (Basel). 2015;3:296-309.
- [Google Scholar]
- The revised declaration of Helsinki: Cosmetic or real change? J R Soc Med. 2016;109:184-9.
- [Google Scholar]
- Lipoprotein-Associated phospholipase A2 is linked with poor cardio-metabolic profile in patients with ischemic stroke: A study of effects of statins. J Neurosci Rural Pract. 2018;9:496-503.
- [Google Scholar]
- Effects of rosuvastatin alone or in combination with omega-3 fatty acid on adiponectin levels and cardiometabolic Profile. J Basic Clin Pharm. 2016;8:8-14.
- [Google Scholar]
- The Indian diabetes prevention programme shows that lifestyle modification and metformin prevent type 2 diabetes in Asian Indian subjects with impaired glucose tolerance (IDPP-1) Diabetologia. 2006;49:289-97.
- [Google Scholar]
- Metformin induces significant reduction of body weight, total cholesterol and LDL levels in the elderly – A meta-analysis. PLoS One. 2018;13:e0207947.
- [Google Scholar]
- Body weight considerations in the management of type 2 diabetes. Adv Ther. 2019;36:44-58.
- [Google Scholar]
- Effect of coenzyme Q10 alone and its combination with metformin on streptozotocin-nicotinamide-induced diabetic nephropathy in rats. Indian J Pharmacol. 2014;46:627-32.
- [Google Scholar]
- Effect of metformin on blood pressure in patients with hypertension: A randomized clinical trial. Endocrine. 2019;63:252-8.
- [Google Scholar]
- Blood pressure lowering efficacy of coenzyme Q10 for primary hypertension. Cochrane database of systematic reviews 2016:70-9.
- [Google Scholar]
- The effects of addition of coenzyme Q10 to metformin on sirolimus-induced diabetes mellitus. The Korean journal of internal medicine. 2019;34:365-78.
- [Google Scholar]
- Effect of combined gliclazide/metformin treatment on oxidative stress, lipid profile, and hepatorenal functions in type 2 diabetic patients. Saudi Pharm J. 2018;26:1-6.
- [Google Scholar]
- Effect of metformin monotherapy on serum lipid profile in statin-naïve individuals with newly diagnosed type 2 diabetes mellitus: A cohort study. PeerJ. 2018;6:e4578.
- [Google Scholar]
- The effect of metformin and intensive lifestyle intervention on the metabolic syndrome: The diabetes prevention program randomized trial. Ann Intern Med. 2005;142:611-9.
- [Google Scholar]
- Treatment of coenzyme Q10 for 24 weeks improves lipid and glycemic profile in dyslipidemic individuals. J Clin Lipidol. 2018;12:417-27.
- [Google Scholar]
- Effectiveness of coenzyme Q10 supplementation for type 2 diabetes mellitus: A systematic review and meta-analysis. Int J Endocrinol. 2018;2018:6484839.
- [Google Scholar]
- Effect of pioglitazone and acarbose on endothelial inflammation biomarkers during oral glucose tolerance test in diabetic patients treated with sulphonylureas and metformin. J Clin Pharm Ther. 2010;35:565-79.
- [Google Scholar]
- Reversal of mitochondrial dysfunction by coenzyme Q10 supplement improves endothelial function in patients with Ischaemic left ventricular systolic dysfunction: A randomized controlled trial. Atherosclerosis. 2011;216:395-401.
- [Google Scholar]
- Clinical trial of the effects of coenzyme q10 supplementation on biomarkers of inflammation and oxidative stress in diabetic hemodialysis patients. Int J Prev Med. 2019;10:12.
- [Google Scholar]


