
Translate this page into:
Significance of platelet indices as severity marker in nonthrombocytopenic preeclampsia cases
Address for correspondence: Dr. Shilpa Gopal Reddy, #28, “Chandavi”, 12th Main, BTM Layout, Bengaluru - 560 029, Karnataka, India. E-mail: gshilp@gmail.com
-
Received: ,
Accepted: ,
This is an open access journal, and articles are distributed under the terms of the Creative Commons Attribution-NonCommercial-ShareAlike 4.0 License, which allows others to remix, tweak, and build upon the work non-commercially, as long as appropriate credit is given and the new creations are licensed under the identical terms.
This article was originally published by Wolters Kluwer - Medknow and was migrated to Scientific Scholar after the change of Publisher.
Abstract
CONTEXT:
Preeclampsia is often asymptomatic, and hence, its detection depends on signs or investigations. The platelet (PLT) parameters, in cases of preeclampsia with normal PLT count, are seldom analyzed. Hence, this study was undertaken to study the PLT parameters in nonthrombocytopenic preeclampsia cases.
AIM:
The aim was to evaluate the use of PLT indices as severity markers in nonthrombocytopenic preeclampsia cases.
SUBJECTS AND METHODS:
This prospective study was done on 120 cases of severe preeclampsia, 115 cases of preeclampsia without severe features, and 203 normal pregnant women admitted in the obstetrics wards during the study period of 1 year. The PLT indices obtained by analyzing anticoagulated blood were recorded.
STATISTICAL ANALYSIS USED:
Analysis of variance test was used to see the significance of association. Receiver operating characteristic (ROC) curve and binary regression analysis was used to estimate the cutoff value and examine the predictive value of the PLT parameters in the disease progression of preeclampsia.
RESULTS:
Even in the absence of thrombocytopenia, mean platelet volume (MPV) and PLT distribution width were significantly higher in severe preeclampsia group (P < 0.001) and were also positively correlating with mean arterial pressure (r = 0.38 and 0.20, respectively). ROC curve analysis showed that MPV had the highest area under the curve of 0.78 (95% confidence interval [0.719–0.842]). Cutoff value of >10.95 fl for MPV was found to have significant predictive value for disease progression in preeclampsia.
CONCLUSIONS:
Even in the absence of thrombocytopenia, PLT indices, especially MPV, have a good diagnostic significance in detecting severe preeclampsia. Further studies are required to evaluate their role as biomarkers in preeclampsia.
Keywords
Mean arterial pressure
platelet indices
preeclampsia
thrombocytopenia

Introduction
Preeclampsia is a syndrome characterized by new onset of hypertension which usually develops after 20 weeks of gestation affecting both mother and fetus.[1] It complicates 10% of all pregnancies in developing countries, and due to the varied clinical presentation, proper diagnosis is still an issue, especially in community health centers. There is a need for an affordable test that could offer a presymptomatic diagnosis to identify preeclampsia.
Although the pathogenesis of preeclampsia is poorly understood, there are studies which have shown that PLTs play a pivotal role.[2] PLT count has been shown to be a rapid procedure to estimate the severity of pregnancy-induced hypertension.[3] HELLP syndrome, associated with grave maternal and fetal outcome, is also characterized by low PLT count along with hemolysis and elevated liver enzymes.[4] Raised mean platelet volume (MPV) and platelet distribution width (PDW) have been shown to be correlated with severity of the disease, whenever there is decreased PLT count.[5] Although studies have demonstrated that the pathophysiological changes in preeclampsia including the change in PLT size precede by the fall in PLT count, the PLT parameters in preeclampsia with normal PLT count have not been thoroughly studied.[678] Hence, this study was undertaken to see if there are associations between PLT indices and severity of preeclampsia in nonthrombocytopenic cases and to evaluate if any of the parameters can be used as a severity marker of the disease.
Subjects and Methods
This study was conducted at the Department of Pathology in collaboration with the department of Obstetrics and Gynecology. Women with singleton pregnancy, clinically diagnosed with preeclampsia in the third trimester of gestation, visiting the outpatient Department of Obstetrics and Gynecology or admitted in the hospital during the study period of 1 year, were included. The study group comprised 235 preeclampsia cases with PLT count >1.5 lakh/cumm. They were divided into two groups – 120 cases of preeclampsia with severe features and 115 cases of preeclampsia without severe features, classified according to the criteria of the American College of Obstetrics and Gynecology.[49] Preeclampsia with severe features was defined if the pregnant woman had any one of the following criteria – systolic blood pressure of 160 mmHg or more/diastolic blood pressure of 110 mmHg or more on two occasions, six or more hours apart; oliguria with excretion of <500 ml urine in 24 h; pulmonary edema or cyanosis; impairment of liver function tests; visual or cerebral disturbances; and pain in the epigastric area or right upper quadrant. Preeclampsia without severe features was diagnosed when a case had systolic blood pressure of 140 mmHg or higher/a diastolic blood pressure of 90 mmHg or higher was occurring after 20 weeks of gestation in a woman whose blood pressure was previously normal. As a control group, age-matched 203 cases of normal pregnant women were also included in the study. The normal pregnant women were also in 28–40 weeks of gestation. Women with a history of diabetes, hypertension, systemic or endocrine disorder, chronic infection, chronic renal disease, fetal anomaly and in labor were excluded from the study.
After obtaining informed written consent, 3 ml of venous blood was obtained from each patient under aseptic condition and collected into vacutainers containing ethylenediaminetetraacetic acid (EDTA). After calibration and running quality controls, the blood samples were analyzed in Beckman Coulter Act 5 Diff cell counter within 1 h of sampling. The PLT and PLT indices thus obtained were recorded. The PLT indices included MPV and PDW. The age, gestational age, pregnancy outcome, and blood pressure measurement were recorded for each case.
The data were analyzed using SPSS for Windows, version 20.0 (Chicago, Illinois, USA). All continuous data with normal distribution are represented as mean (standard deviation). Analysis of variance test and Student's t-test were used to test the variation of mean in different groups and its significance. P < 0.05 was considered statistically significant. Correlation coefficients between mean arterial pressure (MAP) and PLT indices were analyzed in preeclampsia cases. Receiver-operating characteristic curve (ROC) was used to estimate the cutoff value for predicting disease progression to severity. Regression analysis to describe their predictive values quantitatively was also performed. The study protocol was reviewed and approved by the Institutional Ethical Committee.
Results
The clinical details of the cases are given in Table 1. Cases of Preeclampsia with severe features are referred more frequently to our hospital, as these require more expertise and facilities to manage, which may not always be available in a community health center. Hence, in this study, there were more number of preeclampsia cases with severe features than cases without severe features. The groups were well matched for age and gestational age. As expected, the MAP was significantly higher in preeclampsia cases with severe features when compared to preeclampsia without severe features and normal pregnant cases (P < 0.001). Preeclampsia cases with severe features were more often nulliparous and underwent cesarean section frequently when compared to other groups. One case of preeclampsia with severe features was complicated by intrauterine death of the fetus, whereas all cases of preeclampsia without severe features and normal pregnancy had a good perinatal outcome. The mean birth weight of neonates was also lowest in the preeclampsia cases with severe features (2.6 ± 0.5 kg).
| Parameters (SD) | Preeclampsia with severe features (n=120) | Preeclampsia without severe features (n=115) | Normal pregnancy (n=203) | P |
|---|---|---|---|---|
| Age (years) | 23.5 (3.7) | 24 (3.5) | 23 (3.6) | 0.506 |
| Gestation age (weeks) | 36.5 (2) | 36.9 (1) | 37 (2.5) | 0.108 |
| Nulliparous (%) | 79 | 56 | 40 | - |
| MAP (mmHg) | 126.02 (7.6) | 113.88 (10.7) | 82.06 (9.1) | <0.001 |
| Cesarean section (%) | 58 | 38 | 4 | - |
| Perinatal mortality (%) | 0.7 | 0 | 0 | - |
| Birth weight (kg) | 2.6 (0.6) | 2.7 (0.4) | 2.8 (0.5) | 0.004 |
SD=Standard deviation, MAP=Mean arterial pressure
The mean values for PLT indices are given in Table 2. Despite the PLT count being normal (>1.5 lakh/cumm) in all the cases included, it was observed that PLT values decreased as the severity of the disease increased and was statistically significant when preeclampsia cases with severe features were compared with preeclampsia cases without severe features and normal pregnant cases (181.37 [38.94] vs. 210.55 [47], P < 0.001, and 181.37 [38.94] vs. 355.59 [78.92], P < 0.001, respectively). MPV and PDW values were significantly increased in preeclampsia with severe features group when compared to normal pregnancy and preeclampsia without severe features [Table 2].
| Parameter | Preeclampsia with severe features (n=120) | Preeclampsia without severe features (n=115) | Normal pregnancy (n=203) | P* |
|---|---|---|---|---|
| PLT (×103/µL) | 181 (38.9) | 210.55 (47)† | 355.59 (79)‡ | <0.001 |
| MPV (fl) | 11.67 (1.4) | 10.14 (1) | 8.07 (0.8) | <0.001 |
| PDW (fl) | 17.9 (2.2) | 15.48 (2.9) | 11.16 (2.71) | <0.001 |
*Two-way ANOVA. †Severe preeclampsia versus mild preeclampsia P<0.001, ‡Severe preeclampsia versus normal pregnancy P=0.001. ANOVA=Analysis of variance, MPV=Mean platelet volume, PDW=Platelet distribution width, PLT=Platelet count
To know the correlation between MAP and PLT indices, we used Pearson's product-moment correlation coefficient or Pearson's r, which is a measure of strength and direction of linear dependence between two variables. It ranges from + 1 to −1, where 1 indicates total positive correlation, 0 indicates no association, and −1 indicate total negative correlation. In both types of preeclampsia cases, PLT was statistically correlating with MAP in a negative manner [Table 3], whereas MPV and PDW values were positively correlating with MAP. Area under the curve (AUC) for each parameter in the ROC curve analysis showed that MPV and PDW have good diagnostic significance, of which MPV had the highest value (AUC = 0.78, 95% confidence interval [0.719–0.842]) [Table 4 and Figure 1]. Next, to estimate the cutoff value of the PLT indices for differentiating between preeclampsia with and without severe features, we investigated their sensitivity and specificity [Table 4]. Of all the PLT indices, MPV had the highest sensitivity and specificity to differentiate preeclampsia with and without severe features. MPV at a cutoff value of >10.95 fL had a sensitivity of 80% and specificity of 75%. On performing binary regression analysis on the PLT parameters, MPV was found to be more reliable in predicting the disease progression to severity than PDW [Table 5].
| MAP | P | |
|---|---|---|
| Platelet indices | Pearson’s correlation coefficients (r) | |
| PLT | −0.19 | 0.003 |
| MPV | 0.38 | <0.001 |
| PDW | 0.20 | 0.002 |
MAP=Mean arterial pressure, PDW=Platelet distribution width, MPV=Mean platelet volume, PLT=Platelet count
| Parameter | AUC | Cutoff value (fl) | Sensitivity (%) | Specificity (%) |
|---|---|---|---|---|
| MPV | 0.78 (CI: 0.719-0.842) | >10.95 | 80 | 75 |
| PDW | 0.742 (CI: 0.675-0.809) | >17.75 | 66 | 62 |
MPV=Mean platelet volume, PDW=Platelet distribution width, CI=Confidence interval, AUC=Area under the curve
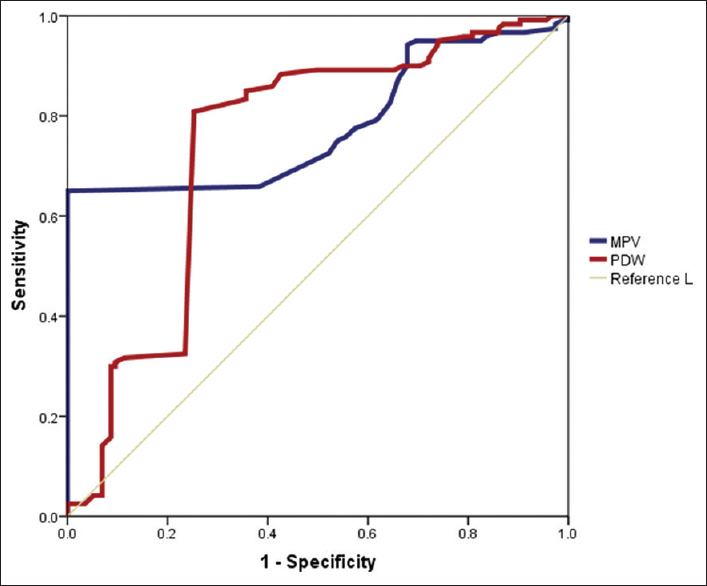
- Receiver operating characteristic curve for platelet indices in preeclampsia cases
| Blood coagulation parameters and platelet indices | Significance | OR |
|---|---|---|
| MPV | <0.001 | 3.16 |
| PDW | <0.001 | 1.57 |
OR=Odds ratio, MPV=Mean platelet volume, PDW=Platelet distribution width
Discussion
The results from our study showed that as the severity of preeclampsia increased, there was a decrease in PLT count, while MPV and PDW increased, which are consistent with previous reports.[510] It has been proposed that the thrombocytopenia seen in preeclampsia is due to peripheral consumption, destruction, and reduced life span of PLTs.[11] PLT size is determined at the level of the progenitor cell (megakaryocyte), and studies have reported that cytokines can lead to the production of more reactive, larger PLTs. Thus, the PLT volume has been proposed as an indirect marker of increased PLT reactivity.[12] The major pathophysiology leading to preeclampsia is due to the incomplete invasion of trophoblasts into spiral arterioles, leading to endothelial dysfunction and activation.[13] The resulting release of vasoactive amines, in turn, causes PLT activation with PLT swelling, pseudopodia formation, and accelerated release of new PLTs.[14] This leads to an increase in MPV and PDW. Hence, PLT count alone is not an indicator of the progression of the disease, and PLT parameters have to be investigated consequently in these cases.
Although PLT count remained well above the lower limit (>1.5 lakh/cumm), it was noted that the PLT count in our study decreased as the MAP increased. Mohapatra et al. also showed an inverse correlation between PLT count and blood pressure in pregnancy-induced hypertension.[3] In our study, we have also shown that a positive correlation with MAP was seen with PLT indices indicating the continuous activation of PLTs, well before there is a significant fall in the count.
When ROC curve was plotted for determining the diagnostic significance of PLT indices in preeclampsia, good diagnostic significance indicated by their higher AUC was noted. The most useful cutoff values of these indices for predicting disease progression in preeclampsia in clinical practice are unknown. Hence, to estimate the cutoff value of various PLT indices to predict the severity of preeclampsia, we investigated their sensitivity and specificity. At a cutoff value of 10.95fL, MPV was found to have sensitivity and specificity of 80% and 75%, respectively. von Dadelszen et al. have also reported that among the variable markers studied in 594 cases of preeclampsia, MPV: PLT ratio could independently predict the adverse maternal outcome in preeclampsia and opined that this change occurs due to peripheral consumption of PLTs.[15] Howarth et al. found that a probability plot constructed using discriminant analysis of MPV versus PLT for preeclampsia was useful in confirming risk of preeclampsia.[16] We have also found that among both MPV and PDW, MPV was more useful for predicting the disease progression to severe form. Among the various coagulative and PLT parameters studied by Han et al., thrombin time and MPV were found to have the highest AUC, suggesting that these markers were ideal for predicting the onset of the disease.[17] However, they also demonstrated that MPV was more robust as a severity marker when compared to thrombin time. Vagdatli et al. found that MPV and PDW were significantly increased in the study group comprising cases with PLT activation when compared to healthy controls. They opined that since serial measurement of PDW and MPV is not always possible, simultaneous rise in both will indicate PLT activation.[18] Even in our study, we have shown that at a cutoff value of >17.4%, PDW had sensitivity of 66% and specificity of 62%.
Other hematological and radiological variables studied along with PLT indices in preeclampsia have validated the use of MPV to prognosticate the disease progression.[192021] A study done by Kim et al. showed that PLT-lymphocyte ratio predicted a shorter time interval between admission and delivery of the preeclampsia cases.[19] Mannaerts et al. have found that among the inflammatory markers that can be analyzed from complete blood count, i.e., neutrophil-lymphocyte ratio, PLT-lymphocyte ratio, and MPV, the later could be a useful marker to estimate the onset of the disease in early pregnancy.[20] According to a study done by Abdel Razik et al., abnormal Doppler findings along with a significant increase of MPV and PDW had a higher incidence of developing severe preeclampsia.[21]
However, studies done by Calvert et al. and Makuyana et al. showed that there was no statistically significant change in PLT indices when compared to normal pregnancy, especially volume indices (MPV and PDW) in preeclamptic cases.[2223] Myatt et al. also found in their study that though the proportion of women with a MPV at or above the 75th percentile was higher among preeclamptics compared with normotensive women, MPV was not found to be associated with development of severe preeclampsia.[24] Ceyhan et al. who also found similar results, attributed the conflicting results of PLT indices in preeclampsia to the different methods of estimating them and choice of anticoagulant for the collection of blood.[25] The time duration between collection and estimation also influences the outcome of volume indices.[26] Since PLTs exhibit time-dependent swelling in EDTA, it is recommended that volume indices should be measured within 2 h after venipuncture.[27] Hence, for reliable volume indices measurement, either anticoagulant or time delay has to be controlled. Although time-dependent swelling of PLTs is not seen with citrate samples, in a study done by Lancé et al., it was shown that PLT count was most stable in blood collected in EDTA.[27] As practiced in most hospitals worldwide, even in our center the venous blood is collected in EDTA tubes for complete blood count. It is analyzed in Beckman Coulter Act 5 Diff cell counter by impendence method. The analysis is done within 1 h of collection of blood samples for all cases in accordance with the standard operating procedures of the laboratory. Since the time duration between sampling and analysis is standardized, the potential influence of anticoagulant on PLT swelling was not seen in our study. Hence, our study found statistically significant changes in PLT indices in preeclampsia patients.
Although there is a lack of prophylactic or many treatment options for preeclampsia, there is a need for biomarkers which could aid in the detection of this disorder and also have an impact on the management of a patient, like referring the patient to a higher center. Numerous candidate markers have been discussed in literature for screening and/or diagnostic utility with high sensitivity and specificity than clinical methods in preeclampsia cases. However, an ideal biomarker in a resource-poor setting should require limited technical assistance, be affordable, and have high accuracy.[28] Through this study, we have shown that PLT indices can be valuable tool in deciding the disease severity if standard measures are followed before and during analysis. PLT indices are readily available in most hematology counters when analyzing the complete blood count measurements. Even when EDTA is used, by controlling the time delay for analysis, PLT indices are useful candidate marker for preeclampsia cases with severe features. Further multicenter studies involving larger population are needed to estimate whether PLT indices could be used as a biomarker in preeclampsia.
Financial support and sponsorship
Nil.
Conflicts of interest
There are no conflicts of interest.
References
- Diagnosis and management of gestational hypertension and preeclampsia. Obstet Gynecol. 2003;102:181-92.
- [Google Scholar]
- Platelet estimation: Its prognostic value in pregnancy induced hypertension. Indian J Physiol Pharmacol. 2007;51:160-4.
- [Google Scholar]
- Preeclampsia: Are platelet count and indices useful for its prognostic? Hematology. 2013;18:360-4.
- [Google Scholar]
- Increased platelet volume and aggregation precede the onset of preeclampsia. Obstet Gynecol. 1994;83:146-9.
- [Google Scholar]
- Significance of the platelet distribution width as a severity marker for the development of preeclampsia. Eur J Obstet Gynecol Reprod Biol. 2014;175:107-11.
- [Google Scholar]
- Hypertension in pregnancy. Report of the American College of Obstetricians and Gynecologists' Task Force on Hypertension in Pregnancy. Obstet Gynecol. 2013;122:1122-31.
- [Google Scholar]
- Longitudinal study of platelet size changes in gestation and predictive power of elevated MPV in development of pre-eclampsia. Prenat Diagn. 2008;28:1052-6.
- [Google Scholar]
- Clinical management of established pre-eclampsia. Baillieres Best Pract Res Clin Obstet Gynaecol. 1999;13:77-93.
- [Google Scholar]
- Mean platelet volume as a predictor of cardiovascular risk: A systematic review and meta-analysis. J Thromb Haemost. 2010;8:148-56.
- [Google Scholar]
- Pre-eclampsia: Pathophysiology, diagnosis, and management. Vasc Health Risk Manag. 2011;7:467-74.
- [Google Scholar]
- The prediction of adverse maternal outcomes in preeclampsia. J Obstet Gynaecol Can. 2004;26:871-9.
- [Google Scholar]
- Platelet indices during normal pregnancy and pre-eclampsia. Br J Biomed Sci. 1999;56:20-2.
- [Google Scholar]
- Blood coagulation parameters and platelet indices: Changes in normal and preeclamptic pregnancies and predictive values for preeclampsia. PLoS One. 2014;9:e114488.
- [Google Scholar]
- Platelet distribution width: A simple, practical and specific marker of activation of coagulation. Hippokratia. 2010;14:28-32.
- [Google Scholar]
- Clinical significance of platelet-to-lymphocyte ratio in women with preeclampsia. Am J Reprod Immunol. 2018;80:e12973.
- [Google Scholar]
- Are neutrophil/lymphocyte ratio (NLR), platelet/lymphocyte ratio (PLR), and/or mean platelet volume (MPV) clinically useful as predictive parameters for preeclampsia? J Matern Fetal Neonatal Med. 2019;32:1412-9.
- [Google Scholar]
- Combined doppler ultrasound and platelet indices for prediction of preeclampsia in high-risk pregnancies. J Matern Fetal Neonatal Med. 2018;24:1-5.
- [Google Scholar]
- Poor predictive value of platelet count, mean platelet volume and serum urate in hypertension in pregnancy. Eur J Obstet Gynecol Reprod Biol. 1996;64:179-84.
- [Google Scholar]
- Liver and kidney function tests in normal and pre-eclamptic gestation – A comparison with non-gestational reference values. Cent Afr J Med. 2002;48:55-9.
- [Google Scholar]
- First-trimester prediction of preeclampsia in nulliparous women at low risk. Obstet Gynecol. 2012;119:1234-42.
- [Google Scholar]
- The effect of pre-eclampsia on complete blood count, platelet count and mean platelet volume. Ann Hematol. 2006;85:320-2.
- [Google Scholar]
- Mean platelet volume as an indicator of platelet activation: Methodological issues. Platelets. 2002;13:301-6.
- [Google Scholar]
- Do we need time adjusted mean platelet volume measurements? Lab Hematol. 2010;16:28-31.
- [Google Scholar]
- Towards biomarker-based tests that can facilitate decisions about prevention and management of preeclampsia in low-resource settings. Clin Chem Lab Med. 2016;54:17-27.
- [Google Scholar]


