Translate this page into:
Simultaneous determination of arginine, citrulline, and asymmetric dimethylarginine in plasma by reverse-phase high-performance liquid chromatography
Address for correspondence: Prof. P. V. L. N Srinivasa Rao, Department of Biochemistry, Sri Venkateswara Institute of Medical Sciences, Tirupati - 517 507, Andhra Pradesh, India. E-mail: seenupvln@yahoo.com
-
Received: ,
Accepted: ,
This is an open access article distributed under the terms of the Creative Commons Attribution-NonCommercial-ShareAlike 3.0 License, which allows others to remix, tweak, and build upon the work non-commercially, as long as the author is credited and the new creations are licensed under the identical terms.
This article was originally published by Medknow Publications & Media Pvt Ltd and was migrated to Scientific Scholar after the change of Publisher.
Abstract
BACKGROUND:
Arginine, citrulline and asymmetric dimethylarginine (ADMA) are three molecules in the nitric oxide (NO) pathway which provide useful information about vascular endothelial function. ADMA accumulates with patients with chronic kidney disease (CKD) and inhibits NO synthesis. We describe the modification of a previously established method for the measurement of amino acids analysis for simultaneous detection of arginine, citrulline, and ADMA in plasma and to validate its performance in patients with CKD.
MATERIALS AND METHODS:
Arginine, citrulline, and ADMA were simultaneously separated by reverse-phase high-performance liquid chromatography by precolumn derivatization with O-phthalaldehyde using the modified method. It was then applied for analysis in thirty patients with CKD and thirty healthy controls so as to cover the entire measuring range, i.e., normal and uremic range.
RESULTS:
The method showed a good performance in terms of linearity, precision, and recovery. The detection limit of the assay for ADMA was found to be 0.05 μmol/L at a signal-to-noise ratio of 3:1. The average within run coefficient of variation for ADMA using this method was 4.7% in the normal range and 1.9% in the uremic range, while the average between-day precision in the normal and uremic range was 6.5% and 5.2%, respectively. Patients with CKD were found to have higher concentration of ADMA compared to controls.
CONCLUSION:
This method can be useful in assessing the baseline cardiovascular risk in an individual as well as in the follow-up of the patients who are receiving L-arginine, and thus, assess the response to treatment by simultaneous measurement of arginine and ADMA.
Keywords
Arginine
asymmetric dimethylarginine
citrulline
reverse-phase high-performance liquid chromatography
Introduction
Asymmetric dimethylarginine (ADMA) is a naturally occurring guanidine compound (amino acid) in circulating blood. It is synthesized during the methylation of protein arginine residues by S-adenosylmethionine (SAM): Protein arginine methyltransferases. These enzymes transfer the methyl group from SAM to arginine thus forming methylated arginine and S-adenosylhomocysteine.[1] Vallance et al. first described the clinical importance of ADMA as an inhibitor of nitric oxide (NO) synthase.[2] ADMA competes with arginine for the binding site of NO synthase and inhibits NO production within pathophysiological ranges observed in humans.[3]
ADMA is cleared through renal excretion and through metabolism by dimethylarginine dimethyl aminohydrolase.[4] As ADMA is excreted in the urine, it accumulates in the blood as the kidneys fail. Dysfunction of the L-arginine/NO pathway secondary to accumulation of ADMA has been implicated in a number of clinical situations such as hypertension,[5] diabetes mellitus,[6] and renal failure.[7] Increased plasma ADMA concentrations have been implicated as an independent risk factor for progression of atherosclerosis, cardiovascular death, and all-cause mortality.[8910]
Many analytical methods have been described for the quantification of ADMA in plasma and urine. These include enzyme-linked immunosorbent assay (ELISA),[11] high-performance liquid chromatography (HPLC) with fluorescence detection,[1213141516] capillary electrophoresis,[17] liquid chromatography coupled to mass spectrometry (LC-MS),[1819] gas chromatography coupled to MS.[2021]
We sought to adapt a previously described method for amino acid analysis by reverse-phase HPLC[22] which could be used for simultaneous measurement of the important amino acids involved in NO pathway, i.e., arginine, citrulline, and ADMA along with other amino acids.
Materials and Methods
The method is based on the principle of derivatization of amino acids with O-phthalaldehyde (OPA) to give a unique, substituted isoindole product, the fluorescence of which is measured by HPLC using a fluorescence detector. OPA, 2-mercaptoethanol (ME) and amino acids-ADMA, arginine, and citrulline were purchased from Sigma (St. Louis, MO, USA). HPLC grade methanol and water from Merck (Merck Life Science Private Limited, Mumbai, India) were used for the preparation of mobile phase. Chromatographic experiments were performed using a Shimadzu (Kyoto, Japan) LC-20A HPLC system, a RF-10AXL fluorescence detector. Separation was performed using a 150 mm × 4.6 mm Novapak C18 column with a particle size of 5 μ protected by a C18 Guard-Pak cartridge (Shimadzu, Kyoto, Japan).
For standardization, a stock solution of 1 mM for each amino acid was prepared in HPLC grade water and stored at −80°C. A working solution of 0.1 mM of each amino acid was prepared in HPLC grade water. Then, a mixture containing all amino acids was prepared by pooling each solution volume to volume. The mobile solution consisted of solvent A and B. Solvent A, was sodium acetate buffer of 50 mM concentration, was prepared in HPLC grade water and pH adjusted to 6.8 with 1N acetic acid. Buffer was filtered through a 0.2μ filter. Solvent B was prepared by mixing methanol and tetrahydrofuran (THF) in a ratio 97:3 (v/v). For derivatization of amino acids, 10 mg of OPA was dissolved in 0.5 ml methanol to which 2 ml of 0.4 M borate (0.4 M boric acid adjusted to pH 10.0 with KOH) buffer and 30 μL ME were added.
Deproteinization of samples was performed using three methods, i.e., using 5-sulphosalicylic acid (5-SSA), methanol, and ethanol as previously described.[2223] To 1.0 ml plasma, 20 mg of 5-SSA was added and the mixture was left in an ice bath for 10 min. The precipitated protein was removed by centrifugation at 2000 g for 10 min. The supernatant was filtered through a 0.2μ filter for analysis. For precipitation by ethanol/methanol, 0.5 ml of ethanol/methanol were added to 1.0 ml plasma, mixed on a rotary cyclomixer for 10 min, and then, centrifuged at 2000 × g for 20 min.
Following deproteinization, 100 μl of OPA/ME was added to 10 μl of sample or standard solution. Vials were capped, shaken for 2 min. Twenty microliters of the aliquots of the sample/standard was then introduced into HPLC column for analysis.
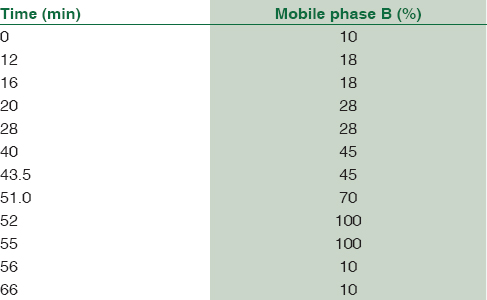
Mobile phase consisting of 50 mM sodium acetate (pH-6.8) methanol and THF was degassed before use. Each component of the mobile phase was filtered through a 0.2μ filter. All separations were performed at room temperature and at a flow rate of 1.5 ml/min. The flow gradients were introduced as shown in Table 1. The wavelengths of the fluorescence detector were set at 338 nm and 425 nm for excitation and emission, respectively. The areas under the peak were used for quantitation.
For each amino acid, calibration curves using amino acid concentrations corresponding to values observed in normal individuals to values observed in uremic conditions were plotted (citrulline – 50, 75, 100, 125, 150 μmol/L; arginine – 75, 100, 125, 150, 175 μmol/L; and ADMA – 0.5, 1.0, 2.5, 5, 10 μmol/L). Figure 3 shows the amino acid standards run. Finally, a stock standard containing all amino acids was prepared by adding each solution volume by volume corresponding to values observed in normal state and in uremic state were prepared and were used for two-point calibration (citrulline – 50, 100 μmol/L; arginine – 75, 150 μmol/L and ADMA – 1.0, 5.0 μmol/L). Calibration curve for ADMA is shown in Figure 4.
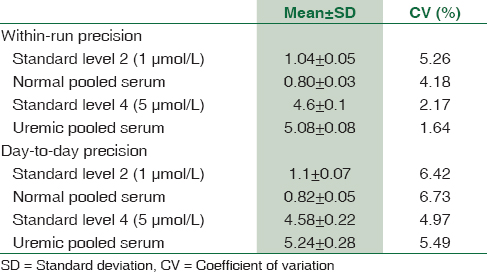
For the method evaluation experiments, each amino acid standard at two levels (normal level and uremic level) and pooled serum samples containing concentrations in the normal range and the uremic range were used for within-run and between-run precision [Table 2]. Five runs for each standard and serum aliquot were performed the same day for within-day precision. For between-day precision, each aliquot of standard and serum samples were run in duplicates for ten consecutive days. Further, linearity of ADMA using different concentrations from 0.5 to 100 μmol/L of ADMA was tested. Three samples with low, medium, and high concentrations were spiked with ADMA to study recovery. Recovery experiment was performed by spiking serum samples with different concentrations of ADMA standard solution [Table 3] percentage recovery was calculated as follows:

Recovery % = ([final concentration − initial concentration] × 100)/added concentration.
After method evaluation experiments were successful, the method was used for simultaneous measurement of arginine, citrulline, and ADMA in the study subjects. The study subjects included 30 healthy subjects who were nonsmokers, nondiabetic as per the American Diabetic Association criteria and nonhypertensive as per the Joint Committee Guidelines VII and thirty patients diagnosed with chronic kidney disease (CKD) (Stages 3 and 4) as per the National kidney foundation kidney disease quality initiative criteria, attending the Nephrology Outpatient Department of a Tertiary Care Hospital in South India, after obtaining Institutional Ethics Clearance (IEC 570). Patients with acute renal failure, acute on CKD, smoking, congestive heart failure, pregnant women, pediatric age group (<18 years), and those not willing to participate were excluded from the study. Five milliliters of venous blood was collected in a plain bulb. Blood was allowed to clot and then separated by centrifuging at 2000 RPM for 20 min. Separated serum was stored at −80°C until further analysis.
Results
Deproteinization of samples using three methods, i.e., using 5-SSA, methanol, and ethanol were compared [Figure 1]. Results using either methanol or ethanol gave similar results, while the SSA method gave an additional SSA peak. We chose the method of deproteinization using methanol since methanol is one of the mobile phases used for elution and thus minimizes matrix problems.
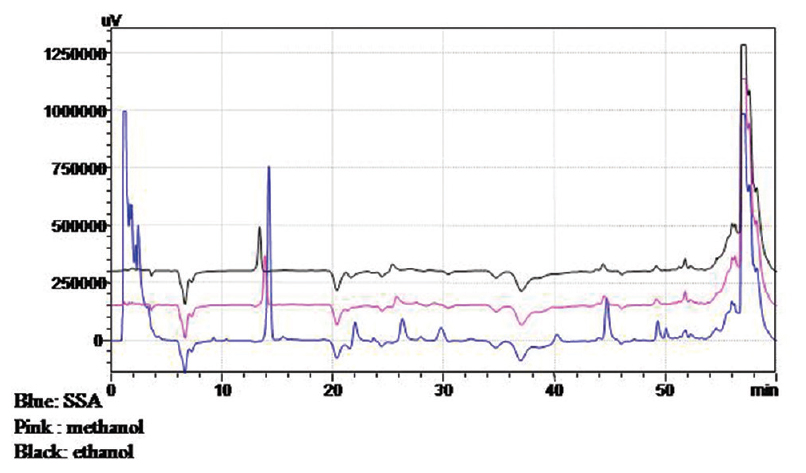
- Comparison of three different precipitating agents. Blue = Sulfosalicylic acid, Pink = Methanol, Black = Ethanol
All the three amino acids, i.e., arginine, citrulline, and ADMA along with others [Figure 3] could be separated using a mobile phase consisting of 50 mM sodium acetate (pH-6.8) methanol and THF and a gradient program as shown in Table 1. The retention times were 24.2 min for citrulline, 24.6 min for arginine, and 29.8 min for ADMA.
The mean, standard deviation, and coefficient of variation (CV) were calculated for within-day and between-day precision [Table 3]. The average within-day CV in the normal range and the uremic range were 4.7% and 1.9%, respectively, while the average between-day precision in the normal and uremic range were 6.5% and 5.2%, respectively. Measurement of ADMA using different concentrations from 0.5 to 100 μmol/L of ADMA was found to be linear. The detection limit of the assay was fund to be 0.05 μmol/L at a signal-to-noise ratio of 3:1. The average recovery was 92% in the normal range and 95.6% in the uremic range.
The concentration of the three amino acids in CKD patients and in normal healthy controls is shown in Table 4. CKD patients had significantly higher ADMA levels compared to controls (P < 0.001). No significant difference was noted in arginine and citrulline levels between the two groups.

Discussion
The separation of ADMA along with amino acids in a single run can be difficult if the proper mobile phase and gradient program are not maintained. This is especially true with respect to citrulline, arginine, and ADMA. This is owing to the structural similarity and a very small difference in polarity of the two amino acids.
We sought to adopt the method of Rajendra[22] for amino acid separation to simultaneously measure ADMA along with other amino acids. This method used a mobile phase of sodium acetate 0.1 M at a pH of 7.2. However, at this concentration of mobile phase, we could not separate arginine and ADMA completely owing to their structural similarity [Figure 2]. Chen et al.[13] described a method for ADMA separation along with amino acids in a single run using a mobile phase consisting of 50 mM sodium acetate (pH 6.8), methanol, and THF ([A] 82:17:1; [B] 22:77:1). The gradient program was different from the method of Rajendra. In their analytical run, though they obtained a good resolution for arginine and ADMA, citrulline coeluted along with threonine.
![Amino acid separation along with asymmetric dimethyl arginine using a previously described method[22]](/content/164/2017/9/4/img/JLP-9-243-g006.png)
- Amino acid separation along with asymmetric dimethyl arginine using a previously described method[22]
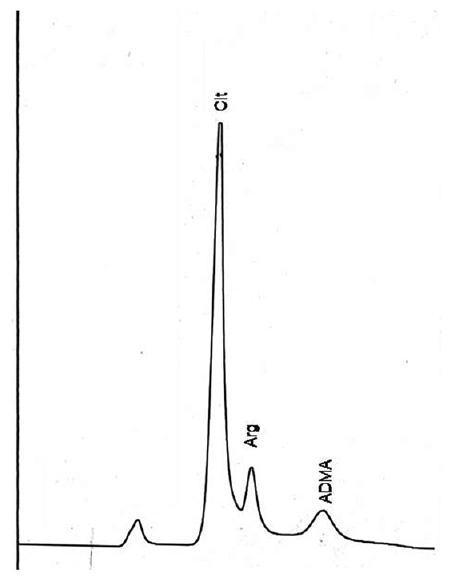
- Amino acid standard runshows
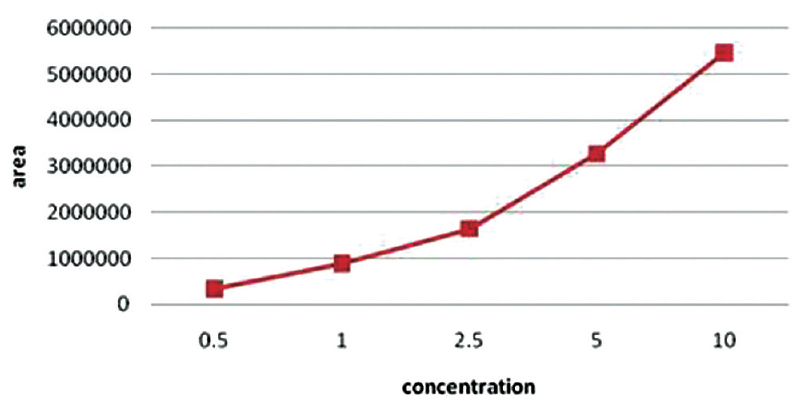
- Standard curve for asymmetric dimethyl arginine
We got a good separation of the three amino acids, i.e., arginine, citrulline, and ADMA along with others [Figure 3] using a mobile phase consisting of 50 mM sodium acetate (pH-6.8) methanol and THF and a gradient program as shown in Table 1. We were also able to baseline resolve both citrulline as well as threonine [Figure 5].
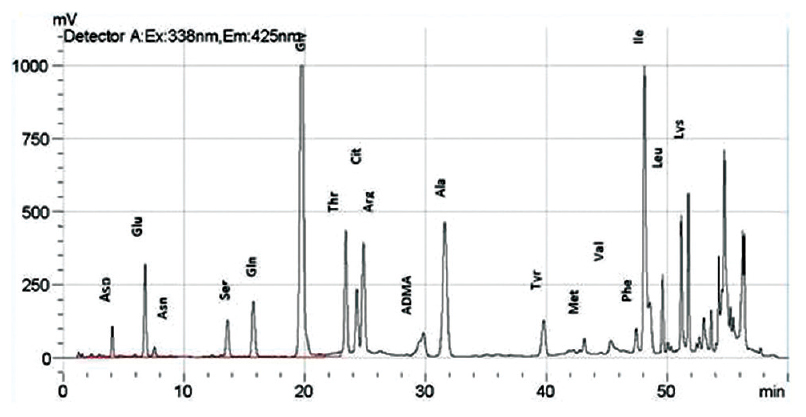
- Chromatogram of amino acids along with asymmetric dimethyl arginine
The performance of the method was comparable to other methods previously described. Our method showed a recovery ranging from 92% to 96% and CV of 1.9% to 6.5%. The CV was more in the normal range (6.5%) compared to the uremic range (5.2%) for between-day precision. Chen et al.[13] reported a recovery of over 96% and CV of less than 3.80% for the inter- and intra-assay precision of their method. Using LC-MS, Martens-Lobenhoffer and Bode-Böger[18] reported an interassay relative standard deviation of 5.7% and intraassay relative standard deviation of 7.5%. Schulze et al. reported CV of 4.5% to 7.5% for intraassay precision and 8.3% to 10.3% for interassay precision for their ELISA method. The mean recovery for their ELISA method was 94.6% for human serum. The sensitivity of our method was 0.05 μmol/L. Chen et al.[13] reported a sensitivity of one picomol for their method. Martens-Lobenhoffer and Bode-Böger[18] reported a sensitivity of 0.2 μmol/L for their LC-MS method while Schulze et al.[11] reported a sensitivity of 0.05 μmol/L for their ELISA method.
Application of this method for measurement of arginine, citrulline, and ADMA in healthy subjects and patients with CKD showed that patients with CKD had significantly higher levels of ADMA compared to controls. CKD patients have elevated levels of ADMA owing to their impaired clearance.
This simple method for amino acid analysis can thus be used for simultaneous measurement of citrulline, ADMA, and arginine; three important amino acids in the NO synthetic pathway. This method does not involve complicated sample preparation protocol. Given the clinical importance of endothelial dysfunction which precedes overt coronary artery disease,[9] it is important to assess endothelial function.
This method is cost-effective compared to ELISA wherever technical expertise is available. ELISA can measure only one analyte at a time and thus different ELISA kits/methods would be required for analysis of arginine, citrulline, and ADMA while our method involves simultaneous measurement of arginine, citrulline, and ADMA. Assessing ADMA levels can be useful in assessing the endothelial function and thus aid in cardiovascular risk assessment of an individual. Pharmacological interventions with L-arginine have been shown to improve endothelium-mediated vasodilatation in people with high ADMA levels.
Conclusion
This method can thus be useful in assessing not only the baseline cardiovascular risk in an individual but can also be useful in follow-up of the patients who are receiving L-arginine and thus assess the response to treatment by simultaneous measurement of arginine and ADMA.
Financial support and sponsorship
Nil.
Conflicts of interest
There are no conflicts of interest.
References
- Structural specificity of substrate for S-adenosylmethionine:protein arginine N-methyltransferases. Biochim Biophys Acta. 1995;1248:11-8.
- [Google Scholar]
- Accumulation of an endogenous inhibitor of nitric oxide synthesis in chronic renal failure. Lancet. 1992;339:572-5.
- [Google Scholar]
- The emerging role of asymmetric dimethylarginine as a novel cardiovascular risk factor. Cardiovasc Res. 2003;59:824-33.
- [Google Scholar]
- Occurrence of a new enzyme catalyzing the direct conversion of NG, NG-dimethyl-L-arginine to L-citrulline in rats. Biochem Biophys Res Commun. 1987;148:671-7.
- [Google Scholar]
- Abnormal endothelium-dependent vascular relaxation in patients with essential hypertension. N Engl J Med. 1990;323:22-7.
- [Google Scholar]
- Impaired endothelium-dependent vasodilation in patients with insulin-dependent diabetes mellitus. Circulation. 1993;88:2510-6.
- [Google Scholar]
- ADMA: A novel risk factor that explains excess cardiovascular event rate in patients with end-stage renal disease. Atheroscler Suppl. 2003;4:23-8.
- [Google Scholar]
- Plasma levels of asymmetrical dimethylarginine and adverse cardiovascular events after percutaneous coronary intervention. Eur Heart J. 2003;24:1912-9.
- [Google Scholar]
- Risk of acute coronary events and serum concentration of asymmetrical dimethylarginine. Lancet. 2001;358:2127-8.
- [Google Scholar]
- The role of asymmetric dimethylarginine (ADMA) in endothelial dysfunction and cardiovascular disease. Curr Cardiol Rev. 2010;6:82-90.
- [Google Scholar]
- Determination of asymmetric dimethylarginine (ADMA) using a novel ELISA assay. Clin Chem Lab Med. 2004;42:1377-83.
- [Google Scholar]
- Determination of dimethylated arginines in human plasma by high-performance liquid chromatography. J Chromatogr B Biomed Sci Appl. 1997;692:257-62.
- [Google Scholar]
- Determination of N(G), N(G)-dimethylarginine in human plasma by high-performance liquid chromatography. J Chromatogr B Biomed Sci Appl. 1997;692:467-71.
- [Google Scholar]
- Determination of dimethylated arginines in human plasma by high-performance liquid chromatography. J Chromatogr B Biomed Sci Appl. 1998;705:174-6.
- [Google Scholar]
- Determination of arginine, asymmetric dimethylarginine, and symmetric dimethylarginine in human plasma and other biological samples by high-performance liquid chromatography. Anal Biochem. 2002;303:131-7.
- [Google Scholar]
- Simultaneous determination of arginine and seven metabolites in plasma by reversed-phase liquid chromatography with a time-controlled ortho-phthaldialdehyde precolumn derivatization. Anal Biochem. 2004;326:87-92.
- [Google Scholar]
- Determination of asymmetrical dimethylarginine by capillary electrophoresis-laser-induced fluorescence. J Chromatogr B Biomed Sci Appl. 2000;741:77-83.
- [Google Scholar]
- Simultaneous detection of arginine, asymmetric dimethylarginine, symmetric dimethylarginine and citrulline in human plasma and urine applying liquid chromatography-mass spectrometry with very straight forward sample preparation. J Chromatogr B Analyt Technol Biomed Life Sci. 2003;798:231-9.
- [Google Scholar]
- Simultaneous determination of L-arginine and its mono- and dimethylated metabolites in human plasma by high-performance liquid chromatography-mass spectrometry. Anal Bioanal Chem. 2004;380:643-9.
- [Google Scholar]
- Determination of NG, NG-dimethyl-L-arginine, an endogenous NO synthase inhibitor, by gas chromatography-mass spectrometry. J Chromatogr B Analyt Technol Biomed Life Sci. 2004;809:59-65.
- [Google Scholar]
- Analysis of the L-arginine/nitric oxide (NO) pathway. The unique role of mass spectrometry. Curr Pharm Anal. 2005;1:15-30.
- [Google Scholar]
- High performance liquid chromatography determination of amino acids in biological samples by pre column derivatization with O-pthaldialdehyde. J Liq Chromatogr. 1987;10:941-55.
- [Google Scholar]
- Plasma amino acids determined by liquid chromatography within 17 minutes. Clin Chem. 1994;40:245-9.
- [Google Scholar]


